Races in Benton City, Washington (WA) Detailed Stats
Data:
Races - White alone (%)
Races - White alone (% change since 2000)
Races - Black alone (%)
Races - Black alone (% change since 2000)
Races - American Indian alone (%)
Races - American Indian alone (% change since 2000)
Races - Asian alone (%)
Races - Asian alone (% change since 2000)
Races - Hispanic (%)
Races - Hispanic (% change since 2000)
Races - Native Hawaiian and Other Pacific Islander alone (%)
Races - Native Hawaiian and Other Pacific Islander alone (% change since 2000)
Races - Two or more races(%)
Races - Two or more races(% change since 2000)
Races - Other race alone (%)
Races - Other race alone (% change since 2000)
Racial diversity
Place of birth - Born in state of residence (%)
Place of birth - Born in state of residence (%) - White
Place of birth - Born in state of residence (%) - Black or African American
Place of birth - Born in state of residence (%) - Asian
Place of birth - Born in state of residence (%) - Hispanic or Latino
Place of birth - Born in state of residence (%) - American Indian and Alaska Native
Place of birth - Born in state of residence (%) - Multirace
Place of birth - Born in state of residence (%) - Other Race
Place of birth - Born in other state (%)
Place of birth - Born in other state (%) - White
Place of birth - Born in other state (%) - Black or African American
Place of birth - Born in other state (%) - Asian
Place of birth - Born in other state (%) - Hispanic or Latino
Place of birth - Born in other state (%) - American Indian and Alaska Native
Place of birth - Born in other state (%) - Multirace
Place of birth - Born in other state (%) - Other Race
Place of birth - Native, outside of US (%)
Place of birth - Native, outside of US (%) - White
Place of birth - Native, outside of US (%) - Black or African American
Place of birth - Native, outside of US (%) - Asian
Place of birth - Native, outside of US (%) - Hispanic or Latino
Place of birth - Native, outside of US (%) - American Indian and Alaska Native
Place of birth - Native, outside of US (%) - Multirace
Place of birth - Native, outside of US (%) - Other Race
Place of birth - Foreign born (%)
Place of birth - Foreign born (%) - White
Place of birth - Foreign born (%) - Black or African American
Place of birth - Foreign born (%) - Asian
Place of birth - Foreign born (%) - Hispanic or Latino
Place of birth - Foreign born (%) - American Indian and Alaska Native
Place of birth - Foreign born (%) - Multirace
Place of birth - Foreign born (%) - Other Race
Residents speaking English at home (%)
Residents speaking English at home - Born in the United States (%)
Residents speaking English at home - Native, born elsewhere (%)
Residents speaking English at home - Foreign born (%)
Residents speaking Spanish at home (%)
Residents speaking Spanish at home - Born in the United States (%)
Residents speaking Spanish at home - Native, born elsewhere (%)
Residents speaking Spanish at home - Foreign born (%)
Residents speaking other language at home (%)
Residents speaking other language at home - Born in the United States (%)
Residents speaking other language at home - Native, born elsewhere (%)
Residents speaking other language at home - Foreign born (%)
Marital status - Never married (%)
Marital status - Now married (%)
Marital status - Separated (%)
Marital status - Widowed (%)
Marital status - Divorced (%)
Ancestries Reported - Arab (%)
Ancestries Reported - Czech (%)
Ancestries Reported - Danish (%)
Ancestries Reported - Dutch (%)
Ancestries Reported - English (%)
Ancestries Reported - French (%)
Ancestries Reported - French Canadian (%)
Ancestries Reported - German (%)
Ancestries Reported - Greek (%)
Ancestries Reported - Hungarian (%)
Ancestries Reported - Irish (%)
Ancestries Reported - Italian (%)
Ancestries Reported - Lithuanian (%)
Ancestries Reported - Norwegian (%)
Ancestries Reported - Polish (%)
Ancestries Reported - Portuguese (%)
Ancestries Reported - Russian (%)
Ancestries Reported - Scotch-Irish (%)
Ancestries Reported - Scottish (%)
Ancestries Reported - Slovak (%)
Ancestries Reported - Subsaharan African (%)
Ancestries Reported - Swedish (%)
Ancestries Reported - Swiss (%)
Ancestries Reported - Ukrainian (%)
Ancestries Reported - United States (%)
Ancestries Reported - Welsh (%)
Ancestries Reported - West Indian (%)
Ancestries Reported - Other (%)
Geographical mobility - Same house 1 year ago (%)
Geographical mobility - Same house 1 year ago (%) - White
Geographical mobility - Same house 1 year ago (%) - Black or African American
Geographical mobility - Same house 1 year ago (%) - Asian
Geographical mobility - Same house 1 year ago (%) - Hispanic or Latino
Geographical mobility - Same house 1 year ago (%) - American Indian and Alaska Native
Geographical mobility - Same house 1 year ago (%) - Multirace
Geographical mobility - Same house 1 year ago (%) - Other Race
Geographical mobility - Moved within same county (%)
Geographical mobility - Moved within same county (%) - White
Geographical mobility - Moved within same county (%) - Black or African American
Geographical mobility - Moved within same county (%) - Asian
Geographical mobility - Moved within same county (%) - Hispanic or Latino
Geographical mobility - Moved within same county (%) - American Indian and Alaska Native
Geographical mobility - Moved within same county (%) - Multirace
Geographical mobility - Moved within same county (%) - Other Race
Geographical mobility - Moved from different county within same state (%)
Geographical mobility - Moved from different county within same state (%) - White
Geographical mobility - Moved from different county within same state (%) - Black or African American
Geographical mobility - Moved from different county within same state (%) - Asian
Geographical mobility - Moved from different county within same state (%) - Hispanic or Latino
Geographical mobility - Moved from different county within same state (%) - American Indian and Alaska Native
Geographical mobility - Moved from different county within same state (%) - Multirace
Geographical mobility - Moved from different county within same state (%) - Other Race
Geographical mobility - Moved from different state (%)
Geographical mobility - Moved from different state (%) - White
Geographical mobility - Moved from different state (%) - Black or African American
Geographical mobility - Moved from different state (%) - Asian
Geographical mobility - Moved from different state (%) - Hispanic or Latino
Geographical mobility - Moved from different state (%) - American Indian and Alaska Native
Geographical mobility - Moved from different state (%) - Multirace
Geographical mobility - Moved from different state (%) - Other Race
Geographical mobility - Moved from abroad (%)
Geographical mobility - Moved from abroad (%) - White
Geographical mobility - Moved from abroad (%) - Black or African American
Geographical mobility - Moved from abroad (%) - Asian
Geographical mobility - Moved from abroad (%) - Hispanic or Latino
Geographical mobility - Moved from abroad (%) - American Indian and Alaska Native
Geographical mobility - Moved from abroad (%) - Multirace
Geographical mobility - Moved from abroad (%) - Other Race
Place of birth for the foreign-born population - Ireland (%)
Place of birth for the foreign-born population - Denmark (%)
Place of birth for the foreign-born population - Norway (%)
Place of birth for the foreign-born population - Sweden (%)
Place of birth for the foreign-born population - United Kingdom (%)
Place of birth for the foreign-born population - England (%)
Place of birth for the foreign-born population - Scotland (%)
Place of birth for the foreign-born population - Other Northern Europe (%)
Place of birth for the foreign-born population - Austria (%)
Place of birth for the foreign-born population - Belgium (%)
Place of birth for the foreign-born population - France (%)
Place of birth for the foreign-born population - Germany (%)
Place of birth for the foreign-born population - Netherlands (%)
Place of birth for the foreign-born population - Switzerland (%)
Place of birth for the foreign-born population - Other Western Europe (%)
Place of birth for the foreign-born population - Greece (%)
Place of birth for the foreign-born population - Italy (%)
Place of birth for the foreign-born population - Portugal (%)
Place of birth for the foreign-born population - Spain (%)
Place of birth for the foreign-born population - Other Southern Europe (%)
Place of birth for the foreign-born population - Albania (%)
Place of birth for the foreign-born population - Belarus (%)
Place of birth for the foreign-born population - Bosnia and Herzegovina (%)
Place of birth for the foreign-born population - Bulgaria (%)
Place of birth for the foreign-born population - Croatia (%)
Place of birth for the foreign-born population - Czechoslovakia (%)
Place of birth for the foreign-born population - Hungary (%)
Place of birth for the foreign-born population - Latvia (%)
Place of birth for the foreign-born population - Lithuania (%)
Place of birth for the foreign-born population - North Macedonia (Macedonia) (%)
Place of birth for the foreign-born population - Moldova (%)
Place of birth for the foreign-born population - Poland (%)
Place of birth for the foreign-born population - Romania (%)
Place of birth for the foreign-born population - Russia (%)
Place of birth for the foreign-born population - Serbia (%)
Place of birth for the foreign-born population - Ukraine (%)
Place of birth for the foreign-born population - Other Eastern Europe (%)
Place of birth for the foreign-born population - China (%)
Place of birth for the foreign-born population - Hong Kong (%)
Place of birth for the foreign-born population - Taiwan (%)
Place of birth for the foreign-born population - Japan (%)
Place of birth for the foreign-born population - Korea (%)
Place of birth for the foreign-born population - Other Eastern Asia (%)
Place of birth for the foreign-born population - Afghanistan (%)
Place of birth for the foreign-born population - Bangladesh (%)
Place of birth for the foreign-born population - India (%)
Place of birth for the foreign-born population - Iran (%)
Place of birth for the foreign-born population - Kazakhstan (%)
Place of birth for the foreign-born population - Nepal (%)
Place of birth for the foreign-born population - Pakistan (%)
Place of birth for the foreign-born population - Sri Lanka (%)
Place of birth for the foreign-born population - Uzbekistan (%)
Place of birth for the foreign-born population - Other South Central Asia (%)
Place of birth for the foreign-born population - Burma (%)
Place of birth for the foreign-born population - Cambodia (%)
Place of birth for the foreign-born population - Indonesia (%)
Place of birth for the foreign-born population - Laos (%)
Place of birth for the foreign-born population - Malaysia (%)
Place of birth for the foreign-born population - Philippines (%)
Place of birth for the foreign-born population - Singapore (%)
Place of birth for the foreign-born population - Thailand (%)
Place of birth for the foreign-born population - Vietnam (%)
Place of birth for the foreign-born population - Other South Eastern Asia (%)
Place of birth for the foreign-born population - Armenia (%)
Place of birth for the foreign-born population - Iraq (%)
Place of birth for the foreign-born population - Israel (%)
Place of birth for the foreign-born population - Jordan (%)
Place of birth for the foreign-born population - Kuwait (%)
Place of birth for the foreign-born population - Lebanon (%)
Place of birth for the foreign-born population - Saudi Arabia (%)
Place of birth for the foreign-born population - Syria (%)
Place of birth for the foreign-born population - Turkey (%)
Place of birth for the foreign-born population - Yemen (%)
Place of birth for the foreign-born population - Other Western Asia (%)
Place of birth for the foreign-born population - Eritrea (%)
Place of birth for the foreign-born population - Ethiopia (%)
Place of birth for the foreign-born population - Kenya (%)
Place of birth for the foreign-born population - Somalia (%)
Place of birth for the foreign-born population - Uganda (%)
Place of birth for the foreign-born population - Zimbabwe (%)
Place of birth for the foreign-born population - Other Eastern Africa (%)
Place of birth for the foreign-born population - Cameroon (%)
Place of birth for the foreign-born population - Congo (%)
Place of birth for the foreign-born population - Democratic Republic of Congo (Zaire) (%)
Place of birth for the foreign-born population - Other Middle Africa (%)
Place of birth for the foreign-born population - Egypt (%)
Place of birth for the foreign-born population - Morocco (%)
Place of birth for the foreign-born population - Sudan (%)
Place of birth for the foreign-born population - Other Northern Africa (%)
Place of birth for the foreign-born population - South Africa (%)
Place of birth for the foreign-born population - Other Southern Africa (%)
Place of birth for the foreign-born population - Cabo Verde (%)
Place of birth for the foreign-born population - Ghana (%)
Place of birth for the foreign-born population - Liberia (%)
Place of birth for the foreign-born population - Nigeria (%)
Place of birth for the foreign-born population - Senegal (%)
Place of birth for the foreign-born population - Sierra Leone (%)
Place of birth for the foreign-born population - Other Western Africa (%)
Place of birth for the foreign-born population - Australia (%)
Place of birth for the foreign-born population - New Zealand (%)
Place of birth for the foreign-born population - Fiji (%)
Place of birth for the foreign-born population - Micronesia (%)
Place of birth for the foreign-born population - Bahamas (%)
Place of birth for the foreign-born population - Barbados (%)
Place of birth for the foreign-born population - Cuba (%)
Place of birth for the foreign-born population - Dominica (%)
Place of birth for the foreign-born population - Dominican Republic (%)
Place of birth for the foreign-born population - Grenada (%)
Place of birth for the foreign-born population - Haiti (%)
Place of birth for the foreign-born population - Jamaica (%)
Place of birth for the foreign-born population - St. Vincent and the Grenadines (%)
Place of birth for the foreign-born population - Trinidad and Tobago (%)
Place of birth for the foreign-born population - West Indies (%)
Place of birth for the foreign-born population - Other Caribbean (%)
Place of birth for the foreign-born population - Belize (%)
Place of birth for the foreign-born population - Costa Rica (%)
Place of birth for the foreign-born population - El Salvador (%)
Place of birth for the foreign-born population - Guatemala (%)
Place of birth for the foreign-born population - Honduras (%)
Place of birth for the foreign-born population - Mexico (%)
Place of birth for the foreign-born population - Nicaragua (%)
Place of birth for the foreign-born population - Panama (%)
Place of birth for the foreign-born population - Other Central America (%)
Place of birth for the foreign-born population - Argentina (%)
Place of birth for the foreign-born population - Bolivia (%)
Place of birth for the foreign-born population - Brazil (%)
Place of birth for the foreign-born population - Chile (%)
Place of birth for the foreign-born population - Colombia (%)
Place of birth for the foreign-born population - Ecuador (%)
Place of birth for the foreign-born population - Guyana (%)
Place of birth for the foreign-born population - Peru (%)
Place of birth for the foreign-born population - Uruguay (%)
Place of birth for the foreign-born population - Venezuela (%)
Place of birth for the foreign-born population - Other South America (%)
Place of birth for the foreign-born population - Canada (%)
Place of birth for the foreign-born population - Other Northern America (%)
Place of birth for the foreign-born population - Other (%)
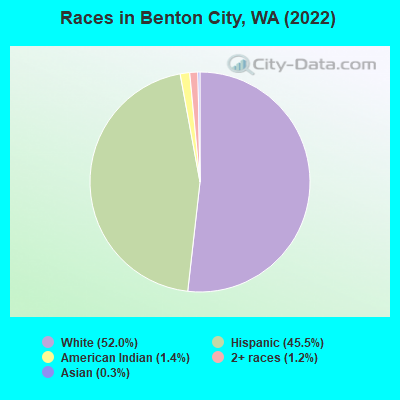
According to 2022 data, the most numerous races in Benton City, WA are White alone (1,864 residents), Hispanic (1,630 residents), and Asian alone (9 residents). 70.6% of Benton City residents speak English at home. 18.4% of Benton City, WA residents are foreign-born (16.8% born in Latin America), which is 18.4% greater than the foreign-born rate of 15.0% across the entire state of Washington.
Race distribution in Benton City
2000 2022
4,652,490 78.9% White alone 441,509 7.5% Hispanic 319,401 5.4% Asian alone 184,631 3.1% Black alone 175,926 3.0% Two or more races 85,396 1.4% American Indian alone 22,779 0.4% Native Hawaiian and Other 11,989 0.2% Other race alone
4,941,456 63.5% White alone 1,093,313 14.0% Hispanic 755,832 9.7% Asian alone 523,448 6.7% Two or more races 299,537 3.8% Black alone 69,024 0.9% American Indian alone 52,231 0.7% Native Hawaiian and Other 50,945 0.7% Other race alone
Income and house value in Benton City Median household income in 2022 $53,909 White non-Hispanic householders$81,757 American Indian and Alaska Native householders$50,926 Some other race householders$50,767 Hispanic or Latino race householdersMedian 2022 house value $298,854 White Non-Hispanic householders$282,998 Some other race householders$258,524 Two or more races householders$287,824 Hispanic or Latino householders
Median age by race in Benton City
32.7 Median age for White residents32.4 35.8 -492,655,366.7 Median age for Black or African American residents-585,034,013.0 -904,166,665.8 35.6 Median age for American Indian / Alaska Native residents20.0 56.0 -662,983,424.8 Median age for Asian residents-678,260,868.9 -671,834,624.7 -649,253,730.7 Median age for Native Hawaiian / Pacific Islander residents-696,774,192.9 -658,682,634.1 17.8 Median age for Other race residents21.1 15.1 8.5 Median age for Two or more races residents7.9 21.7 41.6 Median age for White alone residents35.6 43.1 19.8 Median age for Hispanic or Latino residents20.0 20.9
Owner/renter occupied households by race in Benton City
House owners and renters - White residents 772 81.7% Owner occupied173 18.3% Renter occupiedHouse owners and renters - American Indian / Alaska Native residents 20 100.0% Owner occupiedHouse owners and renters - Other race residents 178 100.0% Owner occupiedHouse owners and renters - Two or more races residents 135 49.8% Owner occupied135 50.2% Renter occupiedHouse owners and renters - White alone residents 687 83.9% Owner occupied132 16.1% Renter occupiedHouse owners and renters - Hispanic or Latino residents 415 77.5% Owner occupied121 22.5% Renter occupied
Language usage in Benton City
English speakers - Total 70.6% of residents of Benton City speak English at home.
27.0% of residents speak Spanish at home 338 41.9% Speak English very well469 58.1% Speak English less than very well1.6% of residents speak other language at home 28 57.1% Speak English very well21 42.9% Speak English less than very well
English speakers - Born in the United States 89.5% of residents of Benton City speak English at home.
11.8% of residents speak Spanish at home 47 53.4% Speak English very well41 46.6% Speak English less than very well0.4% of residents speak other language at home 3 100.0% Speak English less than very well
All residents speak only English at home
English speakers - Foreign-born 3.5% of residents of Benton City speak English at home.
92.2% of residents speak Spanish at home 163 27.2% Speak English very well436 72.8% Speak English less than very well6.9% of residents speak other language at home 32 71.1% Speak English very well13 28.9% Speak English less than very well
White (Caucasian) - Speak another language Native:
3.3% (60)Foreign-born:
98.9% (158)
Other race - Speak another language Native:
76.6% (113)Foreign-born:
91.7% (296)
Two or more races - Speak another language Native:
18.9% (58)Foreign-born:
100.0% (97)
White alone - Speak another language Native:
0.5% (9)Foreign-born:
100.0% (34)
Hispanic or Latino - Speak only English Native:
48.0% (240)Foreign-born:
2.0% (12)
Hispanic or Latino - Speak another language Native:
49.5% (247)Foreign-born:
97.7% (591)
Foreign-born residents in Benton City 659 residents are foreign born (16.8% Latin America ).
This city:
18.4%Washington:
14.9%
Marital status for residents in Benton City Marital status - White (Caucasian) population 15 years and over
Males 30.9% Never married49.7% Now married3.2% Separated4.0% Widowed12.2% DivorcedFemales 21.0% Never married53.5% Now married4.4% Separated11.6% Widowed9.4% DivorcedWomen who gave birth in the past 12 months Now married:
100.0% (52)Unmarried:
0.0% (0)
Women who did not give birth in the past 12 months Now married:
47.9% (177)Unmarried:
52.1% (192)
Marital status - American Indian / Alaska Native population 15 years and over
Males 64.3% Never married35.7% Now married0.0% Separated0.0% Widowed0.0% DivorcedFemales 75.8% Never married6.1% Now married0.0% Separated18.2% Widowed0.0% DivorcedWomen who did not give birth in the past 12 months Now married:
11.8% (2)Unmarried:
88.2% (18)
Marital status - Other race population 15 years and over
Males 58.4% Never married41.6% Now married0.0% Separated0.0% Widowed0.0% DivorcedFemales 58.3% Never married27.0% Now married14.7% Separated0.0% Widowed0.0% DivorcedWomen who gave birth in the past 12 months Now married:
46.5% (23)Unmarried:
53.5% (26)
Women who did not give birth in the past 12 months Now married:
40.0% (54)Unmarried:
60.0% (81)
Marital status - Two or more races population 15 years and over
Males 100.0% Never married0.0% Now married0.0% Separated0.0% Widowed0.0% DivorcedFemales 31.7% Never married28.5% Now married19.4% Separated0.0% Widowed20.4% DivorcedWomen who gave birth in the past 12 months Now married:
80.3% (77)Unmarried:
19.7% (19)
Women who did not give birth in the past 12 months Now married:
9.5% (6)Unmarried:
90.5% (60)
Marital status - White alone, not Hispanic / Latino population 15 years and over
Males 30.0% Never married47.2% Now married3.8% Separated4.7% Widowed14.3% DivorcedFemales 12.3% Never married56.8% Now married5.4% Separated14.1% Widowed11.5% DivorcedWomen who gave birth in the past 12 months Now married:
100.0% (42)Unmarried:
0.0% (0)
Women who did not give birth in the past 12 months Now married:
62.8% (174)Unmarried:
37.2% (103)
Marital status - Hispanic or Latino population 15 years and over
Males 49.4% Never married50.6% Now married0.0% Separated0.0% Widowed0.0% DivorcedFemales 50.3% Never married30.8% Now married12.1% Separated1.2% Widowed5.6% DivorcedWomen who gave birth in the past 12 months Now married:
69.6% (87)Unmarried:
30.4% (38)
Women who did not give birth in the past 12 months Now married:
21.9% (60)Unmarried:
78.1% (212)
Ancestries in Benton City
172 9.8% American120 6.8% German99 5.7% English50 2.9% Irish37 2.1% Yugoslavian29 1.7% Norwegian8 0.5% French Canadian7 0.4% Swiss6 0.3% Dutch
Children Nativity (place of birth) in Benton City
Children under 6 years - Living with two parents Both parents native 263 100.0% NativeBoth parents foreign-born 120 100.0% NativeOne native, one foreign-born parent 19 100.0% NativeChildren under 6 years - Living with one parent Native parent 86 100.0% NativeForeign-born parent 149 100.0% NativeChildren 6 to 17 years - Living with two parents Both parents native 180 100.0% NativeBoth parents foreign-born 38 60.4% Native25 39.6% Foreign-bornChildren 6 to 17 years - Living with one parent Native parent 16 100.0% NativeForeign-born parent 104 63.4% Native60 36.6% Foreign-born
Grandparents responsible for own grandchildren in Benton City
Grandparents (30 to 59 years) White / Caucasian 29 100.0% Not responsible for grandchildrenOther race 22 100.0% Responsible for grandchildrenWhite alone, not Hispanic / Latino 33 100.0% Not responsible for grandchildrenHispanic or Latino 31 100.0% Responsible for grandchildrenGrandparents (60 years and over) White / Caucasian 6 54.3% Responsible for grandchildren5 45.7% Not responsible for grandchildrenWhite alone, not Hispanic / Latino 6 53.4% Responsible for grandchildren5 46.6% Not responsible for grandchildren