Races in Burton, Michigan (MI) Detailed Stats
Data:
Races - White alone (%)
Races - White alone (% change since 2000)
Races - Black alone (%)
Races - Black alone (% change since 2000)
Races - American Indian alone (%)
Races - American Indian alone (% change since 2000)
Races - Asian alone (%)
Races - Asian alone (% change since 2000)
Races - Hispanic (%)
Races - Hispanic (% change since 2000)
Races - Native Hawaiian and Other Pacific Islander alone (%)
Races - Native Hawaiian and Other Pacific Islander alone (% change since 2000)
Races - Two or more races(%)
Races - Two or more races(% change since 2000)
Races - Other race alone (%)
Races - Other race alone (% change since 2000)
Racial diversity
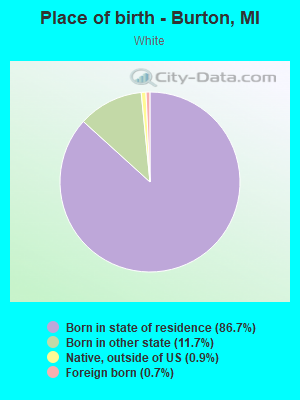
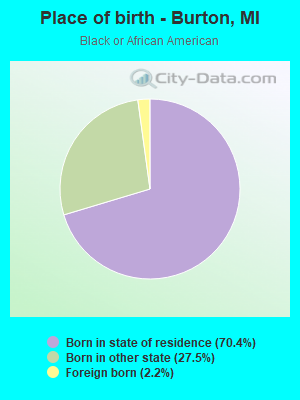
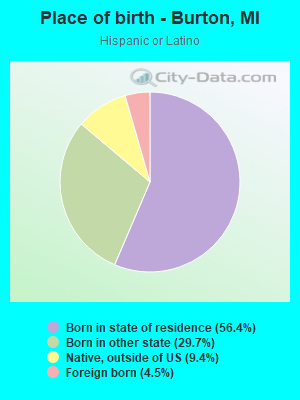
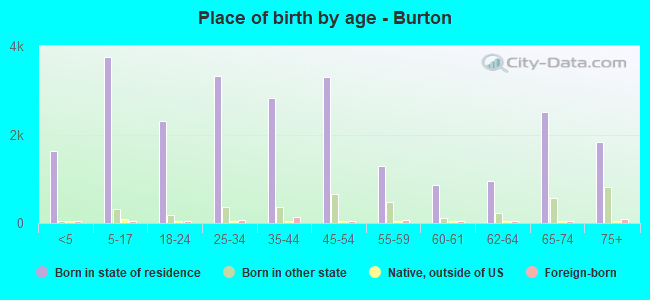
Place of birth - Born in state of residence (%)
Place of birth - Born in state of residence (%) - White
Place of birth - Born in state of residence (%) - Black or African American
Place of birth - Born in state of residence (%) - Asian
Place of birth - Born in state of residence (%) - Hispanic or Latino
Place of birth - Born in state of residence (%) - American Indian and Alaska Native
Place of birth - Born in state of residence (%) - Multirace
Place of birth - Born in state of residence (%) - Other Race
Place of birth - Born in other state (%)
Place of birth - Born in other state (%) - White
Place of birth - Born in other state (%) - Black or African American
Place of birth - Born in other state (%) - Asian
Place of birth - Born in other state (%) - Hispanic or Latino
Place of birth - Born in other state (%) - American Indian and Alaska Native
Place of birth - Born in other state (%) - Multirace
Place of birth - Born in other state (%) - Other Race
Place of birth - Native, outside of US (%)
Place of birth - Native, outside of US (%) - White
Place of birth - Native, outside of US (%) - Black or African American
Place of birth - Native, outside of US (%) - Asian
Place of birth - Native, outside of US (%) - Hispanic or Latino
Place of birth - Native, outside of US (%) - American Indian and Alaska Native
Place of birth - Native, outside of US (%) - Multirace
Place of birth - Native, outside of US (%) - Other Race
Place of birth - Foreign born (%)
Place of birth - Foreign born (%) - White
Place of birth - Foreign born (%) - Black or African American
Place of birth - Foreign born (%) - Asian
Place of birth - Foreign born (%) - Hispanic or Latino
Place of birth - Foreign born (%) - American Indian and Alaska Native
Place of birth - Foreign born (%) - Multirace
Place of birth - Foreign born (%) - Other Race
Residents speaking English at home (%)
Residents speaking English at home - Born in the United States (%)
Residents speaking English at home - Native, born elsewhere (%)
Residents speaking English at home - Foreign born (%)
Residents speaking Spanish at home (%)
Residents speaking Spanish at home - Born in the United States (%)
Residents speaking Spanish at home - Native, born elsewhere (%)
Residents speaking Spanish at home - Foreign born (%)
Residents speaking other language at home (%)
Residents speaking other language at home - Born in the United States (%)
Residents speaking other language at home - Native, born elsewhere (%)
Residents speaking other language at home - Foreign born (%)
Marital status - Never married (%)
Marital status - Now married (%)
Marital status - Separated (%)
Marital status - Widowed (%)
Marital status - Divorced (%)
Ancestries Reported - Arab (%)
Ancestries Reported - Czech (%)
Ancestries Reported - Danish (%)
Ancestries Reported - Dutch (%)
Ancestries Reported - English (%)
Ancestries Reported - French (%)
Ancestries Reported - French Canadian (%)
Ancestries Reported - German (%)
Ancestries Reported - Greek (%)
Ancestries Reported - Hungarian (%)
Ancestries Reported - Irish (%)
Ancestries Reported - Italian (%)
Ancestries Reported - Lithuanian (%)
Ancestries Reported - Norwegian (%)
Ancestries Reported - Polish (%)
Ancestries Reported - Portuguese (%)
Ancestries Reported - Russian (%)
Ancestries Reported - Scotch-Irish (%)
Ancestries Reported - Scottish (%)
Ancestries Reported - Slovak (%)
Ancestries Reported - Subsaharan African (%)
Ancestries Reported - Swedish (%)
Ancestries Reported - Swiss (%)
Ancestries Reported - Ukrainian (%)
Ancestries Reported - United States (%)
Ancestries Reported - Welsh (%)
Ancestries Reported - West Indian (%)
Ancestries Reported - Other (%)
Geographical mobility - Same house 1 year ago (%)
Geographical mobility - Same house 1 year ago (%) - White
Geographical mobility - Same house 1 year ago (%) - Black or African American
Geographical mobility - Same house 1 year ago (%) - Asian
Geographical mobility - Same house 1 year ago (%) - Hispanic or Latino
Geographical mobility - Same house 1 year ago (%) - American Indian and Alaska Native
Geographical mobility - Same house 1 year ago (%) - Multirace
Geographical mobility - Same house 1 year ago (%) - Other Race
Geographical mobility - Moved within same county (%)
Geographical mobility - Moved within same county (%) - White
Geographical mobility - Moved within same county (%) - Black or African American
Geographical mobility - Moved within same county (%) - Asian
Geographical mobility - Moved within same county (%) - Hispanic or Latino
Geographical mobility - Moved within same county (%) - American Indian and Alaska Native
Geographical mobility - Moved within same county (%) - Multirace
Geographical mobility - Moved within same county (%) - Other Race
Geographical mobility - Moved from different county within same state (%)
Geographical mobility - Moved from different county within same state (%) - White
Geographical mobility - Moved from different county within same state (%) - Black or African American
Geographical mobility - Moved from different county within same state (%) - Asian
Geographical mobility - Moved from different county within same state (%) - Hispanic or Latino
Geographical mobility - Moved from different county within same state (%) - American Indian and Alaska Native
Geographical mobility - Moved from different county within same state (%) - Multirace
Geographical mobility - Moved from different county within same state (%) - Other Race
Geographical mobility - Moved from different state (%)
Geographical mobility - Moved from different state (%) - White
Geographical mobility - Moved from different state (%) - Black or African American
Geographical mobility - Moved from different state (%) - Asian
Geographical mobility - Moved from different state (%) - Hispanic or Latino
Geographical mobility - Moved from different state (%) - American Indian and Alaska Native
Geographical mobility - Moved from different state (%) - Multirace
Geographical mobility - Moved from different state (%) - Other Race
Geographical mobility - Moved from abroad (%)
Geographical mobility - Moved from abroad (%) - White
Geographical mobility - Moved from abroad (%) - Black or African American
Geographical mobility - Moved from abroad (%) - Asian
Geographical mobility - Moved from abroad (%) - Hispanic or Latino
Geographical mobility - Moved from abroad (%) - American Indian and Alaska Native
Geographical mobility - Moved from abroad (%) - Multirace
Geographical mobility - Moved from abroad (%) - Other Race
Place of birth for the foreign-born population - Ireland (%)
Place of birth for the foreign-born population - Denmark (%)
Place of birth for the foreign-born population - Norway (%)
Place of birth for the foreign-born population - Sweden (%)
Place of birth for the foreign-born population - United Kingdom (%)
Place of birth for the foreign-born population - England (%)
Place of birth for the foreign-born population - Scotland (%)
Place of birth for the foreign-born population - Other Northern Europe (%)
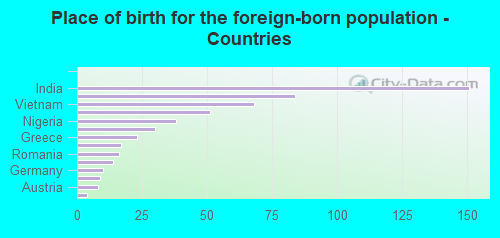
Place of birth for the foreign-born population - Austria (%)
Place of birth for the foreign-born population - Belgium (%)
Place of birth for the foreign-born population - France (%)
Place of birth for the foreign-born population - Germany (%)
Place of birth for the foreign-born population - Netherlands (%)
Place of birth for the foreign-born population - Switzerland (%)
Place of birth for the foreign-born population - Other Western Europe (%)
Place of birth for the foreign-born population - Greece (%)
Place of birth for the foreign-born population - Italy (%)
Place of birth for the foreign-born population - Portugal (%)
Place of birth for the foreign-born population - Spain (%)
Place of birth for the foreign-born population - Other Southern Europe (%)
Place of birth for the foreign-born population - Albania (%)
Place of birth for the foreign-born population - Belarus (%)
Place of birth for the foreign-born population - Bosnia and Herzegovina (%)
Place of birth for the foreign-born population - Bulgaria (%)
Place of birth for the foreign-born population - Croatia (%)
Place of birth for the foreign-born population - Czechoslovakia (%)
Place of birth for the foreign-born population - Hungary (%)
Place of birth for the foreign-born population - Latvia (%)
Place of birth for the foreign-born population - Lithuania (%)
Place of birth for the foreign-born population - North Macedonia (Macedonia) (%)
Place of birth for the foreign-born population - Moldova (%)
Place of birth for the foreign-born population - Poland (%)
Place of birth for the foreign-born population - Romania (%)
Place of birth for the foreign-born population - Russia (%)
Place of birth for the foreign-born population - Serbia (%)
Place of birth for the foreign-born population - Ukraine (%)
Place of birth for the foreign-born population - Other Eastern Europe (%)
Place of birth for the foreign-born population - China (%)
Place of birth for the foreign-born population - Hong Kong (%)
Place of birth for the foreign-born population - Taiwan (%)
Place of birth for the foreign-born population - Japan (%)
Place of birth for the foreign-born population - Korea (%)
Place of birth for the foreign-born population - Other Eastern Asia (%)
Place of birth for the foreign-born population - Afghanistan (%)
Place of birth for the foreign-born population - Bangladesh (%)
Place of birth for the foreign-born population - India (%)
Place of birth for the foreign-born population - Iran (%)
Place of birth for the foreign-born population - Kazakhstan (%)
Place of birth for the foreign-born population - Nepal (%)
Place of birth for the foreign-born population - Pakistan (%)
Place of birth for the foreign-born population - Sri Lanka (%)
Place of birth for the foreign-born population - Uzbekistan (%)
Place of birth for the foreign-born population - Other South Central Asia (%)
Place of birth for the foreign-born population - Burma (%)
Place of birth for the foreign-born population - Cambodia (%)
Place of birth for the foreign-born population - Indonesia (%)
Place of birth for the foreign-born population - Laos (%)
Place of birth for the foreign-born population - Malaysia (%)
Place of birth for the foreign-born population - Philippines (%)
Place of birth for the foreign-born population - Singapore (%)
Place of birth for the foreign-born population - Thailand (%)
Place of birth for the foreign-born population - Vietnam (%)
Place of birth for the foreign-born population - Other South Eastern Asia (%)
Place of birth for the foreign-born population - Armenia (%)
Place of birth for the foreign-born population - Iraq (%)
Place of birth for the foreign-born population - Israel (%)
Place of birth for the foreign-born population - Jordan (%)
Place of birth for the foreign-born population - Kuwait (%)
Place of birth for the foreign-born population - Lebanon (%)
Place of birth for the foreign-born population - Saudi Arabia (%)
Place of birth for the foreign-born population - Syria (%)
Place of birth for the foreign-born population - Turkey (%)
Place of birth for the foreign-born population - Yemen (%)
Place of birth for the foreign-born population - Other Western Asia (%)
Place of birth for the foreign-born population - Eritrea (%)
Place of birth for the foreign-born population - Ethiopia (%)
Place of birth for the foreign-born population - Kenya (%)
Place of birth for the foreign-born population - Somalia (%)
Place of birth for the foreign-born population - Uganda (%)
Place of birth for the foreign-born population - Zimbabwe (%)
Place of birth for the foreign-born population - Other Eastern Africa (%)
Place of birth for the foreign-born population - Cameroon (%)
Place of birth for the foreign-born population - Congo (%)
Place of birth for the foreign-born population - Democratic Republic of Congo (Zaire) (%)
Place of birth for the foreign-born population - Other Middle Africa (%)
Place of birth for the foreign-born population - Egypt (%)
Place of birth for the foreign-born population - Morocco (%)
Place of birth for the foreign-born population - Sudan (%)
Place of birth for the foreign-born population - Other Northern Africa (%)
Place of birth for the foreign-born population - South Africa (%)
Place of birth for the foreign-born population - Other Southern Africa (%)
Place of birth for the foreign-born population - Cabo Verde (%)
Place of birth for the foreign-born population - Ghana (%)
Place of birth for the foreign-born population - Liberia (%)
Place of birth for the foreign-born population - Nigeria (%)
Place of birth for the foreign-born population - Senegal (%)
Place of birth for the foreign-born population - Sierra Leone (%)
Place of birth for the foreign-born population - Other Western Africa (%)
Place of birth for the foreign-born population - Australia (%)
Place of birth for the foreign-born population - New Zealand (%)
Place of birth for the foreign-born population - Fiji (%)
Place of birth for the foreign-born population - Micronesia (%)
Place of birth for the foreign-born population - Bahamas (%)
Place of birth for the foreign-born population - Barbados (%)
Place of birth for the foreign-born population - Cuba (%)
Place of birth for the foreign-born population - Dominica (%)
Place of birth for the foreign-born population - Dominican Republic (%)
Place of birth for the foreign-born population - Grenada (%)
Place of birth for the foreign-born population - Haiti (%)
Place of birth for the foreign-born population - Jamaica (%)
Place of birth for the foreign-born population - St. Vincent and the Grenadines (%)
Place of birth for the foreign-born population - Trinidad and Tobago (%)
Place of birth for the foreign-born population - West Indies (%)
Place of birth for the foreign-born population - Other Caribbean (%)
Place of birth for the foreign-born population - Belize (%)
Place of birth for the foreign-born population - Costa Rica (%)
Place of birth for the foreign-born population - El Salvador (%)
Place of birth for the foreign-born population - Guatemala (%)
Place of birth for the foreign-born population - Honduras (%)
Place of birth for the foreign-born population - Mexico (%)
Place of birth for the foreign-born population - Nicaragua (%)
Place of birth for the foreign-born population - Panama (%)
Place of birth for the foreign-born population - Other Central America (%)
Place of birth for the foreign-born population - Argentina (%)
Place of birth for the foreign-born population - Bolivia (%)
Place of birth for the foreign-born population - Brazil (%)
Place of birth for the foreign-born population - Chile (%)
Place of birth for the foreign-born population - Colombia (%)
Place of birth for the foreign-born population - Ecuador (%)
Place of birth for the foreign-born population - Guyana (%)
Place of birth for the foreign-born population - Peru (%)
Place of birth for the foreign-born population - Uruguay (%)
Place of birth for the foreign-born population - Venezuela (%)
Place of birth for the foreign-born population - Other South America (%)
Place of birth for the foreign-born population - Canada (%)
Place of birth for the foreign-born population - Other Northern America (%)
Place of birth for the foreign-born population - Other (%)
Latest news about races in Burton, MI collected exclusively by city-data.com from local newspapers, TV, and radio stations
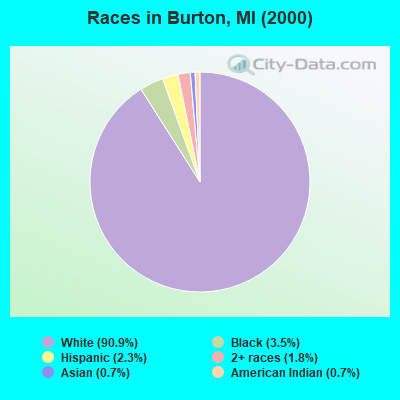
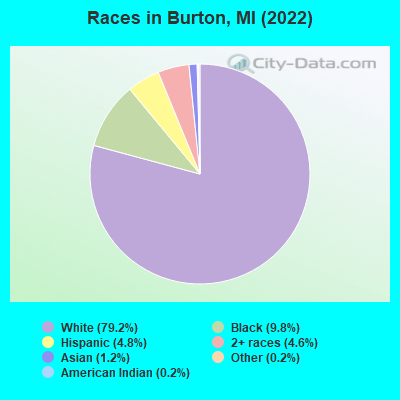
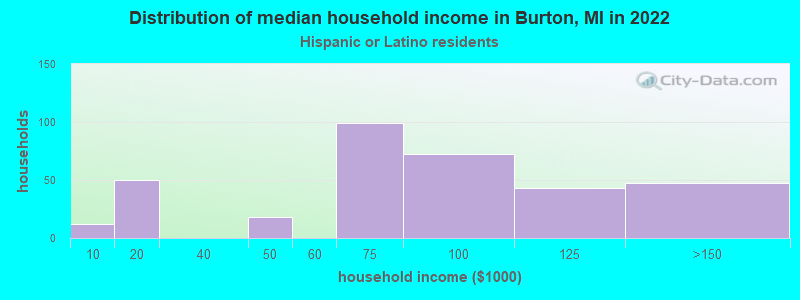
According to 2022 data, the most numerous races in Burton, MI are White alone (23,220 residents), Black alone (2,861 residents), and Hispanic (1,404 residents). 97.2% of Burton residents speak English at home. 1.8% of Burton, MI residents are foreign-born , which is 228.9% less than the foreign-born rate of 6.0% across the entire state of Michigan.
Race distribution in Burton
2000 2022
7,806,691 78.6% White alone 1,402,047 14.1% Black alone 323,877 3.3% Hispanic 175,311 1.8% Asian alone 163,487 1.6% Two or more races 53,421 0.5% American Indian alone 11,465 0.1% Other race alone 2,145 0.02% Native Hawaiian and Other
7,289,051 72.6% White alone 1,310,464 13.1% Black alone 572,405 5.7% Hispanic 450,031 4.5% Two or more races 335,732 3.3% Asian alone 45,217 0.5% Other race alone 29,011 0.3% American Indian alone 2,207 0.02% Native Hawaiian and Other
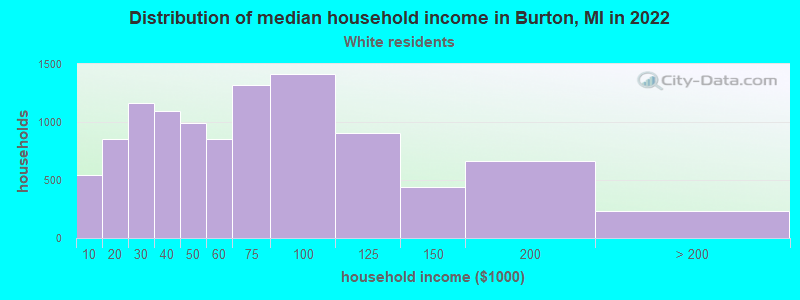
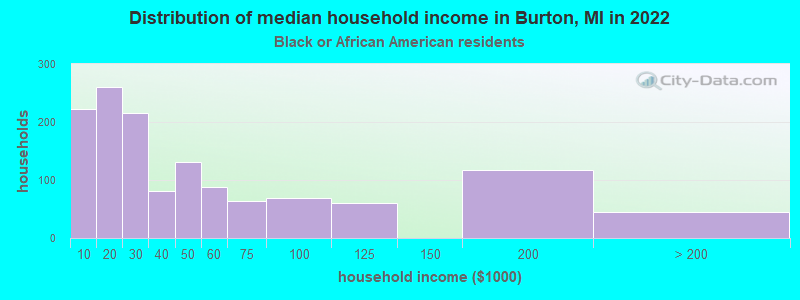
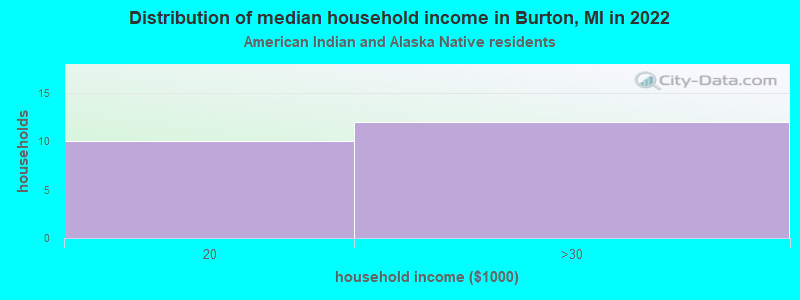
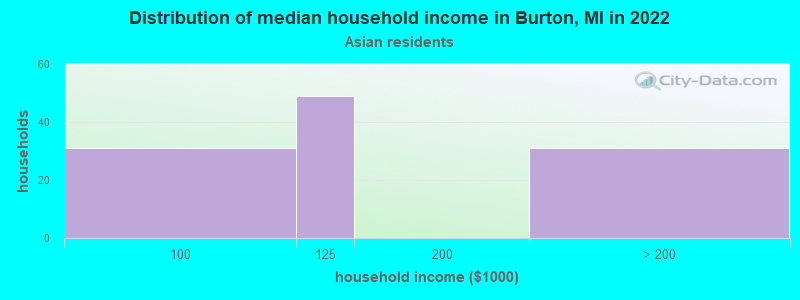
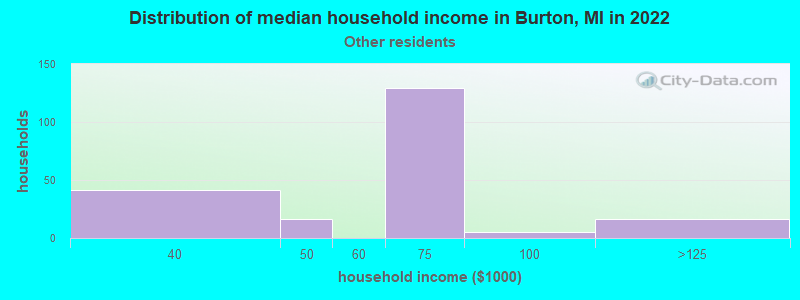
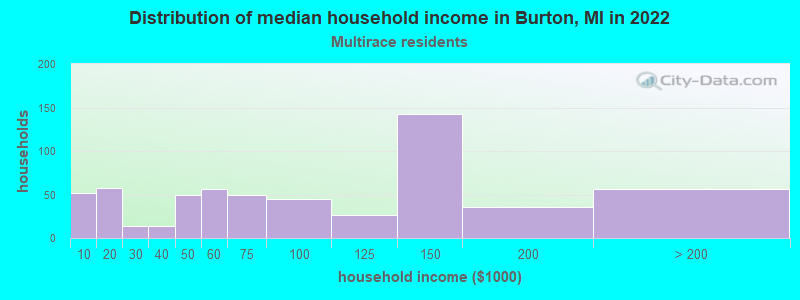
Income and house value in Burton Median household income in 2022 $55,789 White non-Hispanic householders$28,901 Black householders$111,373 Asian householders$65,391 Some other race householders$83,815 Two or more races householders$60,531 Hispanic or Latino race householdersMedian 2022 house value $139,615 White Non-Hispanic householders$187,143 Black or African American householders$108,919 American Indian or Alaska Native householders $259,757 Asian householders$129,713 Some other race householders$115,025 Two or more races householders$132,519 Hispanic or Latino householders
Median age by race in Burton
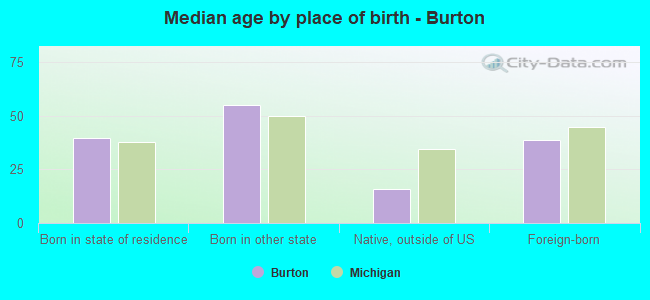
44.8 Median age for White residents44.1 46.5 38.1 Median age for Black or African American residents37.0 38.6 28.7 Median age for American Indian / Alaska Native residents25.8 28.3 32.7 Median age for Asian residents41.4 30.7 -670,531,400.3 Median age for Native Hawaiian / Pacific Islander residents-674,772,035.8 -699,588,476.7 47.8 Median age for Other race residents45.0 32.1 32.5 Median age for Two or more races residents36.5 26.6 45.1 Median age for White alone residents44.5 47.4 28.3 Median age for Hispanic or Latino residents35.5 17.7
Owner/renter occupied households by race in Burton
House owners and renters - White residents 8,393 79.8% Owner occupied2,120 20.2% Renter occupiedHouse owners and renters - Black or African American residents 375 28.5% Owner occupied941 71.5% Renter occupiedHouse owners and renters - American Indian / Alaska Native residents 9 37.5% Owner occupied15 62.5% Renter occupiedHouse owners and renters - Asian residents 67 51.4% Owner occupied64 48.6% Renter occupiedHouse owners and renters - Other race residents 96 61.9% Owner occupied59 38.1% Renter occupiedHouse owners and renters - Two or more races residents 493 83.1% Owner occupied100 16.9% Renter occupiedHouse owners and renters - White alone residents 8,274 80.3% Owner occupied2,024 19.7% Renter occupiedHouse owners and renters - Hispanic or Latino residents 283 68.4% Owner occupied131 31.6% Renter occupied
Language usage in Burton
English speakers - Total 97.2% of residents of Burton speak English at home.
1.3% of residents speak Spanish at home 234 63.6% Speak English very well134 36.4% Speak English less than very well1.5% of residents speak other language at home 274 66.2% Speak English very well140 33.8% Speak English less than very well
English speakers - Born in the United States 96.8% of residents of Burton speak English at home.
3.5% of residents speak Spanish at home 59 41.5% Speak English very well83 58.5% Speak English less than very well0.3% of residents speak other language at home 11 100.0% Speak English very well
English speakers - Native, born elsewhere 75.9% of residents of Burton speak English at home.
17.1% of residents speak Spanish at home 27 100.0% Speak English very well
English speakers - Foreign-born 18.2% of residents of Burton speak English at home.
12.9% of residents speak Spanish at home 21 35.0% Speak English very well39 65.0% Speak English less than very well66.5% of residents speak other language at home 165 53.2% Speak English very well145 46.8% Speak English less than very well
White (Caucasian) - Speak only English Native:
98.7% (22,278)Foreign-born:
28.1% (47)
White (Caucasian) - Speak another language Native:
1.3% (296)Foreign-born:
68.4% (115)
Black or African American - Speak only English Native:
100.0% (2,585)Foreign-born:
24.7% (15)
Other race - Speak another language Native:
14.8% (46)Foreign-born:
100.0% (12)
Two or more races - Speak another language Native:
7.9% (121)Foreign-born:
89.4% (20)
White alone - Speak only English Native:
99.2% (21,652)Foreign-born:
32.7% (46)
White alone - Speak another language Native:
0.8% (172)Foreign-born:
64.3% (90)
Hispanic or Latino - Speak another language Native:
22.2% (272)Foreign-born:
93.8% (59)
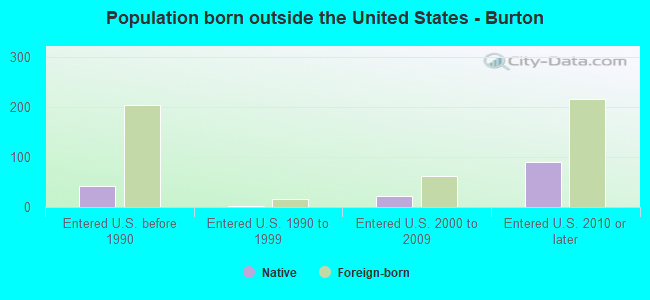
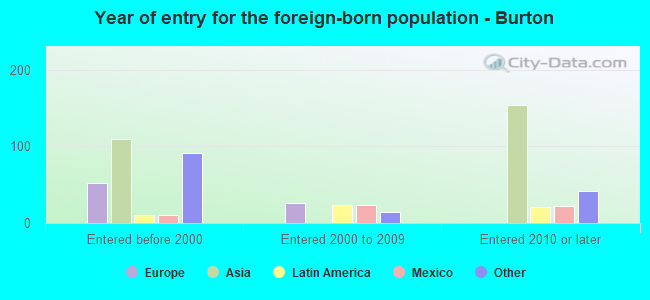
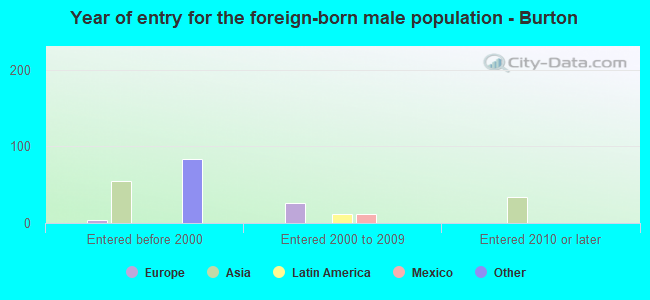
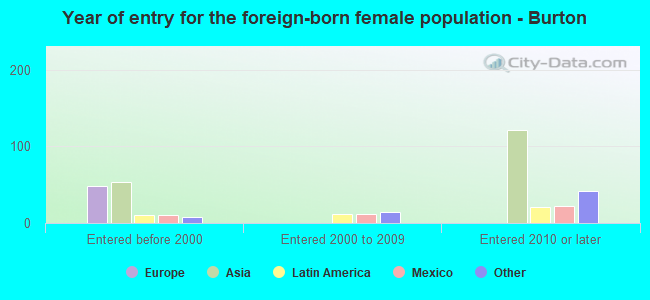
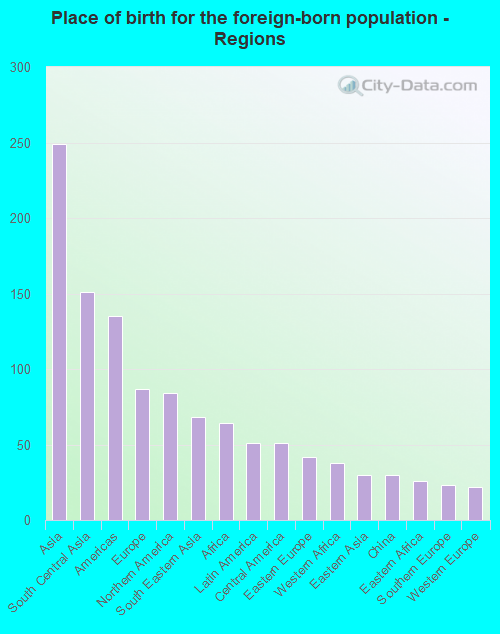
Foreign-born residents in Burton 535 residents are foreign born
This city:
1.8%Michigan:
6.9%
Marital status for residents in Burton Marital status - White (Caucasian) population 15 years and over
Males 37.2% Never married43.0% Now married0.8% Separated3.7% Widowed15.3% DivorcedFemales 27.1% Never married39.9% Now married1.4% Separated13.0% Widowed18.6% DivorcedWomen who gave birth in the past 12 months Now married:
47.5% (175)Unmarried:
52.5% (194)
Women who did not give birth in the past 12 months Now married:
36.1% (1,773)Unmarried:
63.9% (3,134)
Marital status - Black or African American population 15 years and over
Males 46.3% Never married39.6% Now married1.5% Separated0.0% Widowed12.6% DivorcedFemales 51.6% Never married20.5% Now married0.4% Separated4.6% Widowed23.0% DivorcedWomen who gave birth in the past 12 months Now married:
0.0% (0)Unmarried:
100.0% (18)
Women who did not give birth in the past 12 months Now married:
26.3% (185)Unmarried:
73.7% (517)
Marital status - American Indian / Alaska Native population 15 years and over
Males 68.0% Never married32.0% Now married0.0% Separated0.0% Widowed0.0% DivorcedFemales 29.8% Never married43.9% Now married0.0% Separated0.0% Widowed26.3% DivorcedWomen who gave birth in the past 12 months Now married:
100.0% (23)Unmarried:
0.0% (0)
Women who did not give birth in the past 12 months Now married:
0.0% (0)Unmarried:
100.0% (33)
Marital status - Asian population 15 years and over
Males 15.5% Never married84.5% Now married0.0% Separated0.0% Widowed0.0% DivorcedFemales 31.4% Never married68.6% Now married0.0% Separated0.0% Widowed0.0% DivorcedWomen who did not give birth in the past 12 months Now married:
69.0% (60)Unmarried:
31.0% (27)
Marital status - Other race population 15 years and over
Males 29.4% Never married70.6% Now married0.0% Separated0.0% Widowed0.0% DivorcedFemales 9.1% Never married83.6% Now married0.0% Separated0.0% Widowed7.3% DivorcedWomen who did not give birth in the past 12 months Now married:
55.0% (13)Unmarried:
45.0% (11)
Marital status - Two or more races population 15 years and over
Males 47.1% Never married36.5% Now married1.4% Separated0.0% Widowed15.0% DivorcedFemales 45.9% Never married34.3% Now married0.0% Separated6.2% Widowed13.6% DivorcedWomen who gave birth in the past 12 months Now married:
0.0% (0)Unmarried:
100.0% (23)
Women who did not give birth in the past 12 months Now married:
28.0% (100)Unmarried:
72.0% (258)
Marital status - White alone, not Hispanic / Latino population 15 years and over
Males 36.1% Never married43.3% Now married0.8% Separated3.9% Widowed15.9% DivorcedFemales 26.4% Never married40.0% Now married1.2% Separated13.3% Widowed19.1% DivorcedWomen who gave birth in the past 12 months Now married:
52.2% (177)Unmarried:
47.8% (162)
Women who did not give birth in the past 12 months Now married:
36.5% (1,755)Unmarried:
63.5% (3,049)
Marital status - Hispanic or Latino population 15 years and over
Males 51.0% Never married47.7% Now married0.0% Separated0.0% Widowed1.3% DivorcedFemales 46.7% Never married42.3% Now married6.4% Separated0.0% Widowed4.6% DivorcedWomen who gave birth in the past 12 months Now married:
0.0% (0)Unmarried:
100.0% (33)
Women who did not give birth in the past 12 months Now married:
23.9% (47)Unmarried:
76.1% (150)
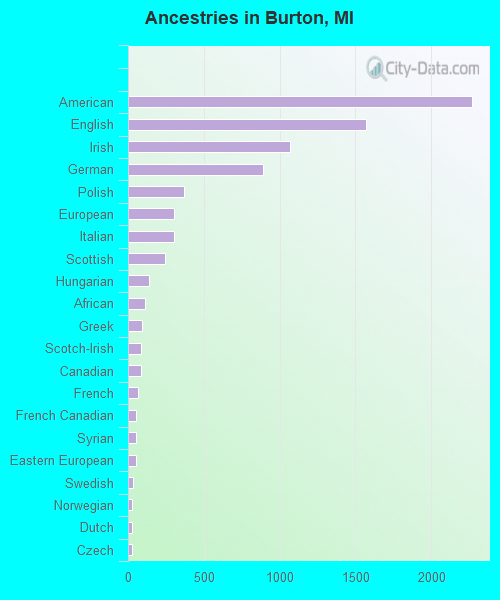
Ancestries in Burton
2,267 17.9% American1,567 12.4% English1,070 8.5% Irish890 7.0% German372 2.9% Polish304 2.4% European304 2.4% Italian247 2.0% Scottish136 1.1% Hungarian112 0.9% African92 0.7% Greek89 0.7% Scotch-Irish86 0.7% Canadian64 0.5% French56 0.4% French Canadian53 0.4% Syrian53 0.4% Eastern European33 0.3% Swedish29 0.2% Norwegian28 0.2% Dutch27 0.2% Czech20 0.2% Russian19 0.2% British18 0.1% Macedonian16 0.1% Assyrian16 0.1% Austrian16 0.1% Scandinavian15 0.1% Welsh11 0.09% Romanian9 0.07% Slovak8 0.06% Belgian8 0.06% Czechoslovakian7 0.06% Finnish6 0.05% Croatian6 0.05% Yugoslavian3 0.02% Northern European
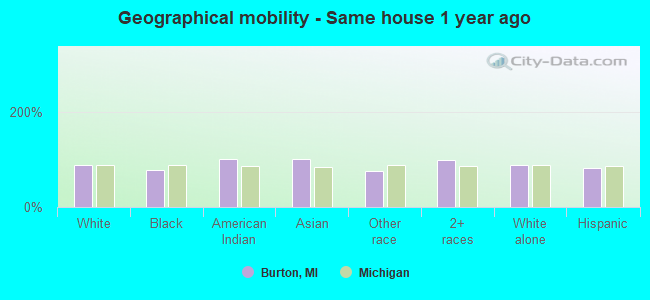
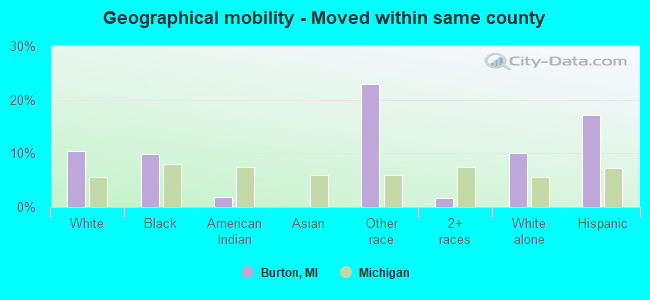
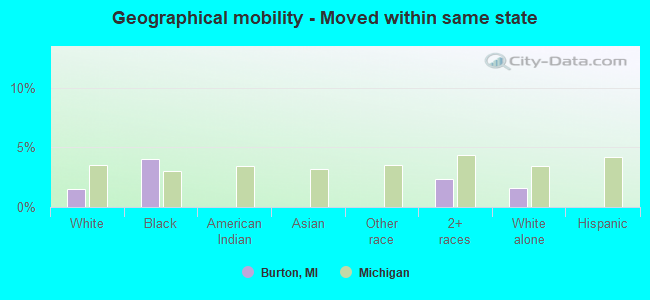
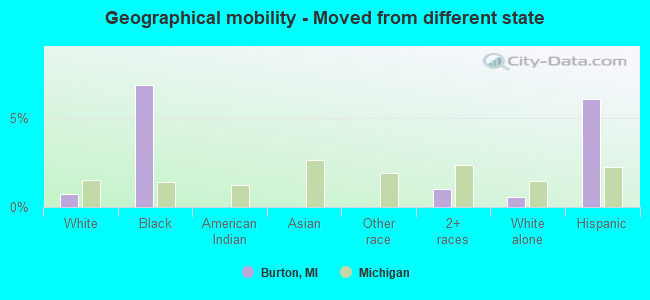
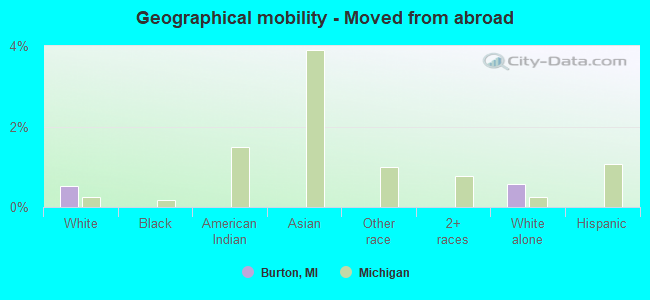
Geographical mobility in Burton Same house 1 year ago 20,677 86.8% White (Caucasian)2,216 78.5% Black or African American91 100.0% American Indian / Alaska Native335 100.0% Asian244 75.6% Other race1,596 98.3% Two or more races20,106 87.3% White alone, not Hispanic / Latino1,105 80.6% Hispanic or LatinoMoved within same county 2,472 10.4% White / Caucasian280 9.9% Black or African American2 1.8% American Indian / Alaska Native74 23.0% Other race26 1.6% Two or more races2,310 10.0% White alone, not Hispanic / Latino235 17.2% Hispanic or LatinoMoved within same state 357 1.5% White / Caucasian113 4.0% Black or African American39 2.4% Two or more races360 1.6% White alone, not Hispanic / Latino0 0.0% Hispanic or LatinoMoved from different state 170 0.7% White / Caucasian193 6.8% Black or African American16 1.0% Two or more races131 0.6% White alone, not Hispanic / Latino83 6.0% Hispanic or LatinoMoved from abroad 121 0.5% White132 0.6% White alone, not Hispanic / Latino
Children Nativity (place of birth) in Burton
Children under 6 years - Living with two parents Both parents native 734 100.0% Native0 0.0% Foreign-bornBoth parents foreign-born 38 100.0% Foreign-bornOne native, one foreign-born parent 33 100.0% NativeChildren under 6 years - Living with one parent Native parent 992 100.0% NativeForeign-born parent 10 100.0% NativeChildren 6 to 17 years - Living with two parents Both parents native 1,902 100.0% NativeBoth parents foreign-born 46 100.0% NativeOne native, one foreign-born parent 62 100.0% NativeChildren 6 to 17 years - Living with one parent Native parent 1,535 100.0% NativeForeign-born parent 17 49.3% Native18 50.7% Foreign-born
Grandparents responsible for own grandchildren in Burton
Grandparents (30 to 59 years) White / Caucasian 269 71.6% Responsible for grandchildren107 28.4% Not responsible for grandchildrenBlack or African American 3 100.0% Responsible for grandchildrenTwo or more races 15 100.0% Not responsible for grandchildrenWhite alone, not Hispanic / Latino 272 71.9% Responsible for grandchildren107 28.1% Not responsible for grandchildrenGrandparents (60 years and over) White / Caucasian 80 35.1% Responsible for grandchildren148 64.9% Not responsible for grandchildrenBlack or African American 46 100.0% Not responsible for grandchildrenTwo or more races 26 100.0% Not responsible for grandchildrenWhite alone, not Hispanic / Latino 80 34.7% Responsible for grandchildren150 65.3% Not responsible for grandchildren