Races in Clayton, Delaware (DE) Detailed Stats
Data:
Races - White alone (%)
Races - White alone (% change since 2000)
Races - Black alone (%)
Races - Black alone (% change since 2000)
Races - American Indian alone (%)
Races - American Indian alone (% change since 2000)
Races - Asian alone (%)
Races - Asian alone (% change since 2000)
Races - Hispanic (%)
Races - Hispanic (% change since 2000)
Races - Native Hawaiian and Other Pacific Islander alone (%)
Races - Native Hawaiian and Other Pacific Islander alone (% change since 2000)
Races - Two or more races(%)
Races - Two or more races(% change since 2000)
Races - Other race alone (%)
Races - Other race alone (% change since 2000)
Racial diversity
Place of birth - Born in state of residence (%)
Place of birth - Born in state of residence (%) - White
Place of birth - Born in state of residence (%) - Black or African American
Place of birth - Born in state of residence (%) - Asian
Place of birth - Born in state of residence (%) - Hispanic or Latino
Place of birth - Born in state of residence (%) - American Indian and Alaska Native
Place of birth - Born in state of residence (%) - Multirace
Place of birth - Born in state of residence (%) - Other Race
Place of birth - Born in other state (%)
Place of birth - Born in other state (%) - White
Place of birth - Born in other state (%) - Black or African American
Place of birth - Born in other state (%) - Asian
Place of birth - Born in other state (%) - Hispanic or Latino
Place of birth - Born in other state (%) - American Indian and Alaska Native
Place of birth - Born in other state (%) - Multirace
Place of birth - Born in other state (%) - Other Race
Place of birth - Native, outside of US (%)
Place of birth - Native, outside of US (%) - White
Place of birth - Native, outside of US (%) - Black or African American
Place of birth - Native, outside of US (%) - Asian
Place of birth - Native, outside of US (%) - Hispanic or Latino
Place of birth - Native, outside of US (%) - American Indian and Alaska Native
Place of birth - Native, outside of US (%) - Multirace
Place of birth - Native, outside of US (%) - Other Race
Place of birth - Foreign born (%)
Place of birth - Foreign born (%) - White
Place of birth - Foreign born (%) - Black or African American
Place of birth - Foreign born (%) - Asian
Place of birth - Foreign born (%) - Hispanic or Latino
Place of birth - Foreign born (%) - American Indian and Alaska Native
Place of birth - Foreign born (%) - Multirace
Place of birth - Foreign born (%) - Other Race
Residents speaking English at home (%)
Residents speaking English at home - Born in the United States (%)
Residents speaking English at home - Native, born elsewhere (%)
Residents speaking English at home - Foreign born (%)
Residents speaking Spanish at home (%)
Residents speaking Spanish at home - Born in the United States (%)
Residents speaking Spanish at home - Native, born elsewhere (%)
Residents speaking Spanish at home - Foreign born (%)
Residents speaking other language at home (%)
Residents speaking other language at home - Born in the United States (%)
Residents speaking other language at home - Native, born elsewhere (%)
Residents speaking other language at home - Foreign born (%)
Marital status - Never married (%)
Marital status - Now married (%)
Marital status - Separated (%)
Marital status - Widowed (%)
Marital status - Divorced (%)
Ancestries Reported - Arab (%)
Ancestries Reported - Czech (%)
Ancestries Reported - Danish (%)
Ancestries Reported - Dutch (%)
Ancestries Reported - English (%)
Ancestries Reported - French (%)
Ancestries Reported - French Canadian (%)
Ancestries Reported - German (%)
Ancestries Reported - Greek (%)
Ancestries Reported - Hungarian (%)
Ancestries Reported - Irish (%)
Ancestries Reported - Italian (%)
Ancestries Reported - Lithuanian (%)
Ancestries Reported - Norwegian (%)
Ancestries Reported - Polish (%)
Ancestries Reported - Portuguese (%)
Ancestries Reported - Russian (%)
Ancestries Reported - Scotch-Irish (%)
Ancestries Reported - Scottish (%)
Ancestries Reported - Slovak (%)
Ancestries Reported - Subsaharan African (%)
Ancestries Reported - Swedish (%)
Ancestries Reported - Swiss (%)
Ancestries Reported - Ukrainian (%)
Ancestries Reported - United States (%)
Ancestries Reported - Welsh (%)
Ancestries Reported - West Indian (%)
Ancestries Reported - Other (%)
Geographical mobility - Same house 1 year ago (%)
Geographical mobility - Same house 1 year ago (%) - White
Geographical mobility - Same house 1 year ago (%) - Black or African American
Geographical mobility - Same house 1 year ago (%) - Asian
Geographical mobility - Same house 1 year ago (%) - Hispanic or Latino
Geographical mobility - Same house 1 year ago (%) - American Indian and Alaska Native
Geographical mobility - Same house 1 year ago (%) - Multirace
Geographical mobility - Same house 1 year ago (%) - Other Race
Geographical mobility - Moved within same county (%)
Geographical mobility - Moved within same county (%) - White
Geographical mobility - Moved within same county (%) - Black or African American
Geographical mobility - Moved within same county (%) - Asian
Geographical mobility - Moved within same county (%) - Hispanic or Latino
Geographical mobility - Moved within same county (%) - American Indian and Alaska Native
Geographical mobility - Moved within same county (%) - Multirace
Geographical mobility - Moved within same county (%) - Other Race
Geographical mobility - Moved from different county within same state (%)
Geographical mobility - Moved from different county within same state (%) - White
Geographical mobility - Moved from different county within same state (%) - Black or African American
Geographical mobility - Moved from different county within same state (%) - Asian
Geographical mobility - Moved from different county within same state (%) - Hispanic or Latino
Geographical mobility - Moved from different county within same state (%) - American Indian and Alaska Native
Geographical mobility - Moved from different county within same state (%) - Multirace
Geographical mobility - Moved from different county within same state (%) - Other Race
Geographical mobility - Moved from different state (%)
Geographical mobility - Moved from different state (%) - White
Geographical mobility - Moved from different state (%) - Black or African American
Geographical mobility - Moved from different state (%) - Asian
Geographical mobility - Moved from different state (%) - Hispanic or Latino
Geographical mobility - Moved from different state (%) - American Indian and Alaska Native
Geographical mobility - Moved from different state (%) - Multirace
Geographical mobility - Moved from different state (%) - Other Race
Geographical mobility - Moved from abroad (%)
Geographical mobility - Moved from abroad (%) - White
Geographical mobility - Moved from abroad (%) - Black or African American
Geographical mobility - Moved from abroad (%) - Asian
Geographical mobility - Moved from abroad (%) - Hispanic or Latino
Geographical mobility - Moved from abroad (%) - American Indian and Alaska Native
Geographical mobility - Moved from abroad (%) - Multirace
Geographical mobility - Moved from abroad (%) - Other Race
Place of birth for the foreign-born population - Ireland (%)
Place of birth for the foreign-born population - Denmark (%)
Place of birth for the foreign-born population - Norway (%)
Place of birth for the foreign-born population - Sweden (%)
Place of birth for the foreign-born population - United Kingdom (%)
Place of birth for the foreign-born population - England (%)
Place of birth for the foreign-born population - Scotland (%)
Place of birth for the foreign-born population - Other Northern Europe (%)
Place of birth for the foreign-born population - Austria (%)
Place of birth for the foreign-born population - Belgium (%)
Place of birth for the foreign-born population - France (%)
Place of birth for the foreign-born population - Germany (%)
Place of birth for the foreign-born population - Netherlands (%)
Place of birth for the foreign-born population - Switzerland (%)
Place of birth for the foreign-born population - Other Western Europe (%)
Place of birth for the foreign-born population - Greece (%)
Place of birth for the foreign-born population - Italy (%)
Place of birth for the foreign-born population - Portugal (%)
Place of birth for the foreign-born population - Spain (%)
Place of birth for the foreign-born population - Other Southern Europe (%)
Place of birth for the foreign-born population - Albania (%)
Place of birth for the foreign-born population - Belarus (%)
Place of birth for the foreign-born population - Bosnia and Herzegovina (%)
Place of birth for the foreign-born population - Bulgaria (%)
Place of birth for the foreign-born population - Croatia (%)
Place of birth for the foreign-born population - Czechoslovakia (%)
Place of birth for the foreign-born population - Hungary (%)
Place of birth for the foreign-born population - Latvia (%)
Place of birth for the foreign-born population - Lithuania (%)
Place of birth for the foreign-born population - North Macedonia (Macedonia) (%)
Place of birth for the foreign-born population - Moldova (%)
Place of birth for the foreign-born population - Poland (%)
Place of birth for the foreign-born population - Romania (%)
Place of birth for the foreign-born population - Russia (%)
Place of birth for the foreign-born population - Serbia (%)
Place of birth for the foreign-born population - Ukraine (%)
Place of birth for the foreign-born population - Other Eastern Europe (%)
Place of birth for the foreign-born population - China (%)
Place of birth for the foreign-born population - Hong Kong (%)
Place of birth for the foreign-born population - Taiwan (%)
Place of birth for the foreign-born population - Japan (%)
Place of birth for the foreign-born population - Korea (%)
Place of birth for the foreign-born population - Other Eastern Asia (%)
Place of birth for the foreign-born population - Afghanistan (%)
Place of birth for the foreign-born population - Bangladesh (%)
Place of birth for the foreign-born population - India (%)
Place of birth for the foreign-born population - Iran (%)
Place of birth for the foreign-born population - Kazakhstan (%)
Place of birth for the foreign-born population - Nepal (%)
Place of birth for the foreign-born population - Pakistan (%)
Place of birth for the foreign-born population - Sri Lanka (%)
Place of birth for the foreign-born population - Uzbekistan (%)
Place of birth for the foreign-born population - Other South Central Asia (%)
Place of birth for the foreign-born population - Burma (%)
Place of birth for the foreign-born population - Cambodia (%)
Place of birth for the foreign-born population - Indonesia (%)
Place of birth for the foreign-born population - Laos (%)
Place of birth for the foreign-born population - Malaysia (%)
Place of birth for the foreign-born population - Philippines (%)
Place of birth for the foreign-born population - Singapore (%)
Place of birth for the foreign-born population - Thailand (%)
Place of birth for the foreign-born population - Vietnam (%)
Place of birth for the foreign-born population - Other South Eastern Asia (%)
Place of birth for the foreign-born population - Armenia (%)
Place of birth for the foreign-born population - Iraq (%)
Place of birth for the foreign-born population - Israel (%)
Place of birth for the foreign-born population - Jordan (%)
Place of birth for the foreign-born population - Kuwait (%)
Place of birth for the foreign-born population - Lebanon (%)
Place of birth for the foreign-born population - Saudi Arabia (%)
Place of birth for the foreign-born population - Syria (%)
Place of birth for the foreign-born population - Turkey (%)
Place of birth for the foreign-born population - Yemen (%)
Place of birth for the foreign-born population - Other Western Asia (%)
Place of birth for the foreign-born population - Eritrea (%)
Place of birth for the foreign-born population - Ethiopia (%)
Place of birth for the foreign-born population - Kenya (%)
Place of birth for the foreign-born population - Somalia (%)
Place of birth for the foreign-born population - Uganda (%)
Place of birth for the foreign-born population - Zimbabwe (%)
Place of birth for the foreign-born population - Other Eastern Africa (%)
Place of birth for the foreign-born population - Cameroon (%)
Place of birth for the foreign-born population - Congo (%)
Place of birth for the foreign-born population - Democratic Republic of Congo (Zaire) (%)
Place of birth for the foreign-born population - Other Middle Africa (%)
Place of birth for the foreign-born population - Egypt (%)
Place of birth for the foreign-born population - Morocco (%)
Place of birth for the foreign-born population - Sudan (%)
Place of birth for the foreign-born population - Other Northern Africa (%)
Place of birth for the foreign-born population - South Africa (%)
Place of birth for the foreign-born population - Other Southern Africa (%)
Place of birth for the foreign-born population - Cabo Verde (%)
Place of birth for the foreign-born population - Ghana (%)
Place of birth for the foreign-born population - Liberia (%)
Place of birth for the foreign-born population - Nigeria (%)
Place of birth for the foreign-born population - Senegal (%)
Place of birth for the foreign-born population - Sierra Leone (%)
Place of birth for the foreign-born population - Other Western Africa (%)
Place of birth for the foreign-born population - Australia (%)
Place of birth for the foreign-born population - New Zealand (%)
Place of birth for the foreign-born population - Fiji (%)
Place of birth for the foreign-born population - Micronesia (%)
Place of birth for the foreign-born population - Bahamas (%)
Place of birth for the foreign-born population - Barbados (%)
Place of birth for the foreign-born population - Cuba (%)
Place of birth for the foreign-born population - Dominica (%)
Place of birth for the foreign-born population - Dominican Republic (%)
Place of birth for the foreign-born population - Grenada (%)
Place of birth for the foreign-born population - Haiti (%)
Place of birth for the foreign-born population - Jamaica (%)
Place of birth for the foreign-born population - St. Vincent and the Grenadines (%)
Place of birth for the foreign-born population - Trinidad and Tobago (%)
Place of birth for the foreign-born population - West Indies (%)
Place of birth for the foreign-born population - Other Caribbean (%)
Place of birth for the foreign-born population - Belize (%)
Place of birth for the foreign-born population - Costa Rica (%)
Place of birth for the foreign-born population - El Salvador (%)
Place of birth for the foreign-born population - Guatemala (%)
Place of birth for the foreign-born population - Honduras (%)
Place of birth for the foreign-born population - Mexico (%)
Place of birth for the foreign-born population - Nicaragua (%)
Place of birth for the foreign-born population - Panama (%)
Place of birth for the foreign-born population - Other Central America (%)
Place of birth for the foreign-born population - Argentina (%)
Place of birth for the foreign-born population - Bolivia (%)
Place of birth for the foreign-born population - Brazil (%)
Place of birth for the foreign-born population - Chile (%)
Place of birth for the foreign-born population - Colombia (%)
Place of birth for the foreign-born population - Ecuador (%)
Place of birth for the foreign-born population - Guyana (%)
Place of birth for the foreign-born population - Peru (%)
Place of birth for the foreign-born population - Uruguay (%)
Place of birth for the foreign-born population - Venezuela (%)
Place of birth for the foreign-born population - Other South America (%)
Place of birth for the foreign-born population - Canada (%)
Place of birth for the foreign-born population - Other Northern America (%)
Place of birth for the foreign-born population - Other (%)
Latest news about races in Clayton, DE collected exclusively by city-data.com from local newspapers, TV, and radio stations
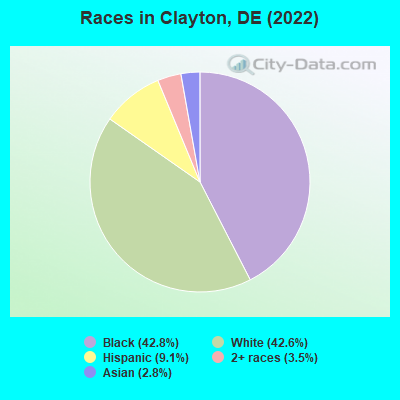
According to 2022 data, the most numerous races in Clayton, DE are White alone (1,737 residents), Black alone (1,743 residents), and Hispanic (371 residents). 82.6% of Clayton residents speak English at home. 11.4% of Clayton, DE residents are foreign-born (6.9% born in Africa, 2.4% born in Asia, 1.9% born in Latin America), which is 20.7% greater than the foreign-born rate of 9.0% across the entire state of Delaware.
Race distribution in Clayton
2000 2022
567,973 72.5% White alone 148,435 18.9% Black alone 37,277 4.8% Hispanic 16,110 2.1% Asian alone 10,222 1.3% Two or more races 2,324 0.3% American Indian alone 1,025 0.1% Other race alone 234 0.03% Native Hawaiian and Other
599,347 58.9% White alone 220,010 21.6% Black alone 105,300 10.3% Hispanic 46,016 4.5% Two or more races 41,350 4.1% Asian alone 5,097 0.5% Other race alone 1,276 0.1% American Indian alone
Income and house value in Clayton Median household income in 2022 $92,575 White non-Hispanic householders$111,255 Black householders$83,449 Two or more races householdersMedian 2022 house value $376,896 White Non-Hispanic householders$350,782 Black or African American householders$253,342 American Indian or Alaska Native householders$331,294 Hispanic or Latino householders
Median age by race in Clayton
37.2 Median age for White residents28.5 39.3 47.6 Median age for Black or African American residents48.5 48.5 -819,327,730.3 Median age for American Indian / Alaska Native residents-828,451,882.0 -765,151,514.4 47.6 Median age for Asian residents48.4 43.8 -666,666,666.0 Median age for Native Hawaiian / Pacific Islander residents-668,724,279.2 -666,666,666.0 33.1 Median age for Other race residents32.4 40.7 37.8 Median age for Two or more races residents38.0 38.7 37.7 Median age for White alone residents31.6 39.4 29.6 Median age for Hispanic or Latino residents20.0 33.8
Owner/renter occupied households by race in Clayton
House owners and renters - White residents 516 79.1% Owner occupied136 20.9% Renter occupiedHouse owners and renters - Black or African American residents 553 89.7% Owner occupied64 10.3% Renter occupiedHouse owners and renters - Asian residents 21 100.0% Owner occupiedHouse owners and renters - Other race residents 55 100.0% Owner occupiedHouse owners and renters - Two or more races residents 64 79.0% Owner occupied17 21.0% Renter occupiedHouse owners and renters - White alone residents 487 76.6% Owner occupied148 23.4% Renter occupiedHouse owners and renters - Hispanic or Latino residents 139 95.8% Owner occupied6 4.2% Renter occupied
Language usage in Clayton
English speakers - Total 82.6% of residents of Clayton speak English at home.
7.2% of residents speak Spanish at home 205 74.5% Speak English very well70 25.5% Speak English less than very well9.7% of residents speak other language at home 196 53.1% Speak English very well173 46.9% Speak English less than very well
English speakers - Born in the United States 88.5% of residents of Clayton speak English at home.
6.3% of residents speak Spanish at home 103 94.5% Speak English very well6 5.5% Speak English less than very well4.7% of residents speak other language at home 30 36.6% Speak English very well52 63.4% Speak English less than very well
English speakers - Native, born elsewhere 40.9% of residents of Clayton speak English at home.
56.8% of residents speak Spanish at home 16 64.0% Speak English very well9 36.0% Speak English less than very well
English speakers - Foreign-born 33.6% of residents of Clayton speak English at home.
11.4% of residents speak Spanish at home 25 43.9% Speak English very well32 56.1% Speak English less than very well49.8% of residents speak other language at home 162 65.1% Speak English very well87 34.9% Speak English less than very well
White (Caucasian) - Speak only English Native:
96.5% (1,658)Foreign-born:
93.3% (7)
Black or African American - Speak only English Native:
89.8% (1,152)Foreign-born:
51.0% (152)
Black or African American - Speak another language Native:
11.8% (151)Foreign-born:
50.4% (150)
Asian - Speak another language Native:
51.1% (8)Foreign-born:
81.3% (84)
Two or more races - Speak another language Native:
41.4% (95)Foreign-born:
100.0% (71)
White alone - Speak only English Native:
96.4% (1,592)Foreign-born:
82.4% (6)
Hispanic or Latino - Speak another language Native:
47.7% (137)Foreign-born:
98.4% (53)
Foreign-born residents in Clayton 463 residents are foreign born (6.9% Africa , 2.4% Asia , 1.9% Latin America ).
This city:
11.4%Delaware:
9.8%
Marital status for residents in Clayton Marital status - White (Caucasian) population 15 years and over
Males 29.2% Never married59.0% Now married0.0% Separated2.5% Widowed9.4% DivorcedFemales 19.1% Never married47.8% Now married0.0% Separated12.9% Widowed20.1% DivorcedWomen who gave birth in the past 12 months Now married:
59.3% (15)Unmarried:
40.7% (10)
Women who did not give birth in the past 12 months Now married:
61.7% (227)Unmarried:
38.3% (141)
Marital status - Black or African American population 15 years and over
Males 16.1% Never married62.6% Now married8.9% Separated0.0% Widowed12.5% DivorcedFemales 29.1% Never married35.7% Now married1.7% Separated17.5% Widowed15.9% DivorcedWomen who gave birth in the past 12 months Now married:
100.0% (15)Unmarried:
0.0% (0)
Women who did not give birth in the past 12 months Now married:
32.8% (87)Unmarried:
67.2% (178)
Marital status - American Indian / Alaska Native population 15 years and over
Males 0.0% Never married100.0% Now married0.0% Separated0.0% Widowed0.0% DivorcedFemales 0.0% Never married100.0% Now married0.0% Separated0.0% Widowed0.0% DivorcedWomen who did not give birth in the past 12 months Now married:
100.0% (4)Unmarried:
0.0% (0)
Marital status - Asian population 15 years and over
Males 0.0% Never married77.1% Now married0.0% Separated0.0% Widowed22.9% DivorcedFemales 0.0% Never married100.0% Now married0.0% Separated0.0% Widowed0.0% DivorcedWomen who did not give birth in the past 12 months Now married:
100.0% (30)Unmarried:
0.0% (0)
Marital status - Other race population 15 years and over
Males 78.8% Never married21.2% Now married0.0% Separated0.0% Widowed0.0% DivorcedFemales 35.0% Never married65.0% Now married0.0% Separated0.0% Widowed0.0% DivorcedWomen who did not give birth in the past 12 months Now married:
53.3% (10)Unmarried:
46.7% (9)
Marital status - Two or more races population 15 years and over
Males 64.4% Never married30.0% Now married0.0% Separated0.0% Widowed5.6% DivorcedFemales 20.8% Never married72.2% Now married0.0% Separated0.0% Widowed6.9% DivorcedWomen who gave birth in the past 12 months Now married:
100.0% (8)Unmarried:
0.0% (0)
Women who did not give birth in the past 12 months Now married:
82.1% (59)Unmarried:
17.9% (13)
Marital status - White alone, not Hispanic / Latino population 15 years and over
Males 25.7% Never married61.0% Now married0.0% Separated2.8% Widowed10.4% DivorcedFemales 19.3% Never married47.4% Now married0.0% Separated13.0% Widowed20.3% DivorcedWomen who gave birth in the past 12 months Now married:
59.3% (16)Unmarried:
40.7% (11)
Women who did not give birth in the past 12 months Now married:
61.7% (234)Unmarried:
38.3% (145)
Marital status - Hispanic or Latino population 15 years and over
Males 60.8% Never married39.2% Now married0.0% Separated0.0% Widowed0.0% DivorcedFemales 19.8% Never married75.3% Now married0.0% Separated0.0% Widowed4.9% DivorcedWomen who did not give birth in the past 12 months Now married:
82.3% (52)Unmarried:
17.7% (11)
Ancestries in Clayton
257 10.9% Nigerian191 8.1% American143 6.1% Irish76 3.2% Russian76 3.2% Liberian45 1.9% Ghanaian37 1.6% French35 1.5% English25 1.1% Polish23 1.0% Italian23 1.0% African22 0.9% Ugandan18 0.8% Scottish13 0.6% Dutch12 0.5% German11 0.5% Haitian10 0.4% Swiss8 0.3% Scotch-Irish6 0.3% Brazilian5 0.2% Canadian5 0.2% European1 0.04% British1 0.04% Welsh
Children Nativity (place of birth) in Clayton
Children under 6 years - Living with two parents Both parents native 57 100.0% NativeBoth parents foreign-born 34 100.0% NativeOne native, one foreign-born parent 73 100.0% NativeChildren under 6 years - Living with one parent Native parent 99 100.0% NativeForeign-born parent 20 100.0% Native
Children 6 to 17 years - Living with two parents Both parents native 497 100.0% NativeBoth parents foreign-born 220 100.0% NativeOne native, one foreign-born parent 5 100.0% NativeChildren 6 to 17 years - Living with one parent Native parent 234 100.0% Native
Grandparents responsible for own grandchildren in Clayton
Grandparents (30 to 59 years) White / Caucasian 5 27.4% Responsible for grandchildren14 72.6% Not responsible for grandchildrenBlack or African American 16 100.0% Responsible for grandchildrenAsian 7 100.0% Responsible for grandchildrenTwo or more races 2 100.0% Responsible for grandchildrenWhite alone, not Hispanic / Latino 5 27.2% Responsible for grandchildren14 72.8% Not responsible for grandchildrenGrandparents (60 years and over) White / Caucasian 9 100.0% Responsible for grandchildrenBlack or African American 113 51.7% Responsible for grandchildren105 48.3% Not responsible for grandchildrenAsian 14 100.0% Not responsible for grandchildrenWhite alone, not Hispanic / Latino 9 100.0% Responsible for grandchildren