Races in Danville, Kentucky (KY) Detailed Stats
Ancestries, Foreign-born residents, place of birth
Settings
X


Recent posts about races in Danville, Kentucky on our local forum with over 2,400,000 registered users:
 | December 11, 2021 Deadly Tornado System (94 replies) |
| Looking at Danville, KY as a retirement spot (43 replies) |
| Moving to Danville - Suggestions for rentals? (6 replies) |
| Possible move to Danville (17 replies) |
| Louisville Exceeded My Expectations!! Thinking of moving.. (21 replies) |
| Asian couple moving to Lexington, KY (8 replies) |
Latest news about races in Danville, KY collected exclusively by city-data.com from local newspapers, TV, and radio stations
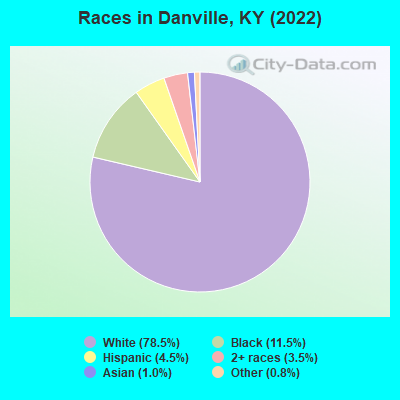
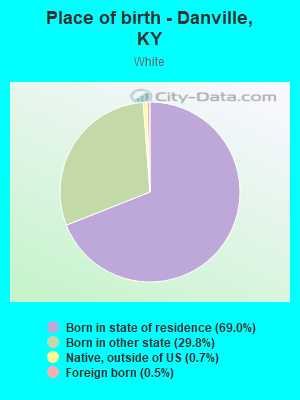
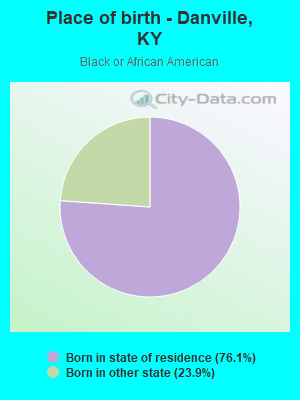
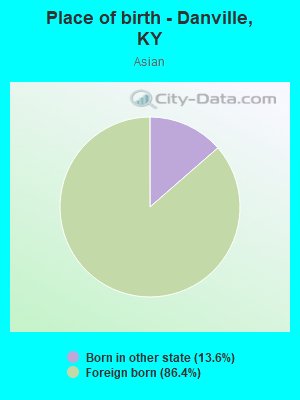
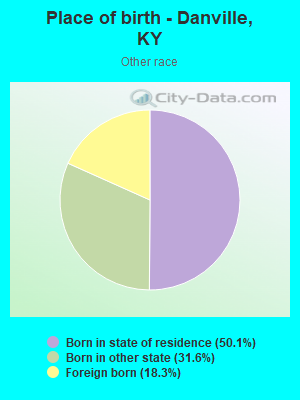
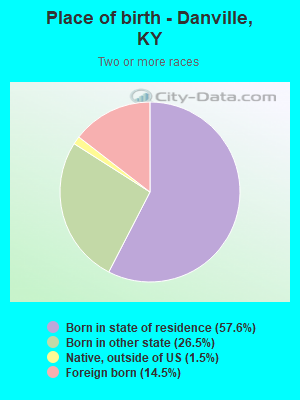
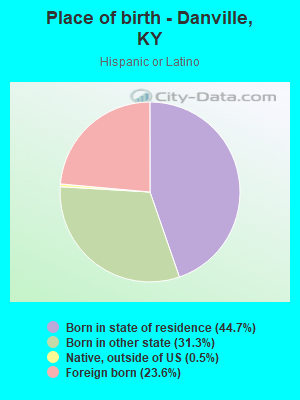
According to 2022 data, the most numerous races in Danville, KY are White alone (13,529 residents), Black alone (1,980 residents), and Hispanic (772 residents). 96.0% of Danville residents speak English at home. 2.5% of Danville, KY residents are foreign-born (1.1% born in Asia, 1.1% born in Latin America), which is 58.0% less than the foreign-born rate of 4.0% across the entire state of Kentucky.
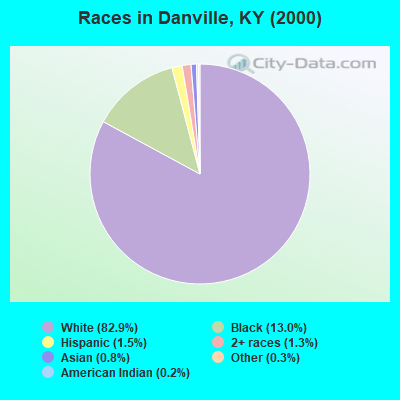
Race distribution in Danville
2000
2022

- 12,83482.9%White alone
- 2,00513.0%Black alone
- 2291.5%Hispanic
- 1981.3%Two or more races
- 1270.8%Asian alone
- 480.3%Other race alone
- 310.2%American Indian alone
- 50.03%Native Hawaiian and Other
Pacific Islander alone
-
- 13,52978.5%White alone
- 1,98011.5%Black alone
- 7724.5%Hispanic
- 6043.5%Two or more races
- 1731.0%Asian alone
- 1320.8%Other race alone
- 70.04%American Indian alone
2000
2022
-
- 3,608,01389.3%White alone
- 293,6397.3%Black alone
- 59,9391.5%Hispanic
- 37,7500.9%Two or more races
- 29,3680.7%Asian alone
- 7,9390.2%American Indian alone
- 3,8460.10%Other race alone
- 1,2750.03%Native Hawaiian and Other
Pacific Islander alone

-
- 3,710,99882.2%White alone
- 343,1947.6%Black alone
- 187,4834.2%Hispanic
- 187,3944.2%Two or more races
- 62,2401.4%Asian alone
- 13,5290.3%Other race alone
- 4,3020.10%American Indian alone
- 3,1700.07%Native Hawaiian and Other
Pacific Islander alone

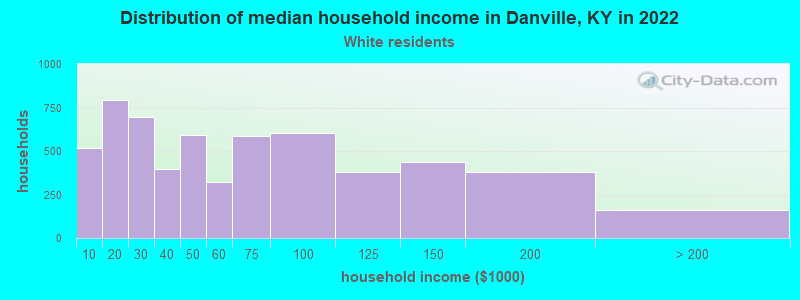
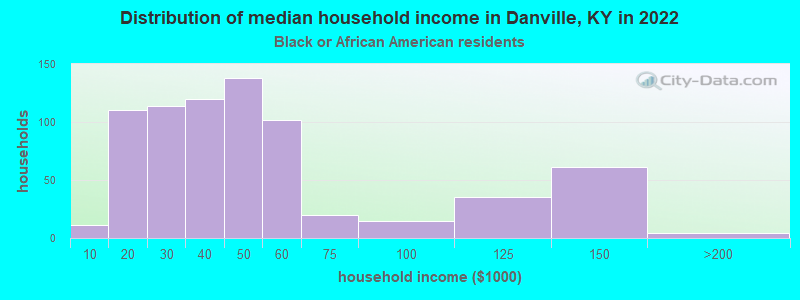
Income and house value in Danville
- Median household income in 2022
- $48,640White non-Hispanic householders
- $39,827Black householders
- $86,234Some other race householders
- $44,249Two or more races householders
- $45,386Hispanic or Latino race householders
- Median 2022 house value
- $216,495White Non-Hispanic householders
- $144,557Black or African American householders
- $526,714Asian householders
- $249,627Some other race householders
- $170,200Two or more races householders
- $215,587Hispanic or Latino householders
Household income for White non-Hispanic householders
Household income for Black householders
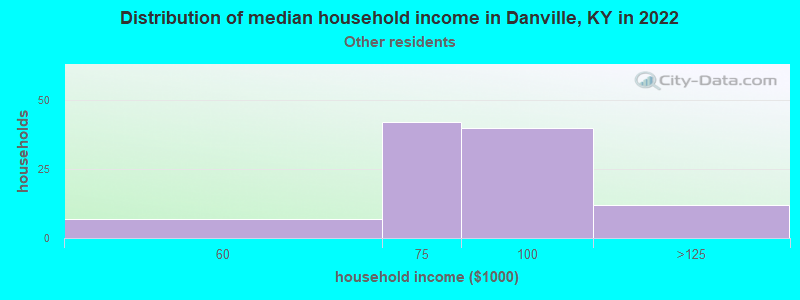
Household income for Some other race householders
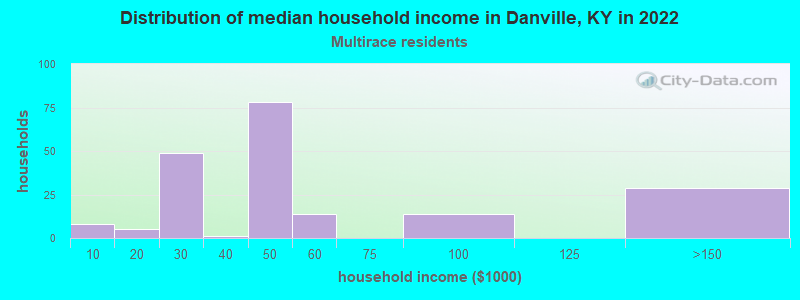
Household income for Two or more races householders
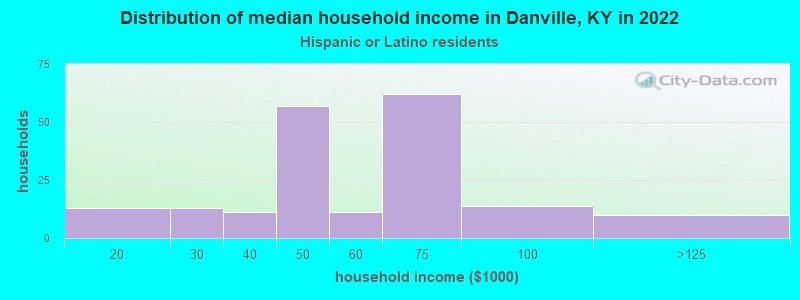
Household income for Hispanic or Latino race householders
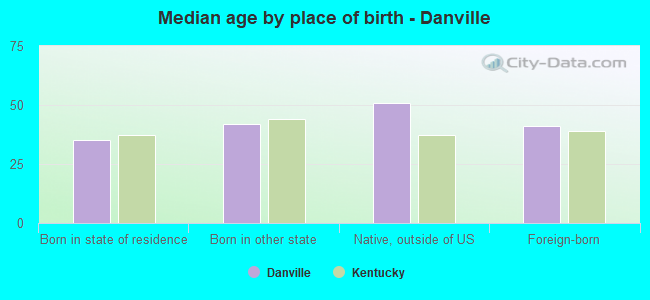
Median age by race in Danville
- 39.1Median age for White residents
- 35.7Males
- 42.7Females
- 34.8Median age for Black or African American residents
- 33.8Males
- 42.5Females
- -521,556,256.1Median age for American Indian / Alaska Native residents
- -607,449,856.1Males
- -630,065,358.8Females
- 23.3Median age for Asian residents
- 22.1Males
- 51.3Females
- -755,186,721.2Median age for Native Hawaiian / Pacific Islander residents
- -724,043,715.1Males
- -853,801,168.7Females
- 28.1Median age for Other race residents
- 30.9Males
- 28.9Females
- 12.6Median age for Two or more races residents
- 22.7Males
- 10.6Females
- 39.5Median age for White alone residents
- 35.8Males
- 43.4Females
- 21.7Median age for Hispanic or Latino residents
- 16.3Males
- 23.4Females
Owner/renter occupied households by race in Danville
- House owners and renters - White residents
- 3,49460.1%Owner occupied
- 2,32039.9%Renter occupied
- House owners and renters - Black or African American residents
- 34146.8%Owner occupied
- 38753.2%Renter occupied
- House owners and renters - American Indian / Alaska Native residents
- 9100.0%Renter occupied
- House owners and renters - Other race residents
- 6774.4%Owner occupied
- 2325.6%Renter occupied
- House owners and renters - Two or more races residents
- 3016.6%Owner occupied
- 15183.4%Renter occupied
- House owners and renters - White alone residents
- 3,48860.3%Owner occupied
- 2,29739.7%Renter occupied
- House owners and renters - Hispanic or Latino residents
- 5833.8%Owner occupied
- 11366.2%Renter occupied
Language usage in Danville
- English speakers - Total
- 96.0% of residents of Danville speak English at home.
- 2.3% of residents speak Spanish at home
- 20956.2%Speak English very well
- 16343.8%Speak English less than very well
- 1.8% of residents speak other language at home
- 19868.0%Speak English very well
- 9332.0%Speak English less than very well
- English speakers - Born in the United States
- 95.9% of residents of Danville speak English at home.
- 2.6% of residents speak Spanish at home
- 127100.0%Speak English very well
- 1.5% of residents speak other language at home
- 76100.0%Speak English very well
- English speakers - Native, born elsewhere
- 89.2% of residents of Danville speak English at home.
- 8.1% of residents speak Spanish at home
- 9100.0%Speak English very well
- English speakers - Foreign-born
- 19.0% of residents of Danville speak English at home.
- 41.7% of residents speak Spanish at home
- 4224.0%Speak English very well
- 13376.0%Speak English less than very well
- 39.0% of residents speak other language at home
- 9356.7%Speak English very well
- 7143.3%Speak English less than very well
White (Caucasian) - Speak only English
| Native: | 99.0% (12,916) |
| Foreign-born: | 53.0% (39) |
White (Caucasian) - Speak another language
| Native: | 1.0% (130) |
| Foreign-born: | 52.3% (38) |
Asian - Speak another language
| Native: | 100.0% (23) |
| Foreign-born: | 80.1% (128) |
Other race - Speak another language
| Native: | 20.4% (48) |
| Foreign-born: | 98.6% (64) |
Two or more races - Speak another language
| Native: | 4.2% (35) |
| Foreign-born: | 98.8% (140) |
White alone - Speak only English
| Native: | 99.1% (12,771) |
| Foreign-born: | 51.4% (36) |
White alone - Speak another language
| Native: | 0.8% (107) |
| Foreign-born: | 49.7% (35) |
Hispanic or Latino - Speak only English
| Native: | 84.2% (455) |
| Foreign-born: | 2.7% (5) |
Hispanic or Latino - Speak another language
| Native: | 17.1% (93) |
| Foreign-born: | 97.5% (175) |
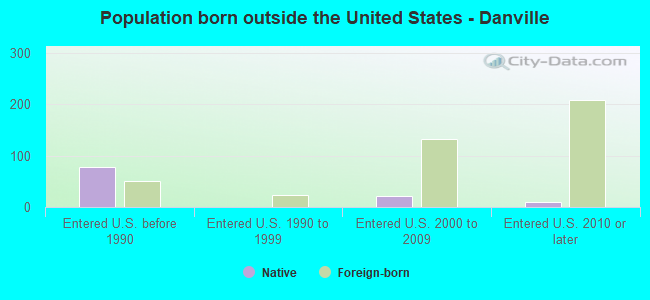
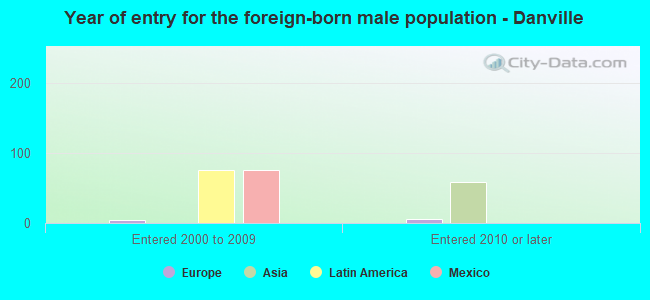
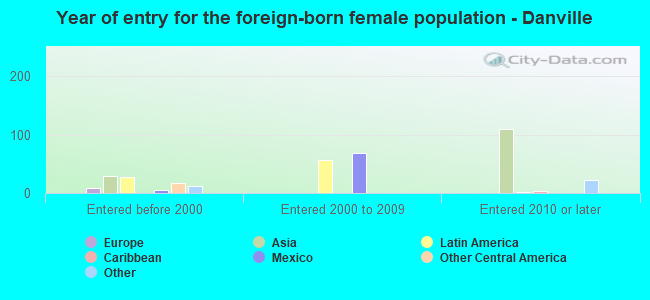
Foreign-born residents in Danville
436 residents are foreign born (1.1% Asia, 1.1% Latin America).
| This city: | 2.5% |
| Kentucky: | 4.1% |

Marital status for residents in Danville
Marital status - White (Caucasian) population 15 years and over
- Males
- 38.9%Never married
- 44.1%Now married
- 2.2%Separated
- 3.2%Widowed
- 11.6%Divorced
- Females
- 26.3%Never married
- 38.1%Now married
- 3.1%Separated
- 12.6%Widowed
- 19.8%Divorced
Women who gave birth in the past 12 months
| Now married: | 74.8% (182) |
| Unmarried: | 25.2% (61) |
Women who did not give birth in the past 12 months
| Now married: | 36.2% (1,049) |
| Unmarried: | 63.8% (1,850) |
Marital status - Black or African American population 15 years and over
- Males
- 48.2%Never married
- 25.9%Now married
- 0.6%Separated
- 5.2%Widowed
- 20.1%Divorced
- Females
- 57.9%Never married
- 15.6%Now married
- 1.6%Separated
- 6.4%Widowed
- 18.5%Divorced
Women who did not give birth in the past 12 months
| Now married: | 2.8% (14) |
| Unmarried: | 97.2% (483) |
Marital status - Asian population 15 years and over
- Males
- 100.0%Never married
- 0.0%Now married
- 0.0%Separated
- 0.0%Widowed
- 0.0%Divorced
- Females
- 34.9%Never married
- 65.1%Now married
- 0.0%Separated
- 0.0%Widowed
- 0.0%Divorced
Women who did not give birth in the past 12 months
| Now married: | 62.5% (67) |
| Unmarried: | 37.5% (40) |
Marital status - Other race population 15 years and over
- Males
- 37.7%Never married
- 19.2%Now married
- 0.0%Separated
- 0.0%Widowed
- 43.0%Divorced
- Females
- 57.3%Never married
- 42.7%Now married
- 0.0%Separated
- 0.0%Widowed
- 0.0%Divorced
Women who did not give birth in the past 12 months
| Now married: | 33.8% (34) |
| Unmarried: | 66.2% (67) |
Marital status - Two or more races population 15 years and over
- Males
- 89.0%Never married
- 11.0%Now married
- 0.0%Separated
- 0.0%Widowed
- 0.0%Divorced
- Females
- 64.5%Never married
- 26.6%Now married
- 0.0%Separated
- 7.3%Widowed
- 1.6%Divorced
Women who gave birth in the past 12 months
| Now married: | 0.0% (0) |
| Unmarried: | 100.0% (1) |
Women who did not give birth in the past 12 months
| Now married: | 39.4% (37) |
| Unmarried: | 60.6% (57) |
Marital status - White alone, not Hispanic / Latino population 15 years and over
- Males
- 38.7%Never married
- 44.4%Now married
- 2.2%Separated
- 3.1%Widowed
- 11.6%Divorced
- Females
- 25.7%Never married
- 38.6%Now married
- 3.1%Separated
- 12.7%Widowed
- 19.8%Divorced
Women who gave birth in the past 12 months
| Now married: | 74.8% (184) |
| Unmarried: | 25.2% (62) |
Women who did not give birth in the past 12 months
| Now married: | 37.0% (1,058) |
| Unmarried: | 63.0% (1,804) |
Marital status - Hispanic or Latino population 15 years and over
- Males
- 75.7%Never married
- 13.6%Now married
- 0.0%Separated
- 3.7%Widowed
- 7.0%Divorced
- Females
- 69.9%Never married
- 21.1%Now married
- 0.0%Separated
- 2.8%Widowed
- 6.1%Divorced
Women who did not give birth in the past 12 months
| Now married: | 23.5% (46) |
| Unmarried: | 76.5% (149) |
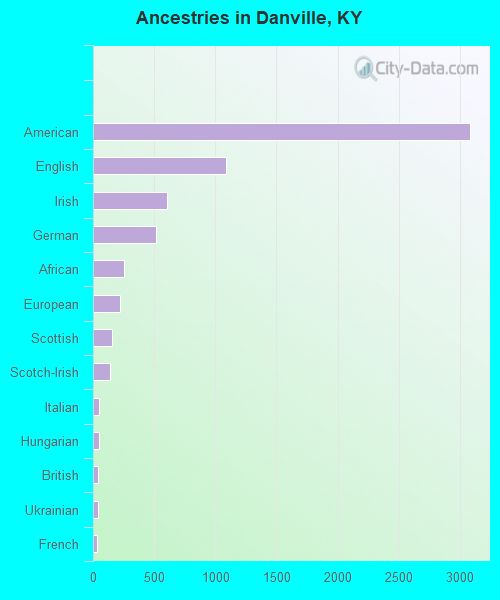
Ancestries in Danville

- 3,08334.6%American
- 1,08412.2%English
- 6066.8%Irish
- 5115.7%German
- 2572.9%African
- 2232.5%European
- 1551.7%Scottish
- 1371.5%Scotch-Irish
- 530.6%Italian
- 450.5%Hungarian
- 430.5%British
- 370.4%Ukrainian
- 350.4%French
- 280.3%Polish
- 220.2%Greek
- 210.2%Welsh
- 170.2%Egyptian
- 160.2%Norwegian
- 140.2%Dutch
- 140.2%Russian
- 130.1%Jordanian
- 130.1%French Canadian
- 110.1%Canadian
- 110.1%Haitian
- 100.1%Moroccan
- 90.1%Lithuanian
- 70.08%New Zealander
- 50.06%Austrian
- 50.06%Swedish
- 40.04%Finnish
- 30.03%Iranian
- 30.03%Ethiopian
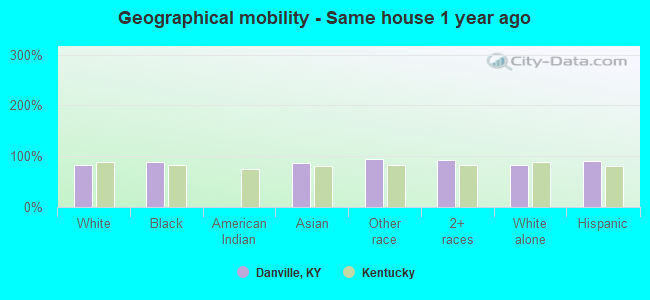
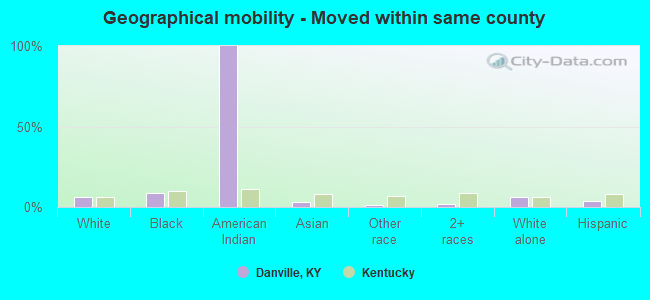
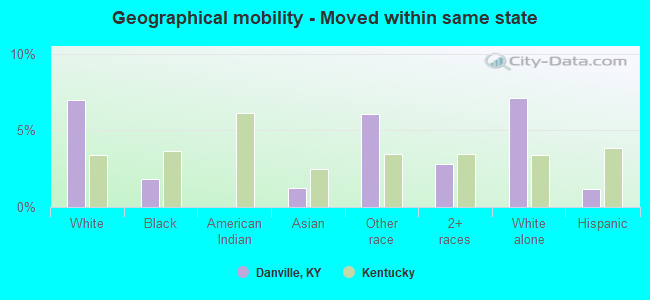
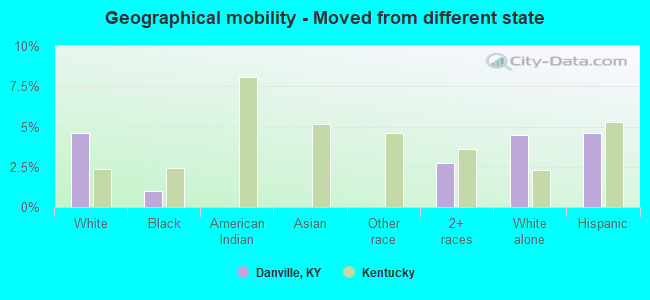
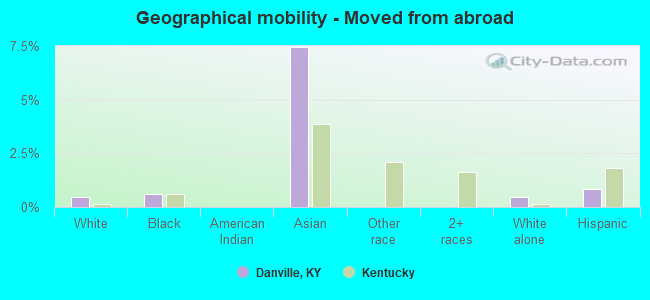
Geographical mobility in Danville

- Same house 1 year ago
- 11,09682.0%White (Caucasian)
- 1,78588.7%Black or African American
- 16087.7%Asian
- 33894.6%Other race
- 90792.5%Two or more races
- 10,97482.0%White alone, not Hispanic / Latino
- 69390.0%Hispanic or Latino
-
- Moved within same county
- 8146.0%White / Caucasian
- 1758.7%Black or African American
- 12100.0%American Indian / Alaska Native
- 52.9%Asian
- 41.0%Other race
- 151.6%Two or more races
- 8096.0%White alone, not Hispanic / Latino
- 303.9%Hispanic or Latino
-
- Moved within same state
- 9406.9%White / Caucasian
- 371.9%Black or African American
- 21.2%Asian
- 226.1%Other race
- 282.8%Two or more races
- 9487.1%White alone, not Hispanic / Latino
- 91.2%Hispanic or Latino
-
- Moved from different state
- 6184.6%White / Caucasian
- 191.0%Black or African American
- 272.8%Two or more races
- 5984.5%White alone, not Hispanic / Latino
- 354.6%Hispanic or Latino
-
- Moved from abroad
- 630.5%White
- 130.6%Black or African American
- 147.4%Asian
- 610.5%White alone, not Hispanic / Latino
- 60.8%Hispanic or Latino
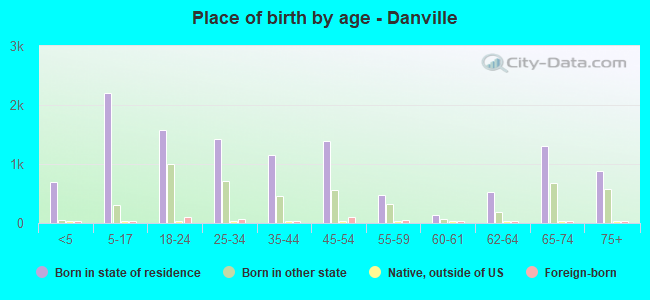
Children Nativity (place of birth) in Danville
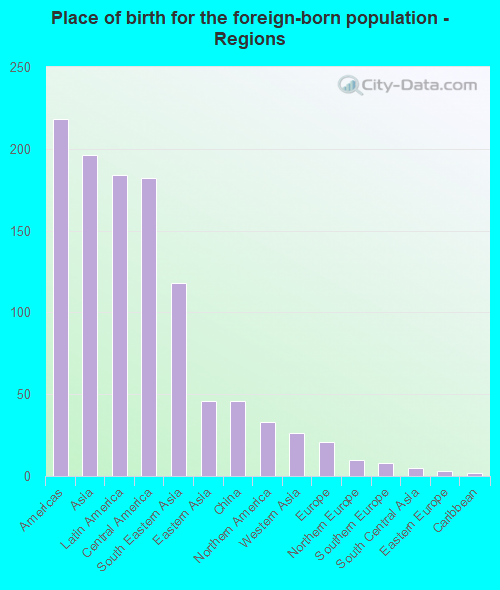
Place of birth for residents in Danville
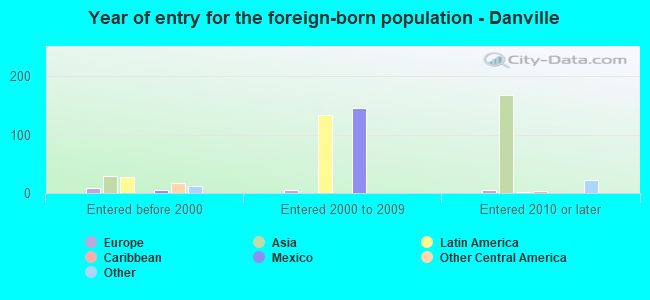
![Place of birth for the foreign-born population - Regions]()
- 218Americas
- 196Asia
- 184Latin America
- 182Central America
- 118South Eastern Asia
- 46Eastern Asia
- 46China
- 33Northern America
- 26Western Asia
- 21Europe
- 10Northern Europe
- 8Southern Europe
- 5South Central Asia
- 3Eastern Europe
- 2Caribbean
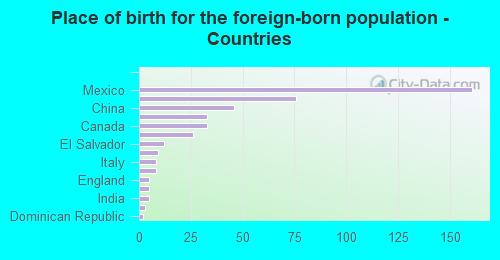
![Place of birth for the foreign-born population - Countries]()
- 161Mexico
- 76Philippines
- 46China
- 33Vietnam
- 33Canada
- 26Jordan
- 12El Salvador
- 9Honduras
- 8Italy
- 8Burma (Myanmar)
- 5England
- 5Scotland
- 5India
- 3Russia
- 2Dominican Republic
Grandparents responsible for own grandchildren in Danville
Zip codes: 40422.