Races in Dearborn Heights, Michigan (MI) Detailed Stats
Data:
Races - White alone (%)
Races - White alone (% change since 2000)
Races - Black alone (%)
Races - Black alone (% change since 2000)
Races - American Indian alone (%)
Races - American Indian alone (% change since 2000)
Races - Asian alone (%)
Races - Asian alone (% change since 2000)
Races - Hispanic (%)
Races - Hispanic (% change since 2000)
Races - Native Hawaiian and Other Pacific Islander alone (%)
Races - Native Hawaiian and Other Pacific Islander alone (% change since 2000)
Races - Two or more races(%)
Races - Two or more races(% change since 2000)
Races - Other race alone (%)
Races - Other race alone (% change since 2000)
Racial diversity
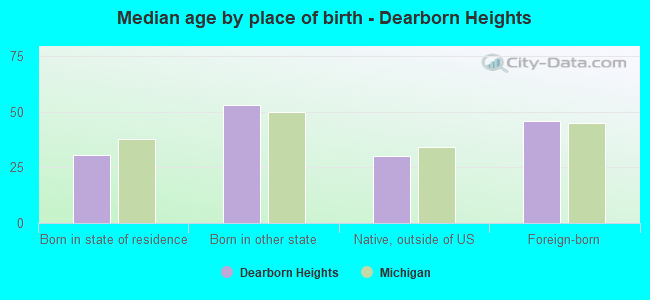
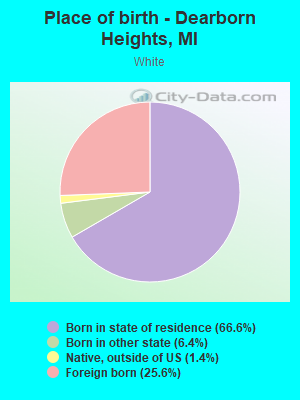
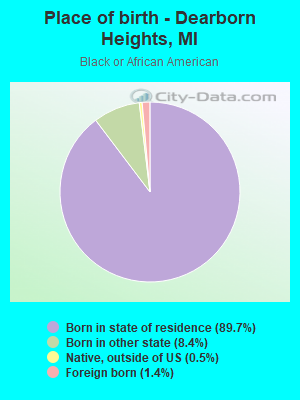
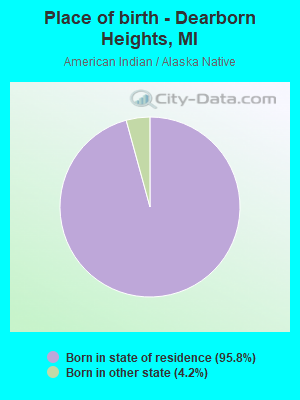
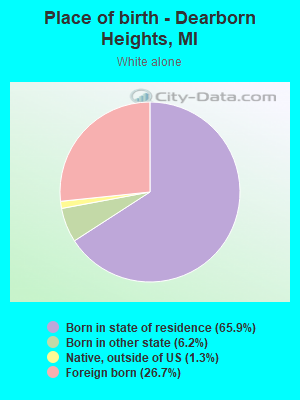
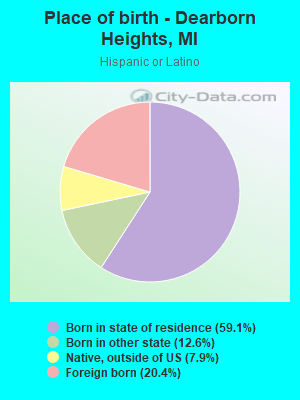
Place of birth - Born in state of residence (%)
Place of birth - Born in state of residence (%) - White
Place of birth - Born in state of residence (%) - Black or African American
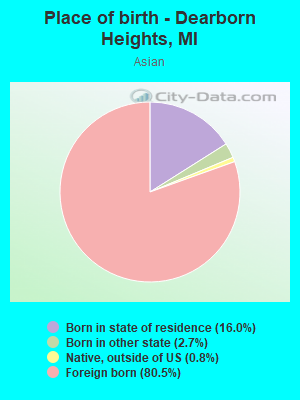
Place of birth - Born in state of residence (%) - Asian
Place of birth - Born in state of residence (%) - Hispanic or Latino
Place of birth - Born in state of residence (%) - American Indian and Alaska Native
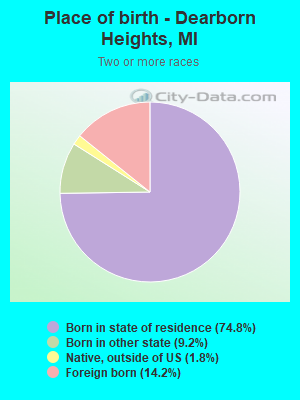
Place of birth - Born in state of residence (%) - Multirace
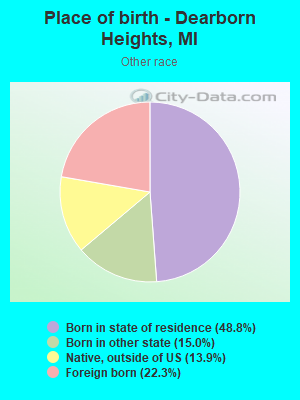
Place of birth - Born in state of residence (%) - Other Race
Place of birth - Born in other state (%)
Place of birth - Born in other state (%) - White
Place of birth - Born in other state (%) - Black or African American
Place of birth - Born in other state (%) - Asian
Place of birth - Born in other state (%) - Hispanic or Latino
Place of birth - Born in other state (%) - American Indian and Alaska Native
Place of birth - Born in other state (%) - Multirace
Place of birth - Born in other state (%) - Other Race
Place of birth - Native, outside of US (%)
Place of birth - Native, outside of US (%) - White
Place of birth - Native, outside of US (%) - Black or African American
Place of birth - Native, outside of US (%) - Asian
Place of birth - Native, outside of US (%) - Hispanic or Latino
Place of birth - Native, outside of US (%) - American Indian and Alaska Native
Place of birth - Native, outside of US (%) - Multirace
Place of birth - Native, outside of US (%) - Other Race
Place of birth - Foreign born (%)
Place of birth - Foreign born (%) - White
Place of birth - Foreign born (%) - Black or African American
Place of birth - Foreign born (%) - Asian
Place of birth - Foreign born (%) - Hispanic or Latino
Place of birth - Foreign born (%) - American Indian and Alaska Native
Place of birth - Foreign born (%) - Multirace
Place of birth - Foreign born (%) - Other Race
Residents speaking English at home (%)
Residents speaking English at home - Born in the United States (%)
Residents speaking English at home - Native, born elsewhere (%)
Residents speaking English at home - Foreign born (%)
Residents speaking Spanish at home (%)
Residents speaking Spanish at home - Born in the United States (%)
Residents speaking Spanish at home - Native, born elsewhere (%)
Residents speaking Spanish at home - Foreign born (%)
Residents speaking other language at home (%)
Residents speaking other language at home - Born in the United States (%)
Residents speaking other language at home - Native, born elsewhere (%)
Residents speaking other language at home - Foreign born (%)
Marital status - Never married (%)
Marital status - Now married (%)
Marital status - Separated (%)
Marital status - Widowed (%)
Marital status - Divorced (%)
Ancestries Reported - Arab (%)
Ancestries Reported - Czech (%)
Ancestries Reported - Danish (%)
Ancestries Reported - Dutch (%)
Ancestries Reported - English (%)
Ancestries Reported - French (%)
Ancestries Reported - French Canadian (%)
Ancestries Reported - German (%)
Ancestries Reported - Greek (%)
Ancestries Reported - Hungarian (%)
Ancestries Reported - Irish (%)
Ancestries Reported - Italian (%)
Ancestries Reported - Lithuanian (%)
Ancestries Reported - Norwegian (%)
Ancestries Reported - Polish (%)
Ancestries Reported - Portuguese (%)
Ancestries Reported - Russian (%)
Ancestries Reported - Scotch-Irish (%)
Ancestries Reported - Scottish (%)
Ancestries Reported - Slovak (%)
Ancestries Reported - Subsaharan African (%)
Ancestries Reported - Swedish (%)
Ancestries Reported - Swiss (%)
Ancestries Reported - Ukrainian (%)
Ancestries Reported - United States (%)
Ancestries Reported - Welsh (%)
Ancestries Reported - West Indian (%)
Ancestries Reported - Other (%)
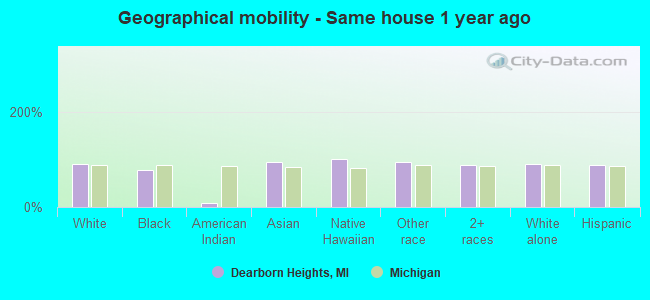
Geographical mobility - Same house 1 year ago (%)
Geographical mobility - Same house 1 year ago (%) - White
Geographical mobility - Same house 1 year ago (%) - Black or African American
Geographical mobility - Same house 1 year ago (%) - Asian
Geographical mobility - Same house 1 year ago (%) - Hispanic or Latino
Geographical mobility - Same house 1 year ago (%) - American Indian and Alaska Native
Geographical mobility - Same house 1 year ago (%) - Multirace
Geographical mobility - Same house 1 year ago (%) - Other Race
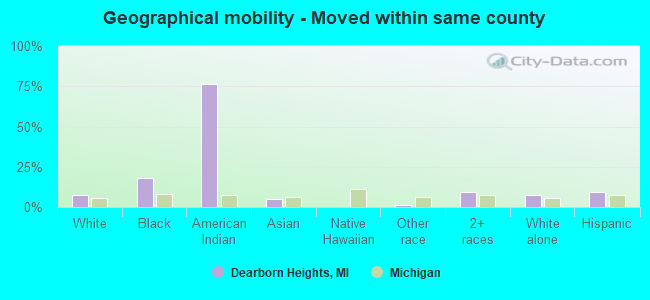
Geographical mobility - Moved within same county (%)
Geographical mobility - Moved within same county (%) - White
Geographical mobility - Moved within same county (%) - Black or African American
Geographical mobility - Moved within same county (%) - Asian
Geographical mobility - Moved within same county (%) - Hispanic or Latino
Geographical mobility - Moved within same county (%) - American Indian and Alaska Native
Geographical mobility - Moved within same county (%) - Multirace
Geographical mobility - Moved within same county (%) - Other Race
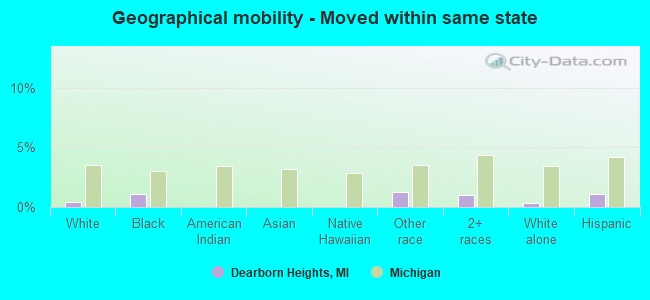
Geographical mobility - Moved from different county within same state (%)
Geographical mobility - Moved from different county within same state (%) - White
Geographical mobility - Moved from different county within same state (%) - Black or African American
Geographical mobility - Moved from different county within same state (%) - Asian
Geographical mobility - Moved from different county within same state (%) - Hispanic or Latino
Geographical mobility - Moved from different county within same state (%) - American Indian and Alaska Native
Geographical mobility - Moved from different county within same state (%) - Multirace
Geographical mobility - Moved from different county within same state (%) - Other Race
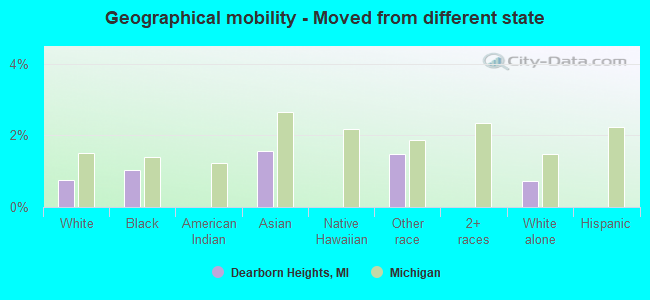
Geographical mobility - Moved from different state (%)
Geographical mobility - Moved from different state (%) - White
Geographical mobility - Moved from different state (%) - Black or African American
Geographical mobility - Moved from different state (%) - Asian
Geographical mobility - Moved from different state (%) - Hispanic or Latino
Geographical mobility - Moved from different state (%) - American Indian and Alaska Native
Geographical mobility - Moved from different state (%) - Multirace
Geographical mobility - Moved from different state (%) - Other Race
Geographical mobility - Moved from abroad (%)
Geographical mobility - Moved from abroad (%) - White
Geographical mobility - Moved from abroad (%) - Black or African American
Geographical mobility - Moved from abroad (%) - Asian
Geographical mobility - Moved from abroad (%) - Hispanic or Latino
Geographical mobility - Moved from abroad (%) - American Indian and Alaska Native
Geographical mobility - Moved from abroad (%) - Multirace
Geographical mobility - Moved from abroad (%) - Other Race
Place of birth for the foreign-born population - Ireland (%)
Place of birth for the foreign-born population - Denmark (%)
Place of birth for the foreign-born population - Norway (%)
Place of birth for the foreign-born population - Sweden (%)
Place of birth for the foreign-born population - United Kingdom (%)
Place of birth for the foreign-born population - England (%)
Place of birth for the foreign-born population - Scotland (%)
Place of birth for the foreign-born population - Other Northern Europe (%)
Place of birth for the foreign-born population - Austria (%)
Place of birth for the foreign-born population - Belgium (%)
Place of birth for the foreign-born population - France (%)
Place of birth for the foreign-born population - Germany (%)
Place of birth for the foreign-born population - Netherlands (%)
Place of birth for the foreign-born population - Switzerland (%)
Place of birth for the foreign-born population - Other Western Europe (%)
Place of birth for the foreign-born population - Greece (%)
Place of birth for the foreign-born population - Italy (%)
Place of birth for the foreign-born population - Portugal (%)
Place of birth for the foreign-born population - Spain (%)
Place of birth for the foreign-born population - Other Southern Europe (%)
Place of birth for the foreign-born population - Albania (%)
Place of birth for the foreign-born population - Belarus (%)
Place of birth for the foreign-born population - Bosnia and Herzegovina (%)
Place of birth for the foreign-born population - Bulgaria (%)
Place of birth for the foreign-born population - Croatia (%)
Place of birth for the foreign-born population - Czechoslovakia (%)
Place of birth for the foreign-born population - Hungary (%)
Place of birth for the foreign-born population - Latvia (%)
Place of birth for the foreign-born population - Lithuania (%)
Place of birth for the foreign-born population - North Macedonia (Macedonia) (%)
Place of birth for the foreign-born population - Moldova (%)
Place of birth for the foreign-born population - Poland (%)
Place of birth for the foreign-born population - Romania (%)
Place of birth for the foreign-born population - Russia (%)
Place of birth for the foreign-born population - Serbia (%)
Place of birth for the foreign-born population - Ukraine (%)
Place of birth for the foreign-born population - Other Eastern Europe (%)
Place of birth for the foreign-born population - China (%)
Place of birth for the foreign-born population - Hong Kong (%)
Place of birth for the foreign-born population - Taiwan (%)
Place of birth for the foreign-born population - Japan (%)
Place of birth for the foreign-born population - Korea (%)
Place of birth for the foreign-born population - Other Eastern Asia (%)
Place of birth for the foreign-born population - Afghanistan (%)
Place of birth for the foreign-born population - Bangladesh (%)
Place of birth for the foreign-born population - India (%)
Place of birth for the foreign-born population - Iran (%)
Place of birth for the foreign-born population - Kazakhstan (%)
Place of birth for the foreign-born population - Nepal (%)
Place of birth for the foreign-born population - Pakistan (%)
Place of birth for the foreign-born population - Sri Lanka (%)
Place of birth for the foreign-born population - Uzbekistan (%)
Place of birth for the foreign-born population - Other South Central Asia (%)
Place of birth for the foreign-born population - Burma (%)
Place of birth for the foreign-born population - Cambodia (%)
Place of birth for the foreign-born population - Indonesia (%)
Place of birth for the foreign-born population - Laos (%)
Place of birth for the foreign-born population - Malaysia (%)
Place of birth for the foreign-born population - Philippines (%)
Place of birth for the foreign-born population - Singapore (%)
Place of birth for the foreign-born population - Thailand (%)
Place of birth for the foreign-born population - Vietnam (%)
Place of birth for the foreign-born population - Other South Eastern Asia (%)
Place of birth for the foreign-born population - Armenia (%)
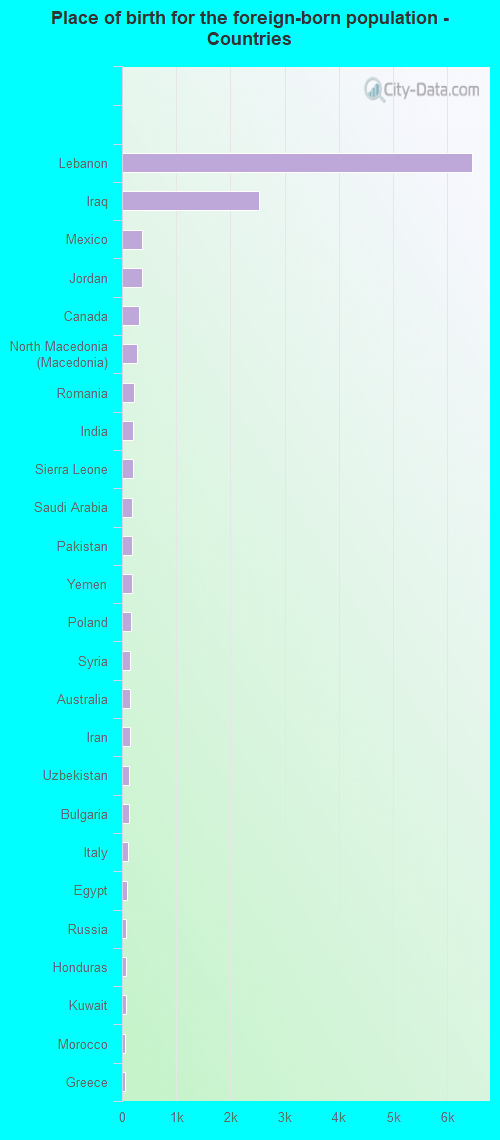
Place of birth for the foreign-born population - Iraq (%)
Place of birth for the foreign-born population - Israel (%)
Place of birth for the foreign-born population - Jordan (%)
Place of birth for the foreign-born population - Kuwait (%)
Place of birth for the foreign-born population - Lebanon (%)
Place of birth for the foreign-born population - Saudi Arabia (%)
Place of birth for the foreign-born population - Syria (%)
Place of birth for the foreign-born population - Turkey (%)
Place of birth for the foreign-born population - Yemen (%)
Place of birth for the foreign-born population - Other Western Asia (%)
Place of birth for the foreign-born population - Eritrea (%)
Place of birth for the foreign-born population - Ethiopia (%)
Place of birth for the foreign-born population - Kenya (%)
Place of birth for the foreign-born population - Somalia (%)
Place of birth for the foreign-born population - Uganda (%)
Place of birth for the foreign-born population - Zimbabwe (%)
Place of birth for the foreign-born population - Other Eastern Africa (%)
Place of birth for the foreign-born population - Cameroon (%)
Place of birth for the foreign-born population - Congo (%)
Place of birth for the foreign-born population - Democratic Republic of Congo (Zaire) (%)
Place of birth for the foreign-born population - Other Middle Africa (%)
Place of birth for the foreign-born population - Egypt (%)
Place of birth for the foreign-born population - Morocco (%)
Place of birth for the foreign-born population - Sudan (%)
Place of birth for the foreign-born population - Other Northern Africa (%)
Place of birth for the foreign-born population - South Africa (%)
Place of birth for the foreign-born population - Other Southern Africa (%)
Place of birth for the foreign-born population - Cabo Verde (%)
Place of birth for the foreign-born population - Ghana (%)
Place of birth for the foreign-born population - Liberia (%)
Place of birth for the foreign-born population - Nigeria (%)
Place of birth for the foreign-born population - Senegal (%)
Place of birth for the foreign-born population - Sierra Leone (%)
Place of birth for the foreign-born population - Other Western Africa (%)
Place of birth for the foreign-born population - Australia (%)
Place of birth for the foreign-born population - New Zealand (%)
Place of birth for the foreign-born population - Fiji (%)
Place of birth for the foreign-born population - Micronesia (%)
Place of birth for the foreign-born population - Bahamas (%)
Place of birth for the foreign-born population - Barbados (%)
Place of birth for the foreign-born population - Cuba (%)
Place of birth for the foreign-born population - Dominica (%)
Place of birth for the foreign-born population - Dominican Republic (%)
Place of birth for the foreign-born population - Grenada (%)
Place of birth for the foreign-born population - Haiti (%)
Place of birth for the foreign-born population - Jamaica (%)
Place of birth for the foreign-born population - St. Vincent and the Grenadines (%)
Place of birth for the foreign-born population - Trinidad and Tobago (%)
Place of birth for the foreign-born population - West Indies (%)
Place of birth for the foreign-born population - Other Caribbean (%)
Place of birth for the foreign-born population - Belize (%)
Place of birth for the foreign-born population - Costa Rica (%)
Place of birth for the foreign-born population - El Salvador (%)
Place of birth for the foreign-born population - Guatemala (%)
Place of birth for the foreign-born population - Honduras (%)
Place of birth for the foreign-born population - Mexico (%)
Place of birth for the foreign-born population - Nicaragua (%)
Place of birth for the foreign-born population - Panama (%)
Place of birth for the foreign-born population - Other Central America (%)
Place of birth for the foreign-born population - Argentina (%)
Place of birth for the foreign-born population - Bolivia (%)
Place of birth for the foreign-born population - Brazil (%)
Place of birth for the foreign-born population - Chile (%)
Place of birth for the foreign-born population - Colombia (%)
Place of birth for the foreign-born population - Ecuador (%)
Place of birth for the foreign-born population - Guyana (%)
Place of birth for the foreign-born population - Peru (%)
Place of birth for the foreign-born population - Uruguay (%)
Place of birth for the foreign-born population - Venezuela (%)
Place of birth for the foreign-born population - Other South America (%)
Place of birth for the foreign-born population - Canada (%)
Place of birth for the foreign-born population - Other Northern America (%)
Place of birth for the foreign-born population - Other (%)
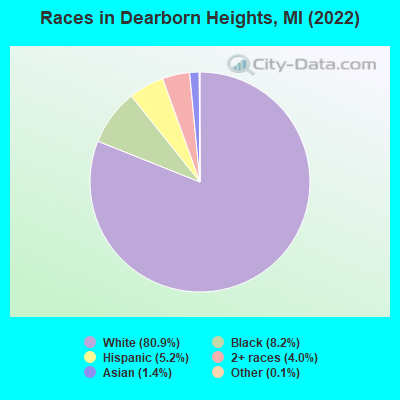
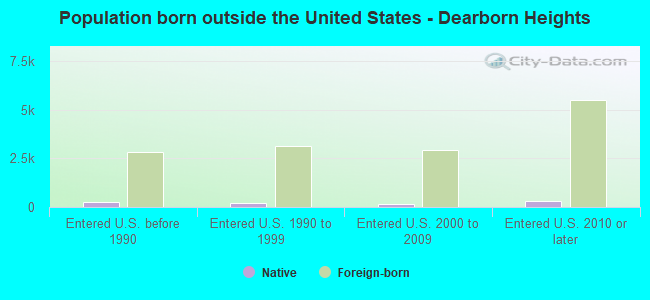
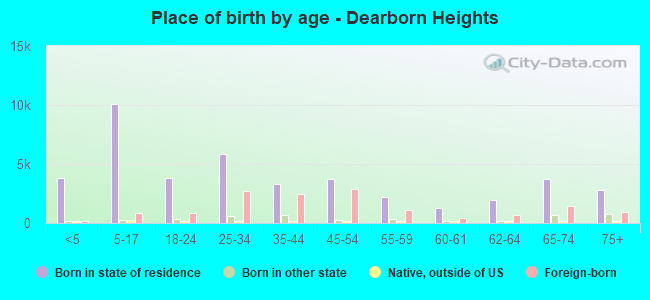
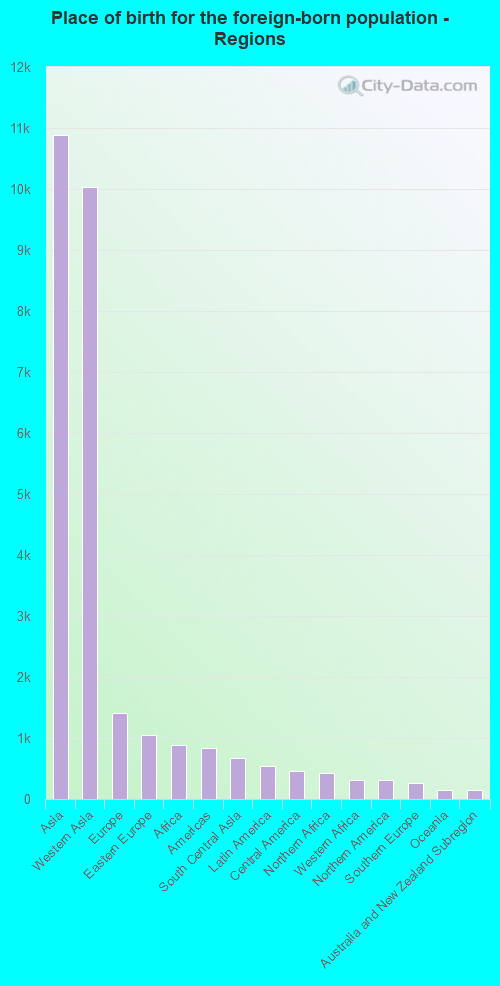
According to 2022 data, the most numerous races in Dearborn Heights, MI are White alone (49,857 residents), Black alone (5,049 residents), and Hispanic (3,188 residents). 59.9% of Dearborn Heights residents speak English at home. 23.0% of Dearborn Heights, MI residents are foreign-born (17.4% born in Asia), which is 73.9% greater than the foreign-born rate of 6.0% across the entire state of Michigan.
Race distribution in Dearborn Heights
2000 2022
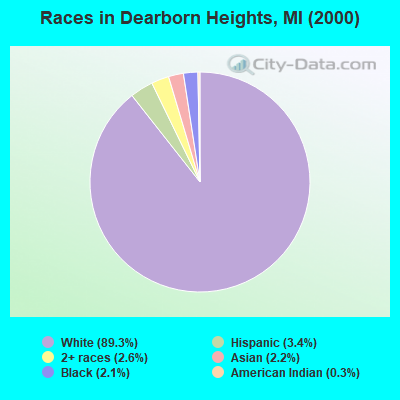
7,806,691 78.6% White alone 1,402,047 14.1% Black alone 323,877 3.3% Hispanic 175,311 1.8% Asian alone 163,487 1.6% Two or more races 53,421 0.5% American Indian alone 11,465 0.1% Other race alone 2,145 0.02% Native Hawaiian and Other
7,289,051 72.6% White alone 1,310,464 13.1% Black alone 572,405 5.7% Hispanic 450,031 4.5% Two or more races 335,732 3.3% Asian alone 45,217 0.5% Other race alone 29,011 0.3% American Indian alone 2,207 0.02% Native Hawaiian and Other
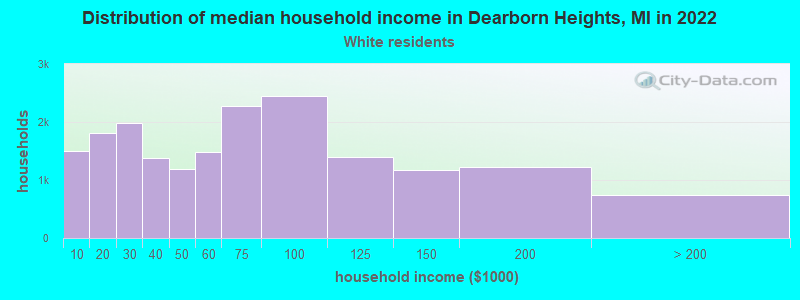
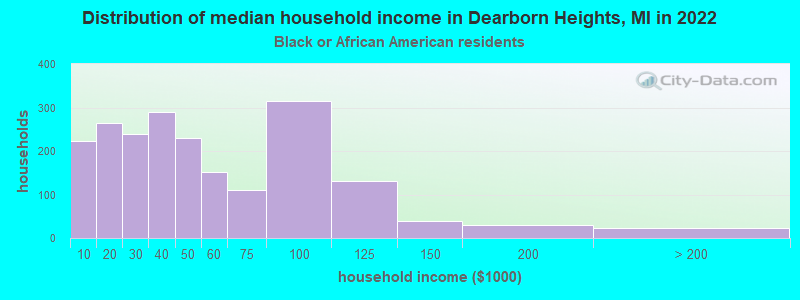
Income and house value in Dearborn Heights Median household income in 2022 $59,178 White non-Hispanic householders$39,768 Black householders$63,451 Asian householders$52,351 Two or more races householders$53,750 Hispanic or Latino race householdersMedian 2022 house value $176,344 White Non-Hispanic householders$200,027 Black or African American householders$195,706 American Indian or Alaska Native householders $217,469 Asian householders$173,143 Some other race householders$220,830 Two or more races householders$174,744 Hispanic or Latino householders
Median age by race in Dearborn Heights
37.3 Median age for White residents37.3 37.3 37.5 Median age for Black or African American residents34.5 40.5 34.1 Median age for American Indian / Alaska Native residents-795,074,757.3 31.8 40.5 Median age for Asian residents34.4 42.4 -934,108,526.2 Median age for Native Hawaiian / Pacific Islander residents-674,772,035.8 -699,588,476.7 42.2 Median age for Other race residents43.5 32.9 24.9 Median age for Two or more races residents20.0 25.9 37.1 Median age for White alone residents37.3 37.2 35.5 Median age for Hispanic or Latino residents28.4 38.0
Owner/renter occupied households by race in Dearborn Heights
House owners and renters - White residents 14,538 78.8% Owner occupied3,916 21.2% Renter occupiedHouse owners and renters - Black or African American residents 541 26.6% Owner occupied1,492 73.4% Renter occupiedHouse owners and renters - American Indian / Alaska Native residents 34 100.0% Owner occupiedHouse owners and renters - Asian residents 189 44.3% Owner occupied238 55.7% Renter occupiedHouse owners and renters - Native Hawaiian / Pacific Islander residents 4 51.3% Owner occupied4 48.7% Renter occupiedHouse owners and renters - Other race residents 89 60.1% Owner occupied59 39.9% Renter occupiedHouse owners and renters - Two or more races residents 765 74.8% Owner occupied257 25.2% Renter occupiedHouse owners and renters - White alone residents 14,430 78.9% Owner occupied3,867 21.1% Renter occupiedHouse owners and renters - Hispanic or Latino residents 621 67.2% Owner occupied303 32.8% Renter occupied
Language usage in Dearborn Heights
English speakers - Total 59.9% of residents of Dearborn Heights speak English at home.
2.7% of residents speak Spanish at home 811 52.6% Speak English very well730 47.4% Speak English less than very well37.2% of residents speak other language at home 12,356 57.6% Speak English very well9,078 42.4% Speak English less than very well
English speakers - Born in the United States 81.4% of residents of Dearborn Heights speak English at home.
2.8% of residents speak Spanish at home 112 100.0% Speak English very well15.1% of residents speak other language at home 534 88.9% Speak English very well67 11.1% Speak English less than very well
English speakers - Native, born elsewhere 41.9% of residents of Dearborn Heights speak English at home.
30.1% of residents speak Spanish at home 14 5.1% Speak English very well260 94.9% Speak English less than very well33.2% of residents speak other language at home 270 89.4% Speak English very well32 10.6% Speak English less than very well
English speakers - Foreign-born 6.7% of residents of Dearborn Heights speak English at home.
4.0% of residents speak Spanish at home 301 52.5% Speak English very well272 47.5% Speak English less than very well91.6% of residents speak other language at home 5,057 38.1% Speak English very well8,210 61.9% Speak English less than very well
White (Caucasian) - Speak only English Native:
75.3% (25,920)Foreign-born:
6.3% (814)
White (Caucasian) - Speak another language Native:
22.2% (7,625)Foreign-born:
93.6% (12,137)
Black or African American - Speak only English Native:
100.0% (4,714)Foreign-born:
88.9% (63)
Black or African American - Speak another language Native:
0.0% (2)Foreign-born:
14.6% (10)
Asian - Speak only English Native:
65.1% (76)Foreign-born:
4.6% (32)
Asian - Speak another language Native:
32.4% (38)Foreign-born:
94.0% (652)
Other race - Speak only English Native:
33.5% (175)Foreign-born:
23.2% (33)
Other race - Speak another language Native:
67.2% (350)Foreign-born:
67.2% (96)
Two or more races - Speak only English Native:
75.3% (2,507)Foreign-born:
3.2% (19)
Two or more races - Speak another language Native:
25.8% (859)Foreign-born:
99.0% (588)
White alone - Speak only English Native:
75.0% (25,586)Foreign-born:
6.1% (830)
White alone - Speak another language Native:
23.4% (7,970)Foreign-born:
94.2% (12,777)
Hispanic or Latino - Speak only English Native:
56.9% (1,288)Foreign-born:
6.0% (39)
Hispanic or Latino - Speak another language Native:
43.0% (975)Foreign-born:
94.0% (607)
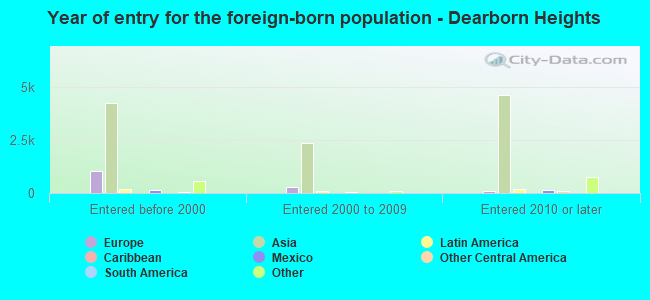
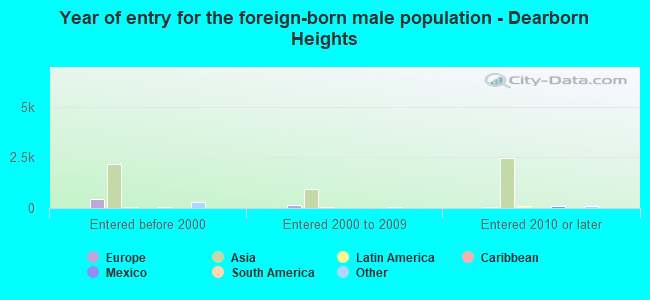
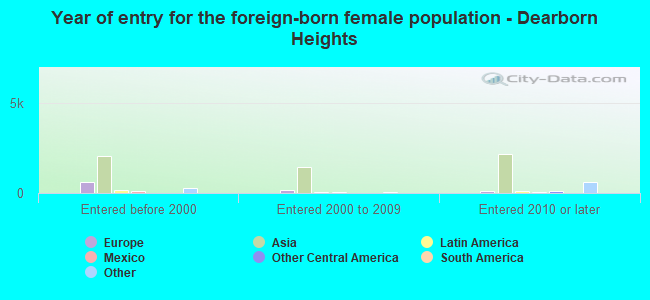
Foreign-born residents in Dearborn Heights 14,175 residents are foreign born (17.4% Asia ).
This city:
23.0%Michigan:
6.9%
Marital status for residents in Dearborn Heights Marital status - White (Caucasian) population 15 years and over
Males 37.9% Never married49.4% Now married1.2% Separated2.5% Widowed8.9% DivorcedFemales 27.4% Never married48.7% Now married1.1% Separated10.4% Widowed12.4% DivorcedWomen who gave birth in the past 12 months Now married:
81.1% (623)Unmarried:
18.9% (145)
Women who did not give birth in the past 12 months Now married:
46.2% (4,781)Unmarried:
53.8% (5,578)
Marital status - Black or African American population 15 years and over
Males 51.6% Never married27.7% Now married7.8% Separated0.5% Widowed12.4% DivorcedFemales 55.0% Never married18.7% Now married1.3% Separated6.7% Widowed18.4% DivorcedWomen who gave birth in the past 12 months Now married:
100.0% (39)Unmarried:
0.0% (0)
Women who did not give birth in the past 12 months Now married:
23.3% (331)Unmarried:
76.7% (1,090)
Marital status - American Indian / Alaska Native population 15 years and over
Males 89.5% Never married10.5% Now married0.0% Separated0.0% Widowed0.0% DivorcedFemales 50.7% Never married7.0% Now married0.0% Separated0.0% Widowed42.3% DivorcedWomen who did not give birth in the past 12 months Now married:
0.0% (0)Unmarried:
100.0% (68)
Marital status - Asian population 15 years and over
Males 1.8% Never married90.5% Now married1.6% Separated6.0% Widowed0.0% DivorcedFemales 17.2% Never married71.1% Now married3.3% Separated8.3% Widowed0.0% DivorcedWomen who did not give birth in the past 12 months Now married:
65.6% (115)Unmarried:
34.4% (60)
Marital status - Native Hawaiian / Pacific Islander population 15 years and over
Males 0.0% Never married100.0% Now married0.0% Separated0.0% Widowed0.0% DivorcedFemales 100.0% Never married0.0% Now married0.0% Separated0.0% Widowed0.0% DivorcedMarital status - Other race population 15 years and over
Males 25.4% Never married43.1% Now married0.0% Separated0.4% Widowed31.0% DivorcedFemales 33.2% Never married60.6% Now married2.2% Separated0.0% Widowed4.0% DivorcedWomen who gave birth in the past 12 months Now married:
100.0% (10)Unmarried:
0.0% (0)
Women who did not give birth in the past 12 months Now married:
57.4% (201)Unmarried:
42.6% (149)
Marital status - Two or more races population 15 years and over
Males 51.4% Never married44.8% Now married0.0% Separated1.3% Widowed2.4% DivorcedFemales 47.8% Never married35.2% Now married0.4% Separated13.0% Widowed3.5% DivorcedWomen who did not give birth in the past 12 months Now married:
33.2% (385)Unmarried:
66.8% (775)
Marital status - White alone, not Hispanic / Latino population 15 years and over
Males 37.4% Never married50.0% Now married1.3% Separated2.4% Widowed8.9% DivorcedFemales 27.5% Never married49.2% Now married1.1% Separated10.2% Widowed11.9% DivorcedWomen who gave birth in the past 12 months Now married:
81.1% (636)Unmarried:
18.9% (148)
Women who did not give birth in the past 12 months Now married:
46.3% (4,799)Unmarried:
53.7% (5,564)
Marital status - Hispanic or Latino population 15 years and over
Males 48.7% Never married32.9% Now married0.0% Separated4.7% Widowed13.8% DivorcedFemales 38.6% Never married39.3% Now married0.5% Separated8.9% Widowed12.7% DivorcedWomen who did not give birth in the past 12 months Now married:
39.8% (485)Unmarried:
60.2% (732)
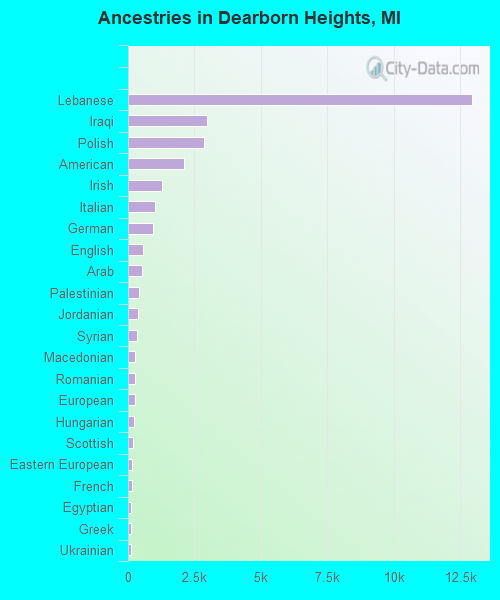
Ancestries in Dearborn Heights
12,934 35.9% Lebanese2,968 8.2% Iraqi2,856 7.9% Polish2,110 5.9% American1,269 3.5% Irish1,006 2.8% Italian952 2.6% German547 1.5% English537 1.5% Arab418 1.2% Palestinian375 1.0% Jordanian351 1.0% Syrian276 0.8% Macedonian275 0.8% Romanian249 0.7% European229 0.6% Hungarian171 0.5% Scottish146 0.4% Eastern European132 0.4% French127 0.4% Egyptian120 0.3% Greek119 0.3% Ukrainian115 0.3% Scotch-Irish115 0.3% Lithuanian109 0.3% Albanian108 0.3% African105 0.3% Yugoslavian91 0.3% Bulgarian88 0.2% Finnish79 0.2% Moroccan76 0.2% Armenian68 0.2% French Canadian61 0.2% Iranian50 0.1% Maltese34 0.09% Canadian33 0.09% Assyrian32 0.09% Russian31 0.09% Sierra Leonean29 0.08% Serbian27 0.07% Dutch24 0.07% Slovene24 0.07% Nigerian23 0.06% Czech21 0.06% Slovak18 0.05% Norwegian18 0.05% West Indian18 0.05% Liberian17 0.05% Scandinavian14 0.04% British12 0.03% Austrian6 0.02% Ethiopian3 0.01% Belgian
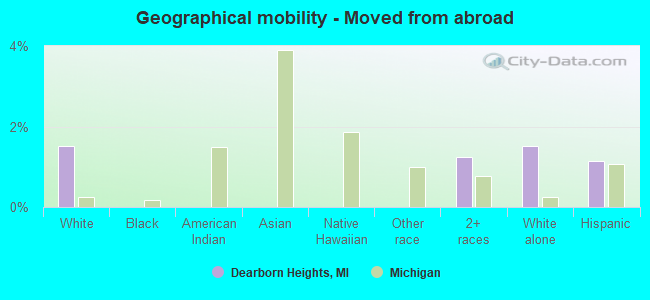
Geographical mobility in Dearborn Heights Same house 1 year ago 44,318 89.9% White (Caucasian)3,995 78.1% Black or African American7 8.0% American Indian / Alaska Native830 95.5% Asian12 100.0% Native Hawaiian / Pacific Islander624 93.8% Other race3,782 87.4% Two or more races44,085 89.9% White alone, not Hispanic / Latino2,778 86.8% Hispanic or LatinoMoved within same county 3,530 7.2% White / Caucasian937 18.3% Black or African American70 76.4% American Indian / Alaska Native43 5.0% Asian9 1.4% Other race408 9.4% Two or more races3,611 7.4% White alone, not Hispanic / Latino304 9.5% Hispanic or LatinoMoved within same state 203 0.4% White / Caucasian55 1.1% Black or African American8 1.2% Other race42 1.0% Two or more races184 0.4% White alone, not Hispanic / Latino36 1.1% Hispanic or LatinoMoved from different state 365 0.7% White / Caucasian54 1.0% Black or African American14 1.6% Asian10 1.5% Other race362 0.7% White alone, not Hispanic / LatinoMoved from abroad 744 1.5% White54 1.2% Two or more races738 1.5% White alone, not Hispanic / Latino36 1.1% Hispanic or Latino
Children Nativity (place of birth) in Dearborn Heights
Children under 6 years - Living with two parents Both parents native 1,287 100.0% NativeBoth parents foreign-born 1,713 93.3% Native123 6.7% Foreign-bornOne native, one foreign-born parent 1,250 100.0% NativeChildren under 6 years - Living with one parent Native parent 782 100.0% NativeForeign-born parent 97 78.4% Native27 21.6% Foreign-bornChildren 6 to 17 years - Living with two parents Both parents native 2,309 99.0% Native24 1.0% Foreign-bornBoth parents foreign-born 3,059 85.0% Native540 15.0% Foreign-bornOne native, one foreign-born parent 1,304 100.0% NativeChildren 6 to 17 years - Living with one parent Native parent 1,466 100.0% NativeForeign-born parent 779 54.2% Native659 45.8% Foreign-born
Grandparents responsible for own grandchildren in Dearborn Heights
Grandparents (30 to 59 years) White / Caucasian 75 34.9% Responsible for grandchildren139 65.1% Not responsible for grandchildrenBlack or African American 23 49.2% Responsible for grandchildren24 50.8% Not responsible for grandchildrenTwo or more races 170 100.0% Not responsible for grandchildrenWhite alone, not Hispanic / Latino 75 33.6% Responsible for grandchildren147 66.4% Not responsible for grandchildrenHispanic or Latino 192 100.0% Not responsible for grandchildrenGrandparents (60 years and over) White / Caucasian 105 23.7% Responsible for grandchildren339 76.3% Not responsible for grandchildrenBlack or African American 67 100.0% Not responsible for grandchildrenTwo or more races 65 92.1% Responsible for grandchildren6 7.9% Not responsible for grandchildrenWhite alone, not Hispanic / Latino 98 23.1% Responsible for grandchildren327 76.9% Not responsible for grandchildrenHispanic or Latino 38 100.0% Not responsible for grandchildren