Races in East Peoria, Illinois (IL) Detailed Stats
Ancestries, Foreign-born residents, place of birth
Settings
X


Recent posts about races in East Peoria, Illinois on our local forum with over 2,400,000 registered users:
 | Moving to IL - is there any future? (214 replies) |
| Washington/Germantown Hills/Chillicothe/Dunlap (5 replies) |
| Peoria/Chicago—where to live in between? (21 replies) |
| Peoria, IL - Housing options (9 replies) |
| Peoria Schools (2 replies) |
| What to see, Champaign/Urbana, Bloomington/Normal, Peoria, Rockford, Moline/Davenport (1 reply) |
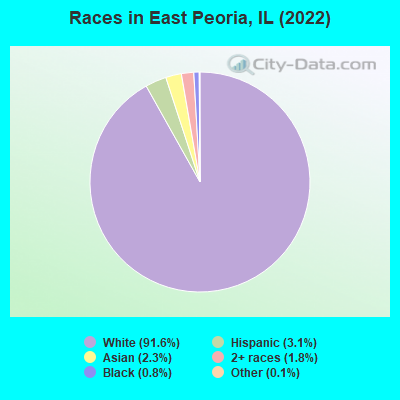
According to 2022 data, the most numerous races in East Peoria, IL are White alone (20,434 residents), Hispanic (681 residents), and Black alone (175 residents). 96.2% of East Peoria residents speak English at home. 2.1% of East Peoria, IL residents are foreign-born (1.3% born in Asia, 0.3% born in Europe, 0.3% born in Latin America), which is 582.2% less than the foreign-born rate of 14.0% across the entire state of Illinois.
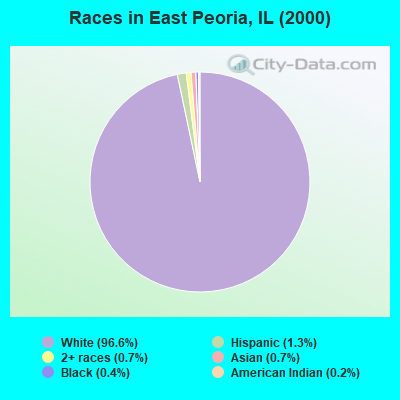
Race distribution in East Peoria
2000
2022

- 21,86796.6%White alone
- 2931.3%Hispanic
- 1480.7%Asian alone
- 1660.7%Two or more races
- 1010.4%Black alone
- 530.2%American Indian alone
- 90.04%Other race alone
-
- 20,43491.6%White alone
- 6813.1%Hispanic
- 5242.3%Asian alone
- 3931.8%Two or more races
- 1750.8%Black alone
- 290.1%Other race alone
- 100.04%American Indian alone
2000
2022
-
- 8,424,14067.8%White alone
- 1,856,15214.9%Black alone
- 1,530,26212.3%Hispanic
- 419,9163.4%Asian alone
- 153,9961.2%Two or more races
- 13,4790.1%Other race alone
- 18,2320.1%American Indian alone
- 3,1160.03%Native Hawaiian and Other
Pacific Islander alone

-
- 7,356,30158.5%White alone
- 2,299,72618.3%Hispanic
- 1,660,42313.2%Black alone
- 747,2965.9%Asian alone
- 458,5993.6%Two or more races
- 45,3860.4%Other race alone
- 10,4050.08%American Indian alone
- 3,8960.03%Native Hawaiian and Other
Pacific Islander alone

Income and house value in East Peoria
- Median household income in 2022
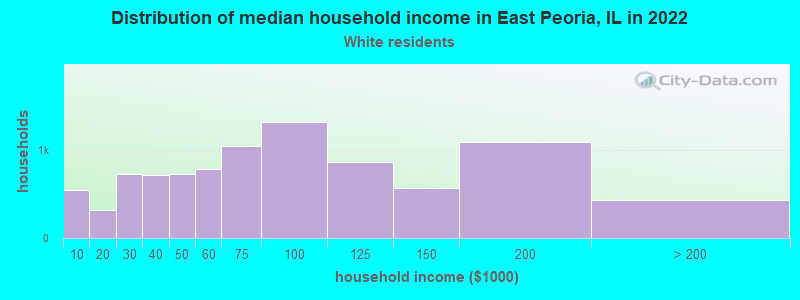
- $72,623White non-Hispanic householders
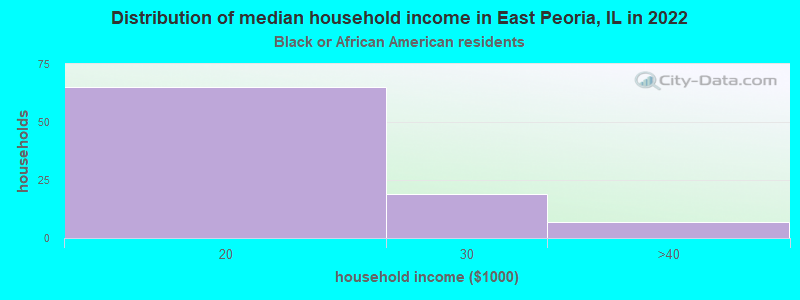
- $16,213Black householders
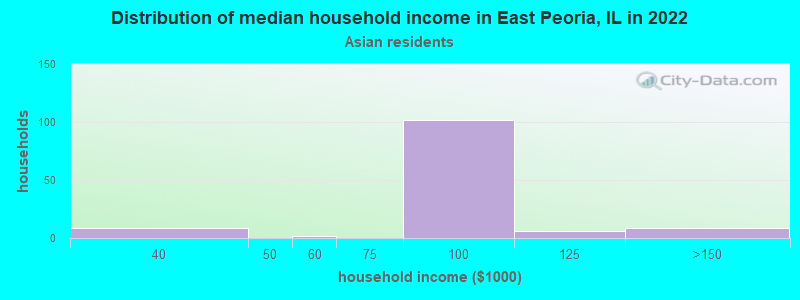
- $91,503Asian householders
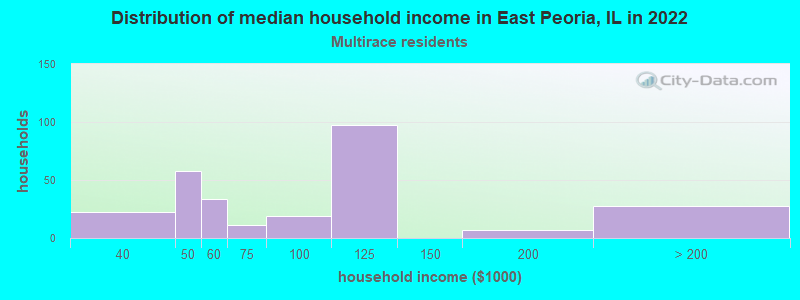
- $83,236Two or more races householders
- Median 2022 house value
- $158,126White Non-Hispanic householders
- $135,712Black or African American householders
- $188,246Asian householders
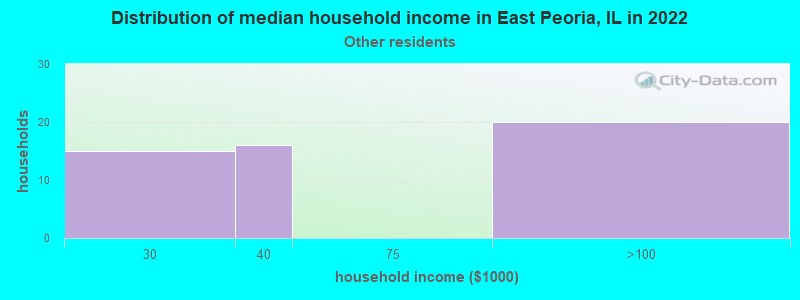
- $83,879Some other race householders
- $84,929Two or more races householders
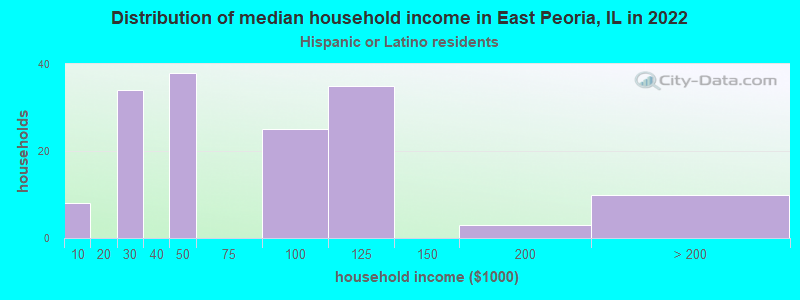
- $128,357Hispanic or Latino householders
Household income for White non-Hispanic householders
Household income for Black householders
Household income for Asian householders
Household income for Some other race householders
Household income for Two or more races householders
Household income for Hispanic or Latino race householders
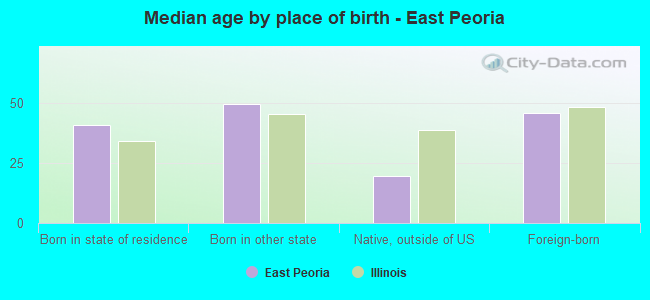
Median age by race in East Peoria
- 43.2Median age for White residents
- 42.0Males
- 44.5Females
- 35.0Median age for Black or African American residents
- 45.0Males
- 31.4Females
- -680,203,045.0Median age for American Indian / Alaska Native residents
- -574,574,574.0Males
- -688,956,432.9Females
- 36.0Median age for Asian residents
- 24.5Males
- 36.8Females
- -593,236,714.4Median age for Native Hawaiian / Pacific Islander residents
- -666,666,666.0Males
- -576,015,108.0Females
- 97.1Median age for Other race residents
- 62.4Males
- -785,365,852.9Females
- 16.4Median age for Two or more races residents
- 18.8Males
- 14.9Females
- 43.3Median age for White alone residents
- 41.9Males
- 45.3Females
- 29.6Median age for Hispanic or Latino residents
- 46.8Males
- 13.9Females
Owner/renter occupied households by race in East Peoria
- House owners and renters - White residents
- 7,29479.1%Owner occupied
- 1,92920.9%Renter occupied
- House owners and renters - Black or African American residents
- 92100.0%Renter occupied
- House owners and renters - American Indian / Alaska Native residents
- 9100.0%Renter occupied
- House owners and renters - Asian residents
- 134100.0%Owner occupied
- House owners and renters - Other race residents
- 2037.8%Owner occupied
- 3462.2%Renter occupied
- House owners and renters - Two or more races residents
- 25595.6%Owner occupied
- 124.4%Renter occupied
- House owners and renters - White alone residents
- 7,25679.2%Owner occupied
- 1,90720.8%Renter occupied
- House owners and renters - Hispanic or Latino residents
- 17188.4%Owner occupied
- 2211.6%Renter occupied
Language usage in East Peoria
- English speakers - Total
- 96.2% of residents of East Peoria speak English at home.
- 1.2% of residents speak Spanish at home
- 22386.8%Speak English very well
- 3413.2%Speak English less than very well
- 2.6% of residents speak other language at home
- 38068.7%Speak English very well
- 17331.3%Speak English less than very well
- English speakers - Born in the United States
- 93.8% of residents of East Peoria speak English at home.
- 1.6% of residents speak Spanish at home
- 3760.7%Speak English very well
- 2439.3%Speak English less than very well
- 2.2% of residents speak other language at home
- 85100.0%Speak English very well
- English speakers - Native, born elsewhere
- 29.6% of residents of East Peoria speak English at home.
- 25.4% of residents speak Spanish at home
- 36100.0%Speak English very well
- 9.9% of residents speak other language at home
- 14100.0%Speak English very well
- English speakers - Foreign-born
- 24.7% of residents of East Peoria speak English at home.
- 13.4% of residents speak Spanish at home
- 62100.0%Speak English very well
- 64.1% of residents speak other language at home
- 14147.6%Speak English very well
- 15552.4%Speak English less than very well
White (Caucasian) - Speak only English
| Native: | 98.7% (19,364) |
| Foreign-born: | 16.9% (15) |
White (Caucasian) - Speak another language
| Native: | 1.2% (241) |
| Foreign-born: | 84.0% (76) |
Black or African American - Speak only English
| Native: | 100.0% (163) |
| Foreign-born: | 100.0% (20) |
Asian - Speak only English
| Native: | 47.1% (104) |
| Foreign-born: | 21.0% (65) |
Asian - Speak another language
| Native: | 51.8% (114) |
| Foreign-born: | 78.7% (243) |
Two or more races - Speak another language
| Native: | 8.9% (59) |
| Foreign-born: | 100.0% (33) |
White alone - Speak only English
| Native: | 99.3% (19,187) |
| Foreign-born: | 26.6% (22) |
White alone - Speak another language
| Native: | 0.7% (140) |
| Foreign-born: | 72.9% (61) |
Hispanic or Latino - Speak another language
| Native: | 25.6% (160) |
| Foreign-born: | 100.0% (54) |
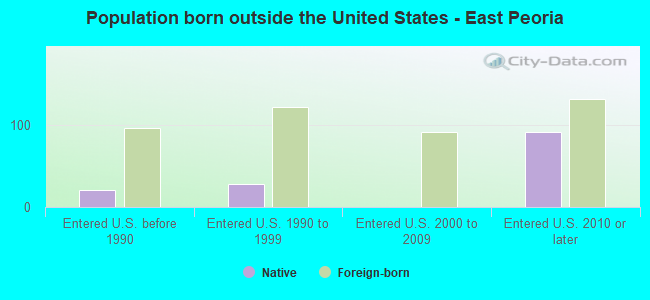
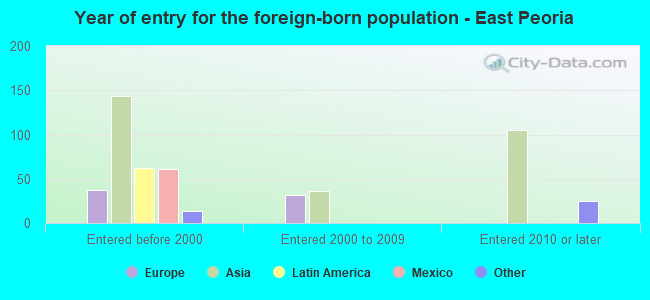
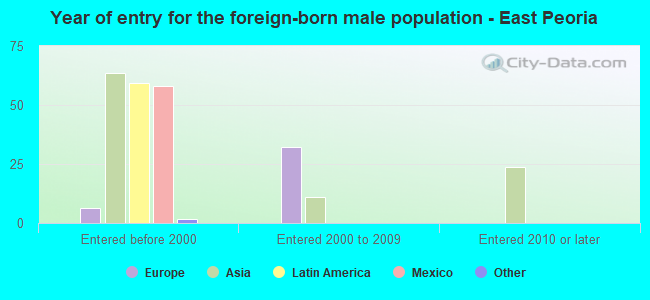
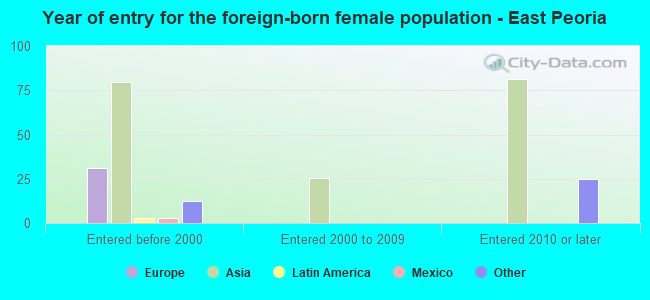
Foreign-born residents in East Peoria
458 residents are foreign born (1.3% Asia, 0.3% Europe, 0.3% Latin America).
| This city: | 2.1% |
| Illinois: | 14.1% |

Marital status for residents in East Peoria
Marital status - White (Caucasian) population 15 years and over
- Males
- 31.5%Never married
- 55.0%Now married
- 1.2%Separated
- 3.0%Widowed
- 9.3%Divorced
- Females
- 21.7%Never married
- 57.6%Now married
- 1.0%Separated
- 7.8%Widowed
- 11.8%Divorced
Women who gave birth in the past 12 months
| Now married: | 83.0% (148) |
| Unmarried: | 17.0% (30) |
Women who did not give birth in the past 12 months
| Now married: | 51.0% (2,094) |
| Unmarried: | 49.0% (2,015) |
Marital status - Black or African American population 15 years and over
- Males
- 76.0%Never married
- 6.0%Now married
- 0.0%Separated
- 0.0%Widowed
- 18.0%Divorced
- Females
- 65.5%Never married
- 0.0%Now married
- 0.0%Separated
- 34.5%Widowed
- 0.0%Divorced
Women who did not give birth in the past 12 months
| Now married: | 0.0% (0) |
| Unmarried: | 100.0% (88) |
Marital status - Asian population 15 years and over
- Males
- 35.0%Never married
- 65.0%Now married
- 0.0%Separated
- 0.0%Widowed
- 0.0%Divorced
- Females
- 30.0%Never married
- 65.4%Now married
- 0.0%Separated
- 4.6%Widowed
- 0.0%Divorced
Women who did not give birth in the past 12 months
| Now married: | 67.3% (135) |
| Unmarried: | 32.7% (66) |
Marital status - Other race population 15 years and over
- Males
- 31.0%Never married
- 13.8%Now married
- 0.0%Separated
- 0.0%Widowed
- 55.2%Divorced
- Females
- 0.0%Never married
- 0.0%Now married
- 53.8%Separated
- 46.2%Widowed
- 0.0%Divorced
Women who did not give birth in the past 12 months
| Now married: | 100.0% (16) |
| Unmarried: | 0.0% (0) |
Marital status - Two or more races population 15 years and over
- Males
- 58.3%Never married
- 41.7%Now married
- 0.0%Separated
- 0.0%Widowed
- 0.0%Divorced
- Females
- 22.4%Never married
- 62.9%Now married
- 0.0%Separated
- 9.1%Widowed
- 5.6%Divorced
Women who gave birth in the past 12 months
| Now married: | 100.0% (10) |
| Unmarried: | 0.0% (0) |
Women who did not give birth in the past 12 months
| Now married: | 63.6% (81) |
| Unmarried: | 36.4% (46) |
Marital status - White alone, not Hispanic / Latino population 15 years and over
- Males
- 31.3%Never married
- 55.2%Now married
- 1.2%Separated
- 2.9%Widowed
- 9.4%Divorced
- Females
- 21.5%Never married
- 57.6%Now married
- 1.0%Separated
- 7.9%Widowed
- 11.9%Divorced
Women who gave birth in the past 12 months
| Now married: | 83.0% (148) |
| Unmarried: | 17.0% (30) |
Women who did not give birth in the past 12 months
| Now married: | 50.9% (2,045) |
| Unmarried: | 49.1% (1,971) |
Marital status - Hispanic or Latino population 15 years and over
- Males
- 54.5%Never married
- 32.6%Now married
- 0.0%Separated
- 6.2%Widowed
- 6.6%Divorced
- Females
- 31.2%Never married
- 68.8%Now married
- 0.0%Separated
- 0.0%Widowed
- 0.0%Divorced
Women who did not give birth in the past 12 months
| Now married: | 66.9% (100) |
| Unmarried: | 33.1% (50) |
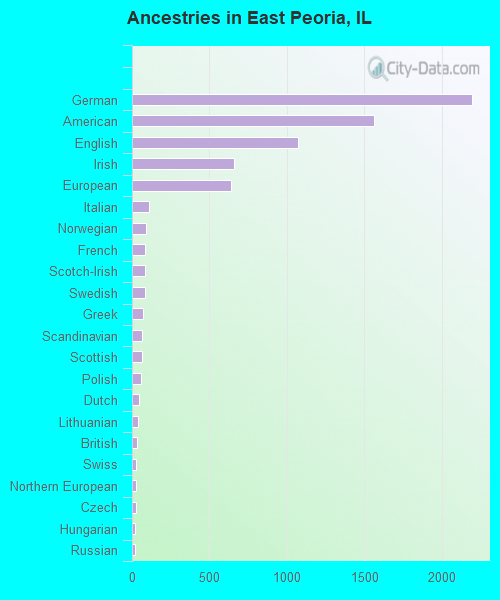
Ancestries in East Peoria

- 2,19725.2%German
- 1,56117.9%American
- 1,07212.3%English
- 6627.6%Irish
- 6397.3%European
- 1111.3%Italian
- 901.0%Norwegian
- 871.0%French
- 851.0%Scotch-Irish
- 841.0%Swedish
- 740.8%Greek
- 670.8%Scandinavian
- 620.7%Scottish
- 610.7%Polish
- 460.5%Dutch
- 380.4%Lithuanian
- 340.4%British
- 260.3%Swiss
- 240.3%Northern European
- 230.3%Czech
- 220.3%Hungarian
- 210.2%Russian
- 190.2%Belgian
- 150.2%Croatian
- 130.1%Danish
- 120.1%Welsh
- 100.1%Canadian
- 90.1%Eastern European
- 80.09%French Canadian
- 80.09%Slovene
- 80.09%Yugoslavian
- 60.07%Austrian
- 30.03%Nigerian
- 20.02%Slovak
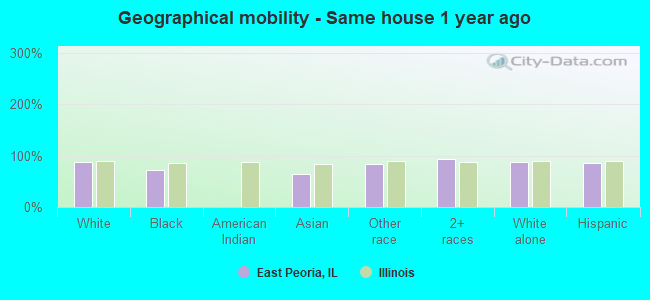
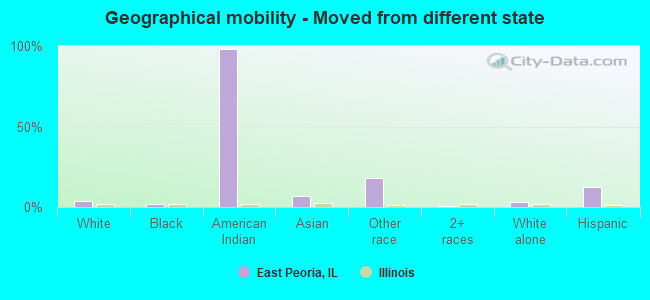
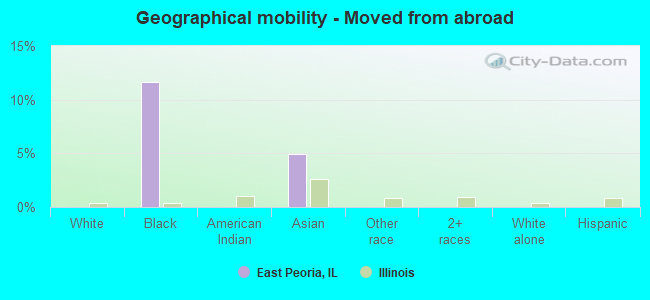
Geographical mobility in East Peoria

- Same house 1 year ago
- 18,12387.9%White (Caucasian)
- 14873.0%Black or African American
- 28463.8%Asian
- 5584.1%Other race
- 78293.4%Two or more races
- 17,88288.0%White alone, not Hispanic / Latino
- 56086.7%Hispanic or Latino
-
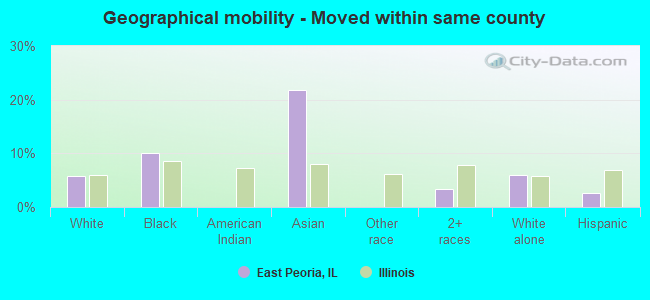
- Moved within same county
- 1,2085.9%White / Caucasian
- 2010.1%Black or African American
- 9721.8%Asian
- 293.4%Two or more races
- 1,2015.9%White alone, not Hispanic / Latino
- 172.6%Hispanic or Latino
-
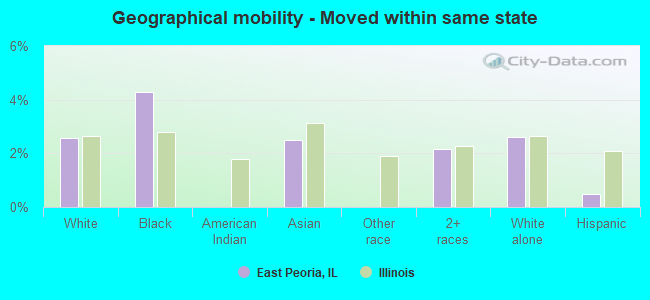
- Moved within same state
- 5322.6%White / Caucasian
- 94.3%Black or African American
- 112.5%Asian
- 182.2%Two or more races
- 5312.6%White alone, not Hispanic / Latino
- 30.5%Hispanic or Latino
-
- Moved from different state
- 7253.5%White / Caucasian
- 42.0%Black or African American
- 898.4%American Indian / Alaska Native
- 316.9%Asian
- 1218.1%Other race
- 50.6%Two or more races
- 6133.0%White alone, not Hispanic / Latino
- 8012.4%Hispanic or Latino
-
- Moved from abroad
- 2411.7%Black or African American
- 224.9%Asian
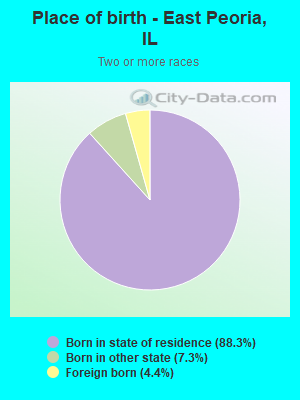
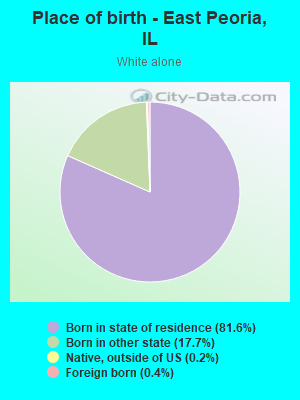
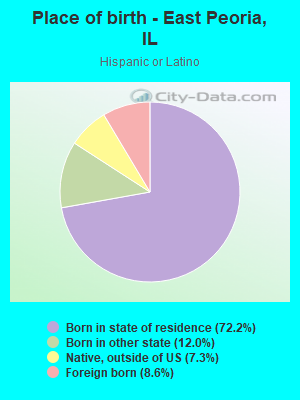
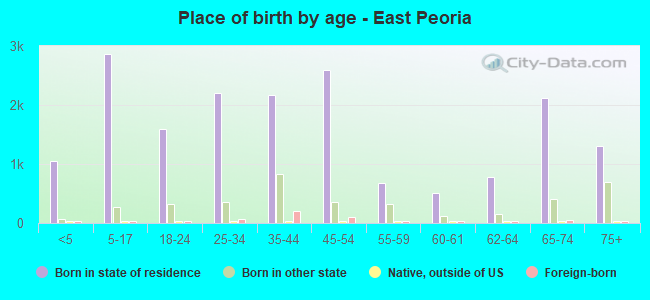
Children Nativity (place of birth) in East Peoria
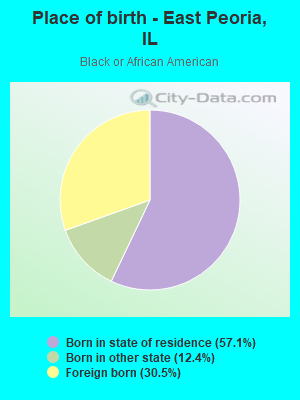
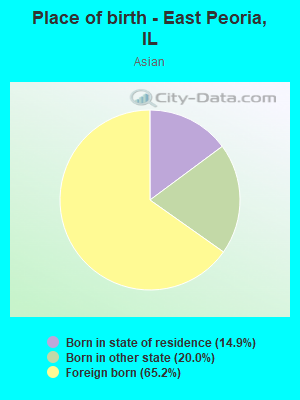
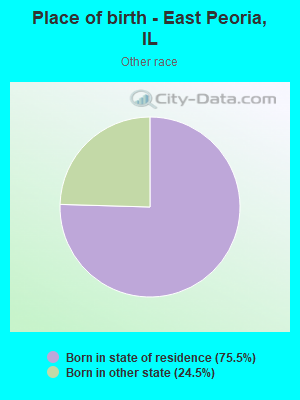
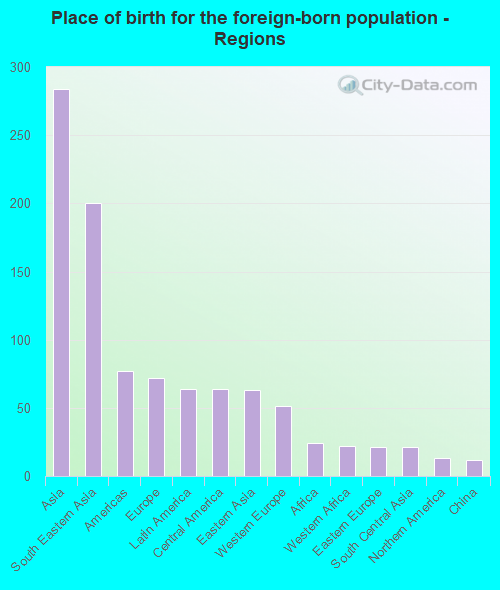
Place of birth for residents in East Peoria
![Place of birth for the foreign-born population - Regions]()
- 284Asia
- 200South Eastern Asia
- 77Americas
- 72Europe
- 64Latin America
- 64Central America
- 63Eastern Asia
- 51Western Europe
- 24Africa
- 22Western Africa
- 21Eastern Europe
- 21South Central Asia
- 13Northern America
- 12China
- 2Eastern Africa
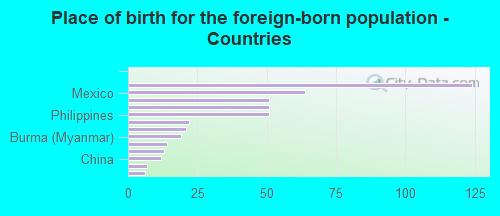
![Place of birth for the foreign-born population - Countries]()
- 124Vietnam
- 64Mexico
- 51Germany
- 51Korea
- 51Philippines
- 22Nigeria
- 21India
- 19Burma (Myanmar)
- 14Russia
- 13Canada
- 12China
- 7Latvia
- 6Thailand
Grandparents responsible for own grandchildren in East Peoria
Zip codes: 61571.