Races in High Point, North Carolina (NC) Detailed Stats
Data:
Races - White alone (%)
Races - White alone (% change since 2000)
Races - Black alone (%)
Races - Black alone (% change since 2000)
Races - American Indian alone (%)
Races - American Indian alone (% change since 2000)
Races - Asian alone (%)
Races - Asian alone (% change since 2000)
Races - Hispanic (%)
Races - Hispanic (% change since 2000)
Races - Native Hawaiian and Other Pacific Islander alone (%)
Races - Native Hawaiian and Other Pacific Islander alone (% change since 2000)
Races - Two or more races(%)
Races - Two or more races(% change since 2000)
Races - Other race alone (%)
Races - Other race alone (% change since 2000)
Racial diversity
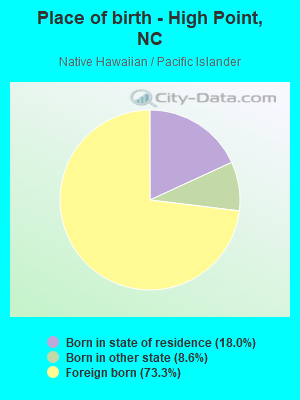
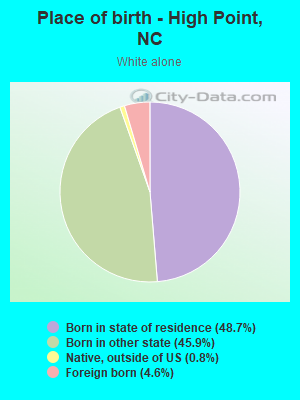
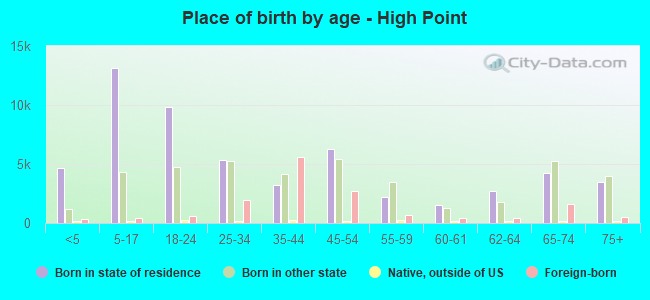
Place of birth - Born in state of residence (%)
Place of birth - Born in state of residence (%) - White
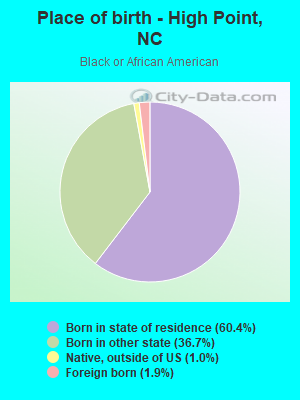
Place of birth - Born in state of residence (%) - Black or African American
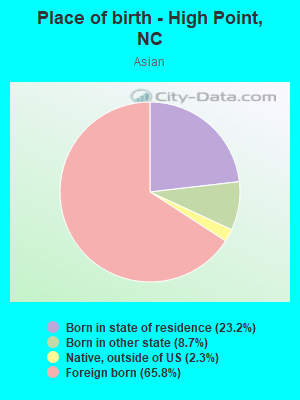
Place of birth - Born in state of residence (%) - Asian
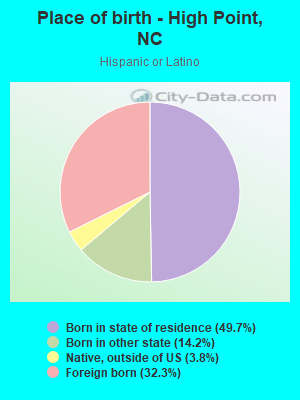
Place of birth - Born in state of residence (%) - Hispanic or Latino
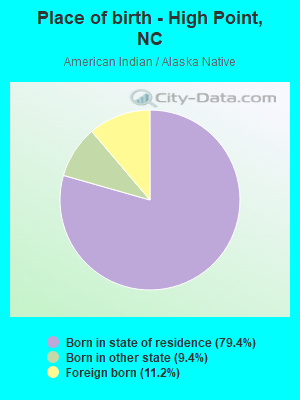
Place of birth - Born in state of residence (%) - American Indian and Alaska Native
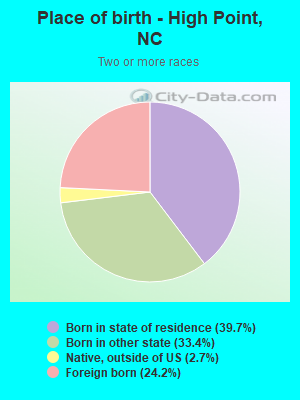
Place of birth - Born in state of residence (%) - Multirace
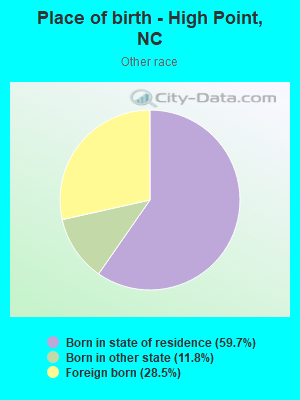
Place of birth - Born in state of residence (%) - Other Race
Place of birth - Born in other state (%)
Place of birth - Born in other state (%) - White
Place of birth - Born in other state (%) - Black or African American
Place of birth - Born in other state (%) - Asian
Place of birth - Born in other state (%) - Hispanic or Latino
Place of birth - Born in other state (%) - American Indian and Alaska Native
Place of birth - Born in other state (%) - Multirace
Place of birth - Born in other state (%) - Other Race
Place of birth - Native, outside of US (%)
Place of birth - Native, outside of US (%) - White
Place of birth - Native, outside of US (%) - Black or African American
Place of birth - Native, outside of US (%) - Asian
Place of birth - Native, outside of US (%) - Hispanic or Latino
Place of birth - Native, outside of US (%) - American Indian and Alaska Native
Place of birth - Native, outside of US (%) - Multirace
Place of birth - Native, outside of US (%) - Other Race
Place of birth - Foreign born (%)
Place of birth - Foreign born (%) - White
Place of birth - Foreign born (%) - Black or African American
Place of birth - Foreign born (%) - Asian
Place of birth - Foreign born (%) - Hispanic or Latino
Place of birth - Foreign born (%) - American Indian and Alaska Native
Place of birth - Foreign born (%) - Multirace
Place of birth - Foreign born (%) - Other Race
Residents speaking English at home (%)
Residents speaking English at home - Born in the United States (%)
Residents speaking English at home - Native, born elsewhere (%)
Residents speaking English at home - Foreign born (%)
Residents speaking Spanish at home (%)
Residents speaking Spanish at home - Born in the United States (%)
Residents speaking Spanish at home - Native, born elsewhere (%)
Residents speaking Spanish at home - Foreign born (%)
Residents speaking other language at home (%)
Residents speaking other language at home - Born in the United States (%)
Residents speaking other language at home - Native, born elsewhere (%)
Residents speaking other language at home - Foreign born (%)
Marital status - Never married (%)
Marital status - Now married (%)
Marital status - Separated (%)
Marital status - Widowed (%)
Marital status - Divorced (%)
Ancestries Reported - Arab (%)
Ancestries Reported - Czech (%)
Ancestries Reported - Danish (%)
Ancestries Reported - Dutch (%)
Ancestries Reported - English (%)
Ancestries Reported - French (%)
Ancestries Reported - French Canadian (%)
Ancestries Reported - German (%)
Ancestries Reported - Greek (%)
Ancestries Reported - Hungarian (%)
Ancestries Reported - Irish (%)
Ancestries Reported - Italian (%)
Ancestries Reported - Lithuanian (%)
Ancestries Reported - Norwegian (%)
Ancestries Reported - Polish (%)
Ancestries Reported - Portuguese (%)
Ancestries Reported - Russian (%)
Ancestries Reported - Scotch-Irish (%)
Ancestries Reported - Scottish (%)
Ancestries Reported - Slovak (%)
Ancestries Reported - Subsaharan African (%)
Ancestries Reported - Swedish (%)
Ancestries Reported - Swiss (%)
Ancestries Reported - Ukrainian (%)
Ancestries Reported - United States (%)
Ancestries Reported - Welsh (%)
Ancestries Reported - West Indian (%)
Ancestries Reported - Other (%)
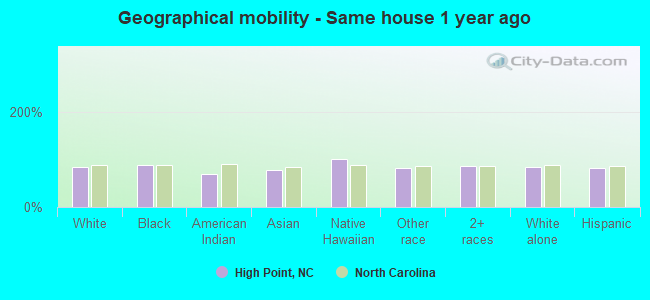
Geographical mobility - Same house 1 year ago (%)
Geographical mobility - Same house 1 year ago (%) - White
Geographical mobility - Same house 1 year ago (%) - Black or African American
Geographical mobility - Same house 1 year ago (%) - Asian
Geographical mobility - Same house 1 year ago (%) - Hispanic or Latino
Geographical mobility - Same house 1 year ago (%) - American Indian and Alaska Native
Geographical mobility - Same house 1 year ago (%) - Multirace
Geographical mobility - Same house 1 year ago (%) - Other Race
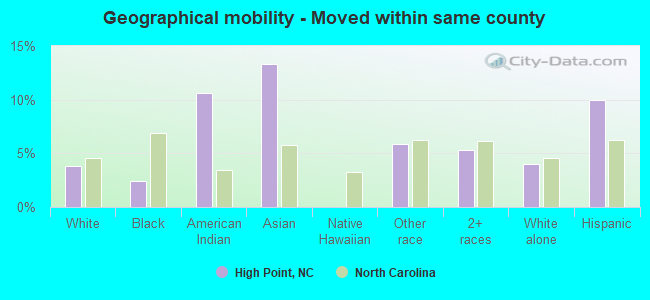
Geographical mobility - Moved within same county (%)
Geographical mobility - Moved within same county (%) - White
Geographical mobility - Moved within same county (%) - Black or African American
Geographical mobility - Moved within same county (%) - Asian
Geographical mobility - Moved within same county (%) - Hispanic or Latino
Geographical mobility - Moved within same county (%) - American Indian and Alaska Native
Geographical mobility - Moved within same county (%) - Multirace
Geographical mobility - Moved within same county (%) - Other Race
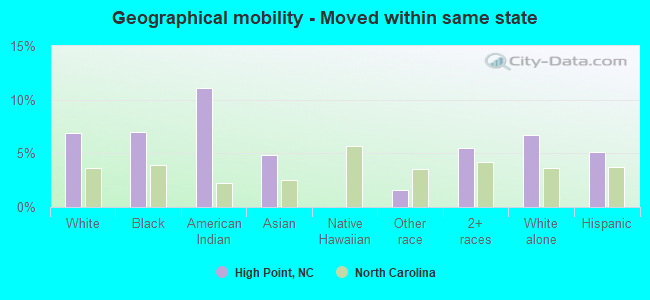
Geographical mobility - Moved from different county within same state (%)
Geographical mobility - Moved from different county within same state (%) - White
Geographical mobility - Moved from different county within same state (%) - Black or African American
Geographical mobility - Moved from different county within same state (%) - Asian
Geographical mobility - Moved from different county within same state (%) - Hispanic or Latino
Geographical mobility - Moved from different county within same state (%) - American Indian and Alaska Native
Geographical mobility - Moved from different county within same state (%) - Multirace
Geographical mobility - Moved from different county within same state (%) - Other Race
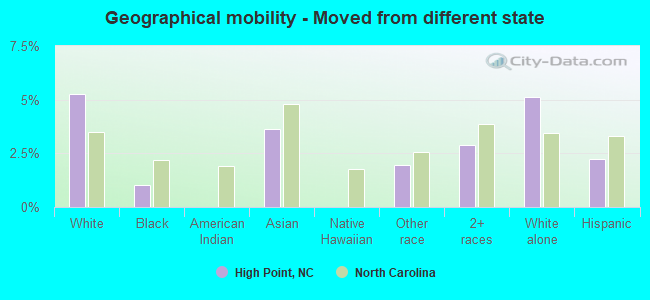
Geographical mobility - Moved from different state (%)
Geographical mobility - Moved from different state (%) - White
Geographical mobility - Moved from different state (%) - Black or African American
Geographical mobility - Moved from different state (%) - Asian
Geographical mobility - Moved from different state (%) - Hispanic or Latino
Geographical mobility - Moved from different state (%) - American Indian and Alaska Native
Geographical mobility - Moved from different state (%) - Multirace
Geographical mobility - Moved from different state (%) - Other Race
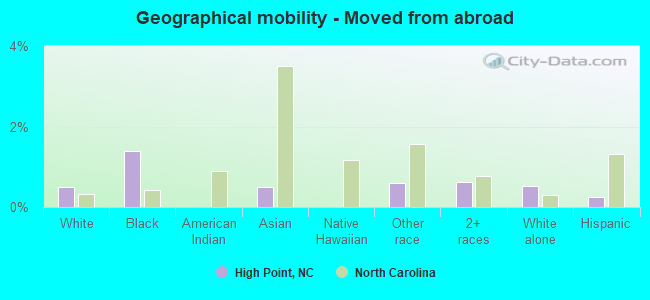
Geographical mobility - Moved from abroad (%)
Geographical mobility - Moved from abroad (%) - White
Geographical mobility - Moved from abroad (%) - Black or African American
Geographical mobility - Moved from abroad (%) - Asian
Geographical mobility - Moved from abroad (%) - Hispanic or Latino
Geographical mobility - Moved from abroad (%) - American Indian and Alaska Native
Geographical mobility - Moved from abroad (%) - Multirace
Geographical mobility - Moved from abroad (%) - Other Race
Place of birth for the foreign-born population - Ireland (%)
Place of birth for the foreign-born population - Denmark (%)
Place of birth for the foreign-born population - Norway (%)
Place of birth for the foreign-born population - Sweden (%)
Place of birth for the foreign-born population - United Kingdom (%)
Place of birth for the foreign-born population - England (%)
Place of birth for the foreign-born population - Scotland (%)
Place of birth for the foreign-born population - Other Northern Europe (%)
Place of birth for the foreign-born population - Austria (%)
Place of birth for the foreign-born population - Belgium (%)
Place of birth for the foreign-born population - France (%)
Place of birth for the foreign-born population - Germany (%)
Place of birth for the foreign-born population - Netherlands (%)
Place of birth for the foreign-born population - Switzerland (%)
Place of birth for the foreign-born population - Other Western Europe (%)
Place of birth for the foreign-born population - Greece (%)
Place of birth for the foreign-born population - Italy (%)
Place of birth for the foreign-born population - Portugal (%)
Place of birth for the foreign-born population - Spain (%)
Place of birth for the foreign-born population - Other Southern Europe (%)
Place of birth for the foreign-born population - Albania (%)
Place of birth for the foreign-born population - Belarus (%)
Place of birth for the foreign-born population - Bosnia and Herzegovina (%)
Place of birth for the foreign-born population - Bulgaria (%)
Place of birth for the foreign-born population - Croatia (%)
Place of birth for the foreign-born population - Czechoslovakia (%)
Place of birth for the foreign-born population - Hungary (%)
Place of birth for the foreign-born population - Latvia (%)
Place of birth for the foreign-born population - Lithuania (%)
Place of birth for the foreign-born population - North Macedonia (Macedonia) (%)
Place of birth for the foreign-born population - Moldova (%)
Place of birth for the foreign-born population - Poland (%)
Place of birth for the foreign-born population - Romania (%)
Place of birth for the foreign-born population - Russia (%)
Place of birth for the foreign-born population - Serbia (%)
Place of birth for the foreign-born population - Ukraine (%)
Place of birth for the foreign-born population - Other Eastern Europe (%)
Place of birth for the foreign-born population - China (%)
Place of birth for the foreign-born population - Hong Kong (%)
Place of birth for the foreign-born population - Taiwan (%)
Place of birth for the foreign-born population - Japan (%)
Place of birth for the foreign-born population - Korea (%)
Place of birth for the foreign-born population - Other Eastern Asia (%)
Place of birth for the foreign-born population - Afghanistan (%)
Place of birth for the foreign-born population - Bangladesh (%)
Place of birth for the foreign-born population - India (%)
Place of birth for the foreign-born population - Iran (%)
Place of birth for the foreign-born population - Kazakhstan (%)
Place of birth for the foreign-born population - Nepal (%)
Place of birth for the foreign-born population - Pakistan (%)
Place of birth for the foreign-born population - Sri Lanka (%)
Place of birth for the foreign-born population - Uzbekistan (%)
Place of birth for the foreign-born population - Other South Central Asia (%)
Place of birth for the foreign-born population - Burma (%)
Place of birth for the foreign-born population - Cambodia (%)
Place of birth for the foreign-born population - Indonesia (%)
Place of birth for the foreign-born population - Laos (%)
Place of birth for the foreign-born population - Malaysia (%)
Place of birth for the foreign-born population - Philippines (%)
Place of birth for the foreign-born population - Singapore (%)
Place of birth for the foreign-born population - Thailand (%)
Place of birth for the foreign-born population - Vietnam (%)
Place of birth for the foreign-born population - Other South Eastern Asia (%)
Place of birth for the foreign-born population - Armenia (%)
Place of birth for the foreign-born population - Iraq (%)
Place of birth for the foreign-born population - Israel (%)
Place of birth for the foreign-born population - Jordan (%)
Place of birth for the foreign-born population - Kuwait (%)
Place of birth for the foreign-born population - Lebanon (%)
Place of birth for the foreign-born population - Saudi Arabia (%)
Place of birth for the foreign-born population - Syria (%)
Place of birth for the foreign-born population - Turkey (%)
Place of birth for the foreign-born population - Yemen (%)
Place of birth for the foreign-born population - Other Western Asia (%)
Place of birth for the foreign-born population - Eritrea (%)
Place of birth for the foreign-born population - Ethiopia (%)
Place of birth for the foreign-born population - Kenya (%)
Place of birth for the foreign-born population - Somalia (%)
Place of birth for the foreign-born population - Uganda (%)
Place of birth for the foreign-born population - Zimbabwe (%)
Place of birth for the foreign-born population - Other Eastern Africa (%)
Place of birth for the foreign-born population - Cameroon (%)
Place of birth for the foreign-born population - Congo (%)
Place of birth for the foreign-born population - Democratic Republic of Congo (Zaire) (%)
Place of birth for the foreign-born population - Other Middle Africa (%)
Place of birth for the foreign-born population - Egypt (%)
Place of birth for the foreign-born population - Morocco (%)
Place of birth for the foreign-born population - Sudan (%)
Place of birth for the foreign-born population - Other Northern Africa (%)
Place of birth for the foreign-born population - South Africa (%)
Place of birth for the foreign-born population - Other Southern Africa (%)
Place of birth for the foreign-born population - Cabo Verde (%)
Place of birth for the foreign-born population - Ghana (%)
Place of birth for the foreign-born population - Liberia (%)
Place of birth for the foreign-born population - Nigeria (%)
Place of birth for the foreign-born population - Senegal (%)
Place of birth for the foreign-born population - Sierra Leone (%)
Place of birth for the foreign-born population - Other Western Africa (%)
Place of birth for the foreign-born population - Australia (%)
Place of birth for the foreign-born population - New Zealand (%)
Place of birth for the foreign-born population - Fiji (%)
Place of birth for the foreign-born population - Micronesia (%)
Place of birth for the foreign-born population - Bahamas (%)
Place of birth for the foreign-born population - Barbados (%)
Place of birth for the foreign-born population - Cuba (%)
Place of birth for the foreign-born population - Dominica (%)
Place of birth for the foreign-born population - Dominican Republic (%)
Place of birth for the foreign-born population - Grenada (%)
Place of birth for the foreign-born population - Haiti (%)
Place of birth for the foreign-born population - Jamaica (%)
Place of birth for the foreign-born population - St. Vincent and the Grenadines (%)
Place of birth for the foreign-born population - Trinidad and Tobago (%)
Place of birth for the foreign-born population - West Indies (%)
Place of birth for the foreign-born population - Other Caribbean (%)
Place of birth for the foreign-born population - Belize (%)
Place of birth for the foreign-born population - Costa Rica (%)
Place of birth for the foreign-born population - El Salvador (%)
Place of birth for the foreign-born population - Guatemala (%)
Place of birth for the foreign-born population - Honduras (%)
Place of birth for the foreign-born population - Mexico (%)
Place of birth for the foreign-born population - Nicaragua (%)
Place of birth for the foreign-born population - Panama (%)
Place of birth for the foreign-born population - Other Central America (%)
Place of birth for the foreign-born population - Argentina (%)
Place of birth for the foreign-born population - Bolivia (%)
Place of birth for the foreign-born population - Brazil (%)
Place of birth for the foreign-born population - Chile (%)
Place of birth for the foreign-born population - Colombia (%)
Place of birth for the foreign-born population - Ecuador (%)
Place of birth for the foreign-born population - Guyana (%)
Place of birth for the foreign-born population - Peru (%)
Place of birth for the foreign-born population - Uruguay (%)
Place of birth for the foreign-born population - Venezuela (%)
Place of birth for the foreign-born population - Other South America (%)
Place of birth for the foreign-born population - Canada (%)
Place of birth for the foreign-born population - Other Northern America (%)
Place of birth for the foreign-born population - Other (%)
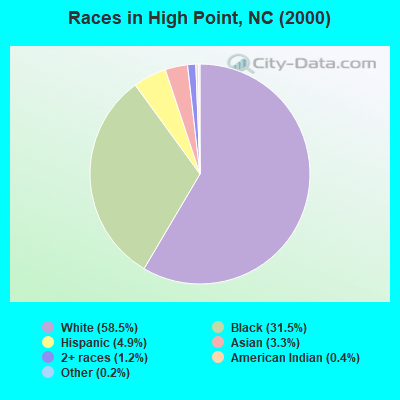
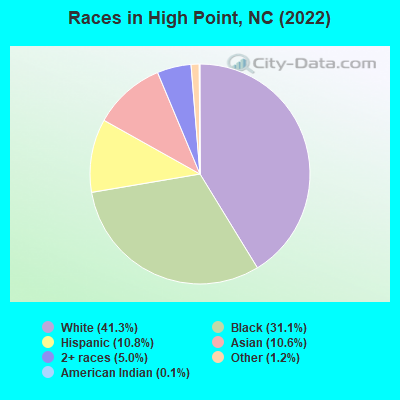
According to 2022 data, the most numerous races in High Point, NC are White alone (47,169 residents), Black alone (35,523 residents), and Hispanic (12,331 residents). 80.0% of High Point residents speak English at home. 13.2% of High Point, NC residents are foreign-born (5.7% born in Asia, 4.3% born in Latin America), which is 39.5% greater than the foreign-born rate of 8.0% across the entire state of North Carolina.
Race distribution in High Point
2000 2022
50,176 58.5% White alone 27,064 31.5% Black alone 4,197 4.9% Hispanic 2,847 3.3% Asian alone 1,054 1.2% Two or more races 349 0.4% American Indian alone 139 0.2% Other race alone 13 0.02% Native Hawaiian and Other
47,169 41.3% White alone 35,523 31.1% Black alone 12,331 10.8% Hispanic 12,167 10.6% Asian alone 5,674 5.0% Two or more races 1,321 1.2% Other race alone 154 0.1% American Indian alone
2000 2022
5,647,155 70.2% White alone 1,723,301 21.4% Black alone 378,963 4.7% Hispanic 112,416 1.4% Asian alone 95,333 1.2% American Indian alone 79,965 1.0% Two or more races 9,015 0.1% Other race alone 3,165 0.04% Native Hawaiian and Other
6,497,519 60.7% White alone 2,155,650 20.1% Black alone 1,114,799 10.4% Hispanic 438,061 4.1% Two or more races 341,052 3.2% Asian alone 91,758 0.9% American Indian alone 50,180 0.5% Other race alone 9,954 0.09% Native Hawaiian and Other
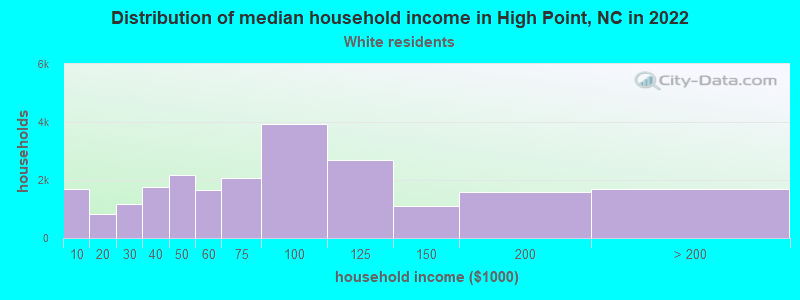
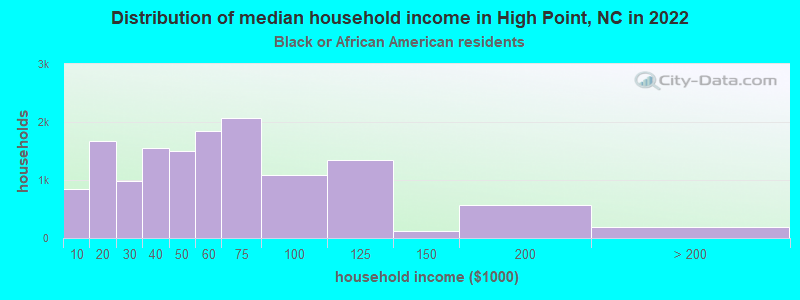
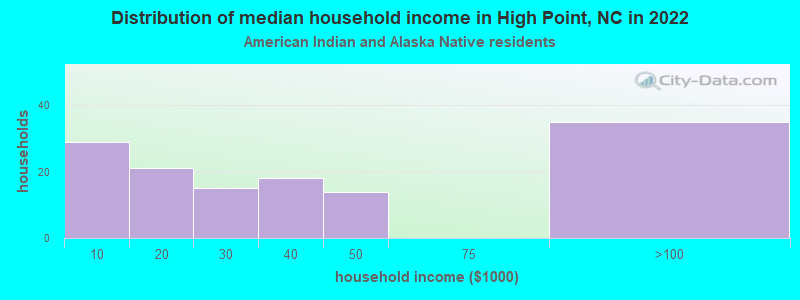
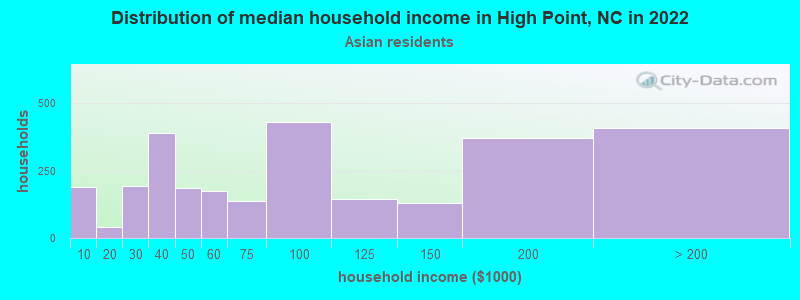
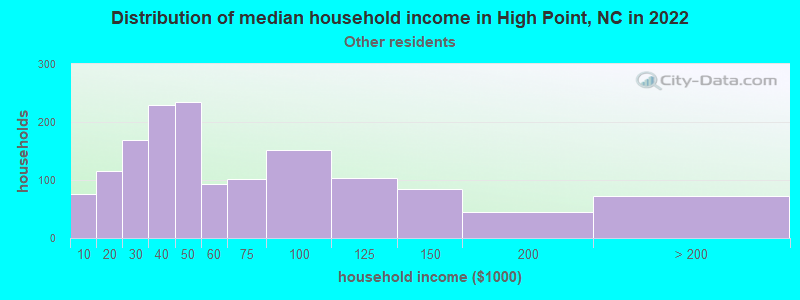
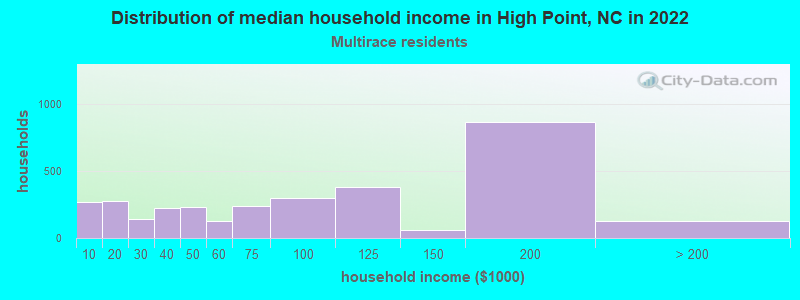
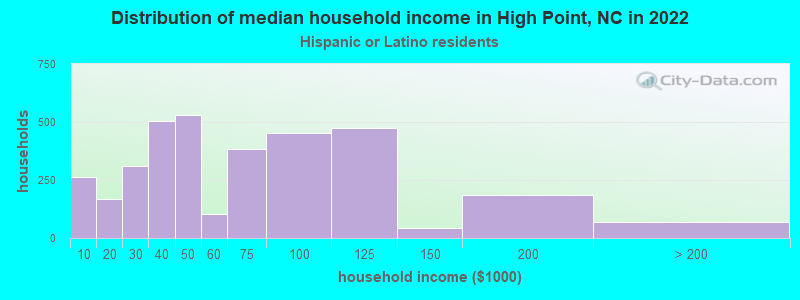
Income and house value in High Point Median household income in 2022 $73,933 White non-Hispanic householders$53,073 Black householders$25,788 American Indian and Alaska Native householders$98,579 Asian householders$47,500 Some other race householders$100,210 Two or more races householders$64,696 Hispanic or Latino race householdersMedian 2022 house value $240,018 White Non-Hispanic householders$158,137 Black or African American householders$278,563 American Indian or Alaska Native householders $208,141 Asian householders$149,386 Some other race householders$144,177 Two or more races householders$185,847 Hispanic or Latino householders
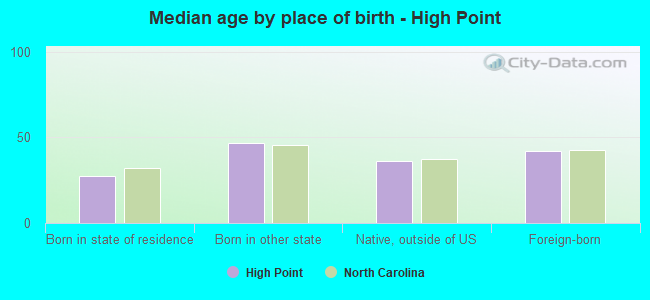
Median age by race in High Point
48.0 Median age for White residents47.4 48.6 41.2 Median age for Black or African American residents41.2 41.7 32.5 Median age for American Indian / Alaska Native residents32.3 38.2 36.5 Median age for Asian residents35.4 36.8 -666,666,666.0 Median age for Native Hawaiian / Pacific Islander residents-666,666,666.0 -666,666,666.0 18.3 Median age for Other race residents24.5 14.6 23.4 Median age for Two or more races residents20.5 29.1 49.5 Median age for White alone residents49.1 50.0 24.3 Median age for Hispanic or Latino residents33.0 20.6
Owner/renter occupied households by race in High Point
House owners and renters - White residents 15,719 70.3% Owner occupied6,637 29.7% Renter occupiedHouse owners and renters - Black or African American residents 5,203 37.8% Owner occupied8,558 62.2% Renter occupiedHouse owners and renters - American Indian / Alaska Native residents 93 43.4% Owner occupied121 56.6% Renter occupiedHouse owners and renters - Asian residents 3,558 90.1% Owner occupied392 9.9% Renter occupiedHouse owners and renters - Other race residents 670 51.6% Owner occupied628 48.4% Renter occupiedHouse owners and renters - Two or more races residents 1,969 48.0% Owner occupied2,136 52.0% Renter occupiedHouse owners and renters - White alone residents 15,114 70.3% Owner occupied6,388 29.7% Renter occupiedHouse owners and renters - Hispanic or Latino residents 1,863 44.8% Owner occupied2,297 55.2% Renter occupied
Language usage in High Point
English speakers - Total 80.0% of residents of High Point speak English at home.
8.2% of residents speak Spanish at home 5,933 66.6% Speak English very well2,973 33.4% Speak English less than very well11.8% of residents speak other language at home 8,179 64.3% Speak English very well4,532 35.7% Speak English less than very well
English speakers - Born in the United States 95.1% of residents of High Point speak English at home.
2.3% of residents speak Spanish at home 762 83.7% Speak English very well148 16.3% Speak English less than very well2.7% of residents speak other language at home 1,053 100.0% Speak English very well
English speakers - Native, born elsewhere 43.7% of residents of High Point speak English at home.
38.1% of residents speak Spanish at home 525 100.0% Speak English very well18.3% of residents speak other language at home 252 100.0% Speak English very well
English speakers - Foreign-born 11.6% of residents of High Point speak English at home.
24.7% of residents speak Spanish at home 1,274 34.4% Speak English very well2,428 65.6% Speak English less than very well63.7% of residents speak other language at home 5,448 57.0% Speak English very well4,110 43.0% Speak English less than very well
White (Caucasian) - Speak only English Native:
95.6% (44,138)Foreign-born:
25.2% (491)
White (Caucasian) - Speak another language Native:
4.4% (2,026)Foreign-born:
74.8% (1,459)
Black or African American - Speak only English Native:
97.9% (32,593)Foreign-born:
29.7% (529)
Black or African American - Speak another language Native:
1.9% (636)Foreign-born:
70.3% (1,252)
American Indian / Alaska Native - Speak another language Native:
21.5% (81)Foreign-born:
100.0% (78)
Asian - Speak only English Native:
29.1% (1,026)Foreign-born:
7.4% (586)
Asian - Speak another language Native:
70.9% (2,501)Foreign-born:
92.6% (7,294)
Other race - Speak only English Native:
37.5% (1,369)Foreign-born:
8.2% (127)
Other race - Speak another language Native:
62.5% (2,282)Foreign-born:
91.8% (1,416)
Two or more races - Speak only English Native:
79.4% (4,918)Foreign-born:
20.7% (542)
Two or more races - Speak another language Native:
20.6% (1,275)Foreign-born:
79.3% (2,080)
White alone - Speak only English Native:
98.5% (43,502)Foreign-born:
25.7% (491)
White alone - Speak another language Native:
1.5% (652)Foreign-born:
74.3% (1,420)
Hispanic or Latino - Speak only English Native:
31.9% (2,379)Foreign-born:
8.7% (347)
Hispanic or Latino - Speak another language Native:
68.1% (5,087)Foreign-born:
91.3% (3,639)
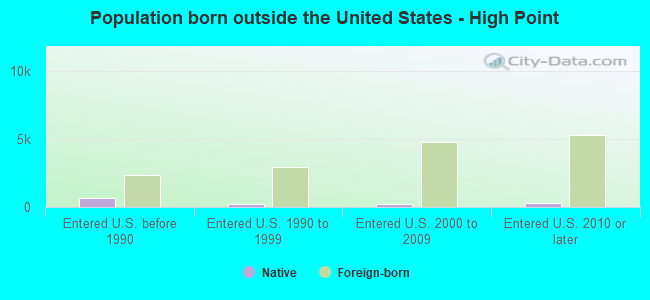
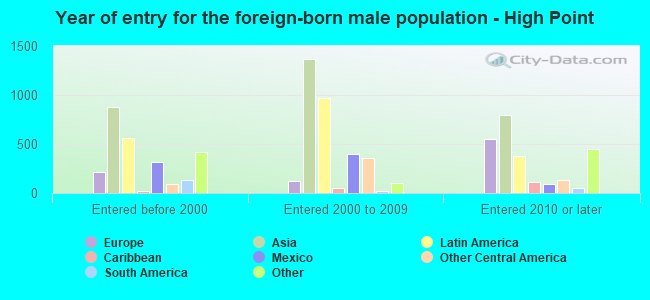
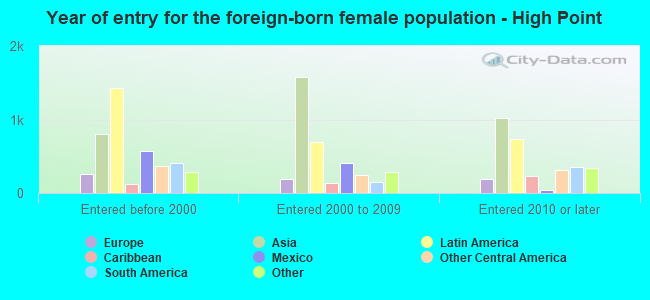
Foreign-born residents in High Point 15,272 residents are foreign born (5.7% Asia , 4.3% Latin America ).
This city:
13.2%North Carolina:
8.3%
Marital status for residents in High Point Marital status - White (Caucasian) population 15 years and over
Males 38.0% Never married51.1% Now married1.6% Separated3.6% Widowed5.8% DivorcedFemales 34.4% Never married41.3% Now married1.1% Separated9.1% Widowed14.1% DivorcedWomen who gave birth in the past 12 months Now married:
52.9% (72)Unmarried:
47.1% (64)
Women who did not give birth in the past 12 months Now married:
32.3% (4,070)Unmarried:
67.7% (8,538)
Marital status - Black or African American population 15 years and over
Males 34.3% Never married50.4% Now married0.3% Separated3.0% Widowed12.0% DivorcedFemales 44.2% Never married28.2% Now married1.9% Separated3.9% Widowed21.9% DivorcedWomen who gave birth in the past 12 months Now married:
100.0% (266)Unmarried:
0.0% (0)
Women who did not give birth in the past 12 months Now married:
17.1% (1,302)Unmarried:
82.9% (6,310)
Marital status - American Indian / Alaska Native population 15 years and over
Males 44.2% Never married38.5% Now married0.0% Separated0.0% Widowed17.3% DivorcedFemales 51.9% Never married29.3% Now married0.0% Separated4.2% Widowed14.6% DivorcedWomen who gave birth in the past 12 months Now married:
0.0% (0)Unmarried:
100.0% (20)
Women who did not give birth in the past 12 months Now married:
28.3% (48)Unmarried:
71.7% (121)
Marital status - Asian population 15 years and over
Males 21.0% Never married74.2% Now married0.0% Separated1.0% Widowed3.7% DivorcedFemales 23.0% Never married64.7% Now married2.2% Separated6.7% Widowed3.5% DivorcedWomen who gave birth in the past 12 months Now married:
100.0% (86)Unmarried:
0.0% (0)
Women who did not give birth in the past 12 months Now married:
66.5% (1,691)Unmarried:
33.5% (852)
Marital status - Native Hawaiian / Pacific Islander population 15 years and over
Males 0.0% Never married0.0% Now married0.0% Separated100.0% Widowed0.0% DivorcedFemales 100.0% Never married0.0% Now married0.0% Separated0.0% Widowed0.0% DivorcedWomen who did not give birth in the past 12 months Now married:
0.0% (0)Unmarried:
100.0% (4)
Marital status - Other race population 15 years and over
Males 36.4% Never married48.8% Now married7.2% Separated0.0% Widowed7.7% DivorcedFemales 50.0% Never married29.7% Now married5.4% Separated5.0% Widowed9.9% DivorcedWomen who gave birth in the past 12 months Now married:
56.3% (64)Unmarried:
43.7% (49)
Women who did not give birth in the past 12 months Now married:
33.8% (634)Unmarried:
66.2% (1,241)
Marital status - Two or more races population 15 years and over
Males 58.3% Never married35.5% Now married4.4% Separated0.7% Widowed1.2% DivorcedFemales 43.0% Never married35.6% Now married2.7% Separated6.7% Widowed12.0% DivorcedWomen who gave birth in the past 12 months Now married:
78.3% (117)Unmarried:
21.7% (32)
Women who did not give birth in the past 12 months Now married:
31.5% (824)Unmarried:
68.5% (1,787)
Marital status - White alone, not Hispanic / Latino population 15 years and over
Males 37.7% Never married51.0% Now married1.6% Separated3.7% Widowed6.0% DivorcedFemales 33.1% Never married42.5% Now married1.1% Separated9.4% Widowed13.8% DivorcedWomen who gave birth in the past 12 months Now married:
52.9% (72)Unmarried:
47.1% (64)
Women who did not give birth in the past 12 months Now married:
34.5% (4,028)Unmarried:
65.5% (7,664)
Marital status - Hispanic or Latino population 15 years and over
Males 39.0% Never married52.8% Now married1.9% Separated0.0% Widowed6.2% DivorcedFemales 52.5% Never married34.8% Now married1.7% Separated2.9% Widowed8.1% DivorcedWomen who gave birth in the past 12 months Now married:
66.0% (105)Unmarried:
34.0% (54)
Women who did not give birth in the past 12 months Now married:
36.2% (1,244)Unmarried:
63.8% (2,195)
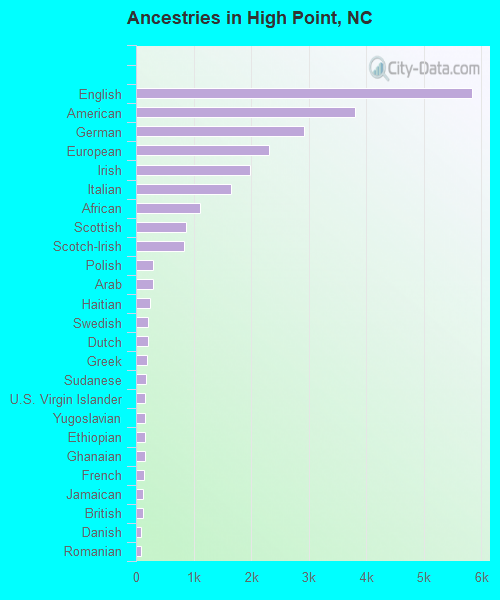
Ancestries in High Point
5,839 8.5% English3,807 5.5% American2,917 4.2% German2,316 3.4% European1,976 2.9% Irish1,653 2.4% Italian1,118 1.6% African869 1.3% Scottish838 1.2% Scotch-Irish297 0.4% Polish290 0.4% Arab239 0.3% Haitian212 0.3% Swedish209 0.3% Dutch192 0.3% Greek174 0.3% Sudanese162 0.2% U.S. Virgin Islander160 0.2% Yugoslavian158 0.2% Ethiopian152 0.2% Ghanaian139 0.2% French128 0.2% Jamaican117 0.2% British92 0.1% Danish84 0.1% Romanian82 0.1% Trinidadian and Tobagonian76 0.1% Slovak71 0.1% French Canadian67 0.10% Egyptian66 0.10% Hungarian63 0.09% Welsh62 0.09% Moroccan56 0.08% Eastern European51 0.07% Brazilian49 0.07% Turkish49 0.07% Liberian47 0.07% Russian44 0.06% Iraqi43 0.06% Northern European43 0.06% Portuguese39 0.06% Scandinavian35 0.05% Norwegian35 0.05% Lebanese35 0.05% West Indian34 0.05% British West Indian32 0.05% Canadian30 0.04% Icelander29 0.04% Swiss29 0.04% Bulgarian25 0.04% Iranian22 0.03% Albanian21 0.03% Lithuanian20 0.03% Austrian19 0.03% Nigerian18 0.03% Palestinian16 0.02% Australian16 0.02% Armenian15 0.02% Afghan12 0.02% Croatian11 0.02% Ukrainian8 0.01% Bermudan7 0.01% Pennsylvania German7 0.01% Israeli
Geographical mobility in High Point Same house 1 year ago 41,098 83.5% White (Caucasian)31,236 88.2% Black or African American349 70.2% American Indian / Alaska Native9,460 77.8% Asian20 100.0% Native Hawaiian / Pacific Islander5,172 81.1% Other race7,955 85.5% Two or more races39,419 83.7% White alone, not Hispanic / Latino9,880 82.4% Hispanic or LatinoMoved within same county 1,870 3.8% White / Caucasian865 2.4% Black or African American52 10.6% American Indian / Alaska Native1,616 13.3% Asian377 5.9% Other race493 5.3% Two or more races1,870 4.0% White alone, not Hispanic / Latino1,200 10.0% Hispanic or LatinoMoved within same state 3,407 6.9% White / Caucasian2,461 6.9% Black or African American55 11.1% American Indian / Alaska Native590 4.8% Asian99 1.6% Other race512 5.5% Two or more races3,140 6.7% White alone, not Hispanic / Latino613 5.1% Hispanic or LatinoMoved from different state 2,587 5.3% White / Caucasian358 1.0% Black or African American441 3.6% Asian124 1.9% Other race269 2.9% Two or more races2,413 5.1% White alone, not Hispanic / Latino270 2.3% Hispanic or LatinoMoved from abroad 241 0.5% White492 1.4% Black or African American60 0.5% Asian39 0.6% Other race58 0.6% Two or more races241 0.5% White alone, not Hispanic / Latino29 0.2% Hispanic or Latino
Children Nativity (place of birth) in High Point
Children under 6 years - Living with two parents Both parents native 2,427 100.0% NativeBoth parents foreign-born 863 67.6% Native414 32.4% Foreign-bornOne native, one foreign-born parent 472 100.0% NativeChildren under 6 years - Living with one parent Native parent 2,219 100.0% NativeForeign-born parent 580 100.0% NativeChildren 6 to 17 years - Living with two parents Both parents native 5,874 100.0% NativeBoth parents foreign-born 3,003 88.0% Native409 12.0% Foreign-bornOne native, one foreign-born parent 315 100.0% NativeChildren 6 to 17 years - Living with one parent Native parent 4,854 100.0% NativeForeign-born parent 1,377 50.0% Native1,377 50.0% Foreign-born
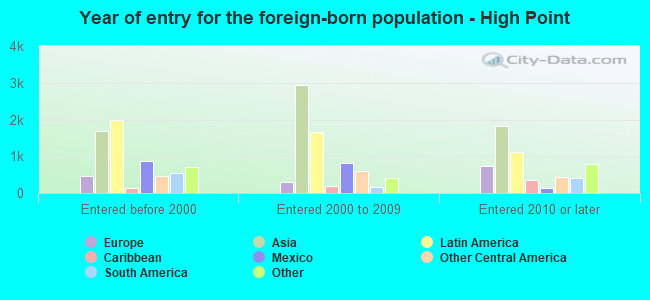
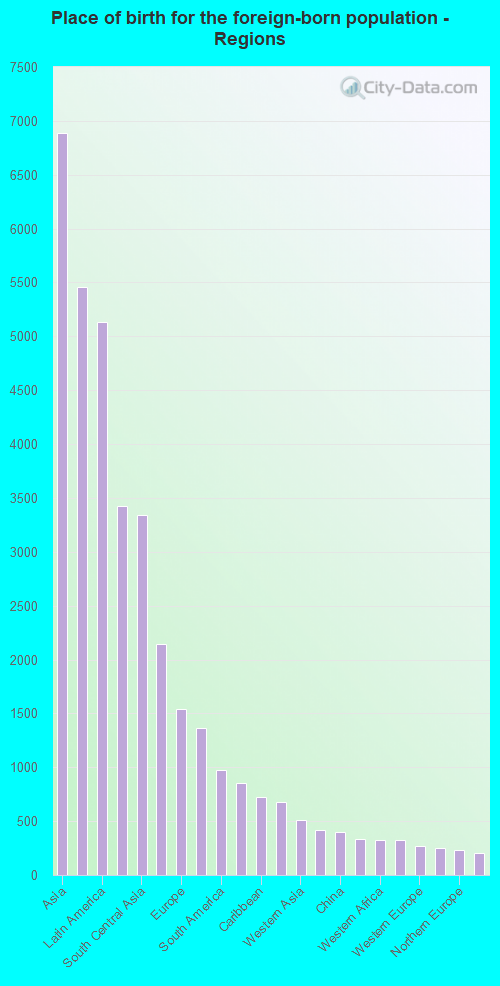
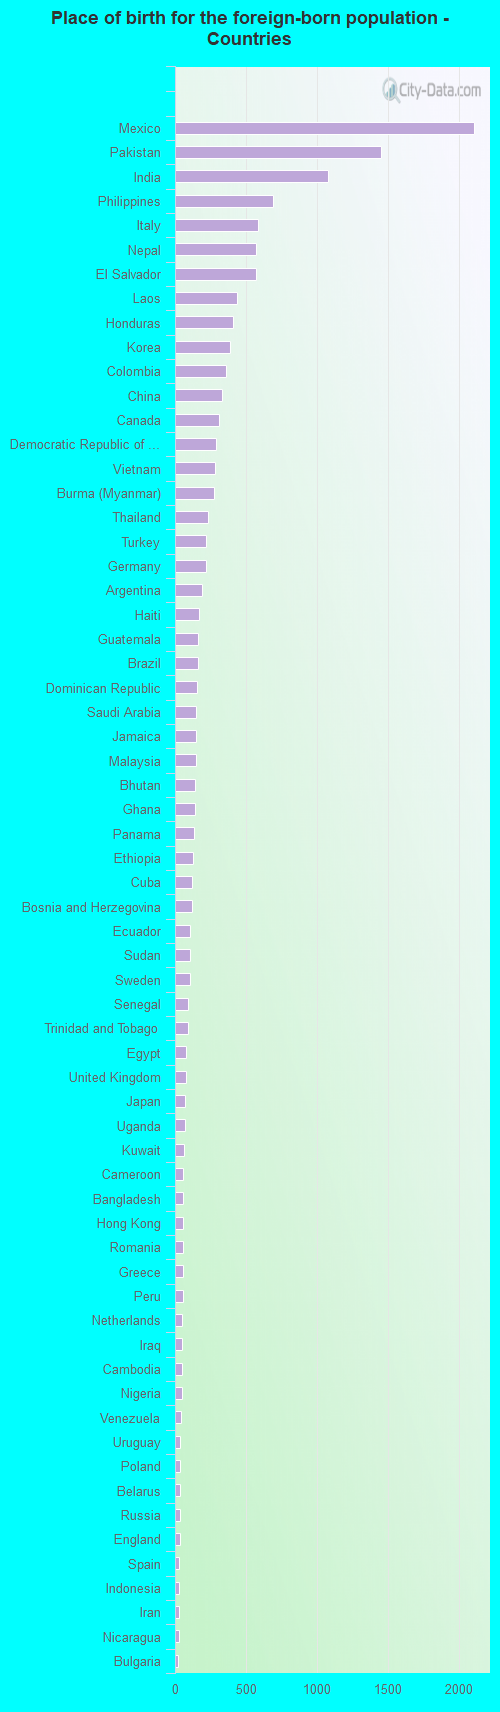
Place of birth for residents in High Point 6,887 Asia5,456 Americas5,131 Latin America3,425 Central America3,343 South Central Asia2,142 South Eastern Asia1,545 Europe1,367 Africa978 South America857 Eastern Asia727 Caribbean673 Southern Europe511 Western Asia419 Middle Africa396 China332 Eastern Europe326 Western Africa325 Northern America269 Western Europe250 Eastern Africa236 Northern Europe202 Northern Africa14 Oceania14 Australia and New Zealand Subregion2,108 Mexico1,454 Pakistan1,075 India693 Philippines588 Italy573 Nepal571 El Salvador434 Laos408 Honduras389 Korea360 Colombia331 China309 Canada288 Democratic Republic of Congo (Zaire)279 Vietnam276 Burma (Myanmar)232 Thailand218 Turkey216 Germany188 Argentina167 Haiti164 Guatemala159 Brazil156 Dominican Republic149 Saudi Arabia148 Jamaica147 Malaysia143 Bhutan139 Ghana132 Panama124 Ethiopia123 Cuba122 Bosnia and Herzegovina106 Ecuador105 Sudan104 Sweden94 Senegal92 Trinidad and Tobago78 Egypt76 United Kingdom71 Japan69 Uganda63 Kuwait59 Cameroon59 Bangladesh55 Hong Kong54 Romania53 Greece53 Peru49 Netherlands47 Iraq46 Cambodia46 Nigeria44 Venezuela36 Uruguay35 Poland34 Belarus33 Russia32 England31 Spain30 Indonesia28 Iran28 Nicaragua23 Bulgaria17 Ukraine17 Guyana16 United Arab Emirates14 Jordan14 Australia13 Kenya11 Algeria11 Costa Rica10 Chile10 St. Lucia9 Denmark9 Scotland8 Taiwan8 Afghanistan7 Morocco7 Congo3 Belgium
Grandparents responsible for own grandchildren in High Point
Grandparents (30 to 59 years) White / Caucasian 145 43.3% Responsible for grandchildren190 56.7% Not responsible for grandchildrenBlack or African American 210 46.0% Responsible for grandchildren246 54.0% Not responsible for grandchildrenAsian 45 100.0% Not responsible for grandchildrenOther race 29 100.0% Not responsible for grandchildrenTwo or more races 27 100.0% Not responsible for grandchildrenWhite alone, not Hispanic / Latino 170 51.0% Responsible for grandchildren163 49.0% Not responsible for grandchildrenHispanic or Latino 64 100.0% Not responsible for grandchildrenGrandparents (60 years and over) White / Caucasian 23 7.5% Responsible for grandchildren288 92.5% Not responsible for grandchildrenBlack or African American 38 16.0% Responsible for grandchildren199 84.0% Not responsible for grandchildrenAsian 34 13.1% Responsible for grandchildren225 86.9% Not responsible for grandchildrenOther race 8 100.0% Not responsible for grandchildrenTwo or more races 160 100.0% Not responsible for grandchildrenWhite alone, not Hispanic / Latino 23 7.6% Responsible for grandchildren283 92.4% Not responsible for grandchildrenHispanic or Latino 115 100.0% Not responsible for grandchildren