Races in Hightstown, New Jersey (NJ) Detailed Stats
Ancestries, Foreign-born residents, place of birth
Settings
X


Recent posts about races in Hightstown, New Jersey on our local forum with over 2,400,000 registered users:
 | why are Hightstown property taxes so high? (11 replies) |
| Commute from Bellemead to Hightstown (5 replies) |
| Why are houses so cheap in Mercer/Middlesex counties? (49 replies) |
| Where can I find apartments in Central NJ to rent for $500 or less? (24 replies) |
| Hightstown, NJ (3 replies) |
| Commuting from East Windsor/Robbinsville, NJ to Mount Laurel, NJ? (4 replies) |
Latest news about races in Hightstown, NJ collected exclusively by city-data.com from local newspapers, TV, and radio stations
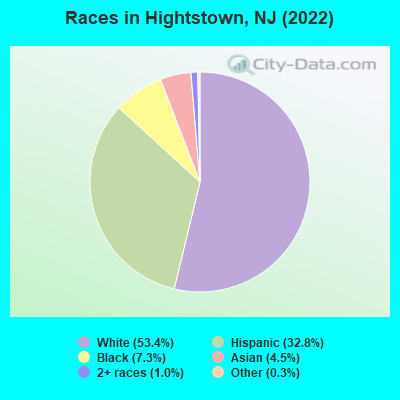
According to 2022 data, the most numerous races in Hightstown, NJ are White alone (3,107 residents), Hispanic (1,909 residents), and Black alone (424 residents). 59.0% of Hightstown residents speak English at home. 25.1% of Hightstown, NJ residents are foreign-born (16.0% born in Latin America, 3.0% born in Asia, 2.8% born in Europe), which is 8.3% greater than the foreign-born rate of 23.0% across the entire state of New Jersey.
Race distribution in Hightstown
2000
2022

- 3,51767.4%White alone
- 1,04620.1%Hispanic
- 4238.1%Black alone
- 1192.3%Asian alone
- 861.6%Two or more races
- 130.2%Other race alone
- 80.2%American Indian alone
- 40.08%Native Hawaiian and Other
Pacific Islander alone

-
- 3,10753.4%White alone
- 1,90932.8%Hispanic
- 4247.3%Black alone
- 2614.5%Asian alone
- 611.0%Two or more races
- 170.3%Other race alone
2000
2022
-
- 5,557,20966.0%White alone
- 1,117,19113.3%Hispanic
- 1,096,17113.0%Black alone
- 477,0125.7%Asian alone
- 133,6891.6%Two or more races
- 19,5650.2%Other race alone
- 11,3380.1%American Indian alone
- 2,1750.03%Native Hawaiian and Other
Pacific Islander alone

-
- 4,766,47651.5%White alone
- 2,028,47021.9%Hispanic
- 1,111,63212.0%Black alone
- 923,54610.0%Asian alone
- 332,2373.6%Two or more races
- 89,8471.0%Other race alone
- 8,5570.09%American Indian alone
- 9340.01%Native Hawaiian and Other
Pacific Islander alone

Income and house value in Hightstown
- Median household income in 2022
- $124,209White non-Hispanic householders
- $92,284Asian householders
- $101,338Some other race householders
- $88,278Hispanic or Latino race householders
- Median 2022 house value
- $340,560White Non-Hispanic householders
- $296,285Black or African American householders
- $364,971Some other race householders
- $448,736Two or more races householders
- $337,928Hispanic or Latino householders
Household income for White non-Hispanic householders

Household income for Black householders

Household income for Asian householders

Household income for Some other race householders

Household income for Two or more races householders

Household income for Hispanic or Latino race householders

Median age by race in Hightstown
- 49.4Median age for White residents
- 39.9Males
- 51.2Females
- 32.6Median age for Black or African American residents
- 32.2Males
- 56.0Females
- -1,134,860,049.8Median age for American Indian / Alaska Native residents
- -862,632,083.7Males
- -1,562,962,961.4Females
- 39.3Median age for Asian residents
- 38.3Males
- 54.3Females
- -804,177,544.9Median age for Native Hawaiian / Pacific Islander residents
- -860,335,194.7Males
- -713,070,378.3Females
- 28.9Median age for Other race residents
- 22.0Males
- 34.4Females
- 35.1Median age for Two or more races residents
- 30.7Males
- 35.1Females
- 51.9Median age for White alone residents
- 49.9Males
- 53.4Females
- 32.7Median age for Hispanic or Latino residents
- 31.7Males
- 36.4Females
Owner/renter occupied households by race in Hightstown
- House owners and renters - White residents
- 1,20173.5%Owner occupied
- 43226.5%Renter occupied
- House owners and renters - Black or African American residents
- 9878.5%Owner occupied
- 2721.5%Renter occupied
- House owners and renters - Asian residents
- 7774.0%Owner occupied
- 2726.0%Renter occupied
- House owners and renters - Other race residents
- 7165.4%Owner occupied
- 3834.6%Renter occupied
- House owners and renters - Two or more races residents
- 52100.0%Owner occupied
- House owners and renters - White alone residents
- 1,12786.9%Owner occupied
- 17013.1%Renter occupied
- House owners and renters - Hispanic or Latino residents
- 22941.1%Owner occupied
- 32958.9%Renter occupied
Language usage in Hightstown
- English speakers - Total
- 59.0% of residents of Hightstown speak English at home.
- 31.6% of residents speak Spanish at home
- 89250.8%Speak English very well
- 86449.2%Speak English less than very well
- 9.0% of residents speak other language at home
- 28456.8%Speak English very well
- 21643.2%Speak English less than very well
- English speakers - Born in the United States
- 91.5% of residents of Hightstown speak English at home.
- 7.7% of residents speak Spanish at home
- 1820.9%Speak English very well
- 6879.1%Speak English less than very well
- 2.6% of residents speak other language at home
- 29100.0%Speak English less than very well
- English speakers - Native, born elsewhere
- 53.3% of residents of Hightstown speak English at home.
- 37.8% of residents speak Spanish at home
- 34100.0%Speak English less than very well
- English speakers - Foreign-born
- 8.9% of residents of Hightstown speak English at home.
- 65.4% of residents speak Spanish at home
- 22422.0%Speak English very well
- 79278.0%Speak English less than very well
- 25.6% of residents speak other language at home
- 20351.1%Speak English very well
- 19448.9%Speak English less than very well
White (Caucasian) - Speak only English
| Native: | 86.5% (2,778) |
| Foreign-born: | 9.6% (66) |
White (Caucasian) - Speak another language
| Native: | 12.9% (414) |
| Foreign-born: | 88.8% (610) |
Asian - Speak only English
| Native: | 26.6% (24) |
| Foreign-born: | 23.3% (40) |
Asian - Speak another language
| Native: | 73.8% (68) |
| Foreign-born: | 74.4% (127) |
Other race - Speak another language
| Native: | 93.3% (189) |
| Foreign-born: | 87.3% (219) |
Two or more races - Speak another language
| Native: | 44.0% (67) |
| Foreign-born: | 95.7% (88) |
White alone - Speak only English
| Native: | 96.7% (2,717) |
| Foreign-born: | 37.3% (69) |
White alone - Speak another language
| Native: | 2.5% (69) |
| Foreign-born: | 59.7% (110) |
Hispanic or Latino - Speak another language
| Native: | 85.5% (672) |
| Foreign-born: | 94.7% (1,035) |
Foreign-born residents in Hightstown
1,459 residents are foreign born (16.0% Latin America, 3.0% Asia, 2.8% Europe).
| This city: | 25.1% |
| New Jersey: | 23.2% |


Marital status for residents in Hightstown
Marital status - White (Caucasian) population 15 years and over
- Males
- 31.9%Never married
- 61.8%Now married
- 0.0%Separated
- 0.0%Widowed
- 6.3%Divorced
- Females
- 27.6%Never married
- 57.5%Now married
- 2.4%Separated
- 1.3%Widowed
- 11.2%Divorced
Women who gave birth in the past 12 months
| Now married: | 100.0% (43) |
| Unmarried: | 0.0% (0) |
Women who did not give birth in the past 12 months
| Now married: | 48.0% (418) |
| Unmarried: | 52.0% (454) |
Marital status - Black or African American population 15 years and over
- Males
- 22.2%Never married
- 43.0%Now married
- 34.8%Separated
- 0.0%Widowed
- 0.0%Divorced
- Females
- 29.9%Never married
- 31.5%Now married
- 0.0%Separated
- 26.1%Widowed
- 12.5%Divorced
Women who gave birth in the past 12 months
| Now married: | 100.0% (29) |
| Unmarried: | 0.0% (0) |
Women who did not give birth in the past 12 months
| Now married: | 0.0% (0) |
| Unmarried: | 100.0% (37) |
Marital status - Asian population 15 years and over
- Males
- 31.6%Never married
- 68.4%Now married
- 0.0%Separated
- 0.0%Widowed
- 0.0%Divorced
- Females
- 0.0%Never married
- 50.0%Now married
- 0.0%Separated
- 24.1%Widowed
- 25.9%Divorced
Marital status - Other race population 15 years and over
- Males
- 37.4%Never married
- 62.6%Now married
- 0.0%Separated
- 0.0%Widowed
- 0.0%Divorced
- Females
- 36.0%Never married
- 30.7%Now married
- 0.0%Separated
- 0.0%Widowed
- 33.3%Divorced
Women who did not give birth in the past 12 months
| Now married: | 38.7% (62) |
| Unmarried: | 61.3% (98) |
Marital status - Two or more races population 15 years and over
- Males
- 25.0%Never married
- 75.0%Now married
- 0.0%Separated
- 0.0%Widowed
- 0.0%Divorced
- Females
- 11.7%Never married
- 72.7%Now married
- 0.0%Separated
- 0.0%Widowed
- 15.6%Divorced
Women who did not give birth in the past 12 months
| Now married: | 73.5% (46) |
| Unmarried: | 26.5% (17) |
Marital status - White alone, not Hispanic / Latino population 15 years and over
- Males
- 28.0%Never married
- 65.2%Now married
- 0.0%Separated
- 0.0%Widowed
- 6.9%Divorced
- Females
- 24.7%Never married
- 63.6%Now married
- 1.7%Separated
- 1.9%Widowed
- 8.0%Divorced
Women who gave birth in the past 12 months
| Now married: | 100.0% (46) |
| Unmarried: | 0.0% (0) |
Women who did not give birth in the past 12 months
| Now married: | 45.8% (244) |
| Unmarried: | 54.2% (289) |
Marital status - Hispanic or Latino population 15 years and over
- Males
- 40.7%Never married
- 55.7%Now married
- 0.0%Separated
- 0.0%Widowed
- 3.6%Divorced
- Females
- 34.7%Never married
- 41.3%Now married
- 3.2%Separated
- 0.0%Widowed
- 20.8%Divorced
Women who did not give birth in the past 12 months
| Now married: | 48.7% (315) |
| Unmarried: | 51.3% (332) |
Ancestries in Hightstown

- 47313.8%German
- 3389.9%Italian
- 1915.6%Nigerian
- 1394.1%American
- 1163.4%Russian
- 1002.9%Hungarian
- 762.2%Polish
- 672.0%Irish
- 581.7%British
- 431.3%Ukrainian
- 280.8%Eastern European
- 270.8%Scottish
- 230.7%European
- 230.7%Scotch-Irish
- 120.4%Portuguese
- 110.3%French

Geographical mobility in Hightstown

- Same house 1 year ago
- 3,91197.3%White (Caucasian)
- 23160.8%Black or African American
- 24693.5%Asian
- 36066.7%Other race
- 22493.0%Two or more races
- 2,97196.3%White alone, not Hispanic / Latino
- 1,68288.5%Hispanic or Latino

-
- Moved within same county
- 102.6%Black or African American
- 244.4%Other race
- 221.1%Hispanic or Latino

-
- Moved within same state
- 250.6%White / Caucasian
- 12232.0%Black or African American
- 260.9%White alone, not Hispanic / Latino

-
- Moved from different state
- 952.4%White / Caucasian
- 993.2%White alone, not Hispanic / Latino

-
- Moved from abroad
- 220.5%White
- 5119.2%Asian
- 7213.2%Other race
- 995.2%Hispanic or Latino

Children Nativity (place of birth) in Hightstown
Place of birth for residents in Hightstown
![Place of birth for the foreign-born population - Regions]()
- 971Americas
- 955Latin America
- 756South America
- 199Central America
- 176Asia
- 168Europe
- 142Africa
- 142Western Africa
- 96Eastern Europe
- 90South Central Asia
- 86South Eastern Asia
- 47Southern Europe
- 24Western Europe
- 16Northern America

![Place of birth for the foreign-born population - Countries]()
- 561Ecuador
- 178Colombia
- 116El Salvador
- 112Nigeria
- 86Philippines
- 61Guatemala
- 51Nepal
- 45Russia
- 38India
- 29Portugal
- 29Sierra Leone
- 28Ukraine
- 22Poland
- 21Mexico
- 18Italy
- 16Germany
- 16Peru
- 16Canada
- 8Netherlands

Grandparents responsible for own grandchildren in Hightstown
Zip codes: 08520.