Races in League City, Texas (TX) Detailed Stats
Data:
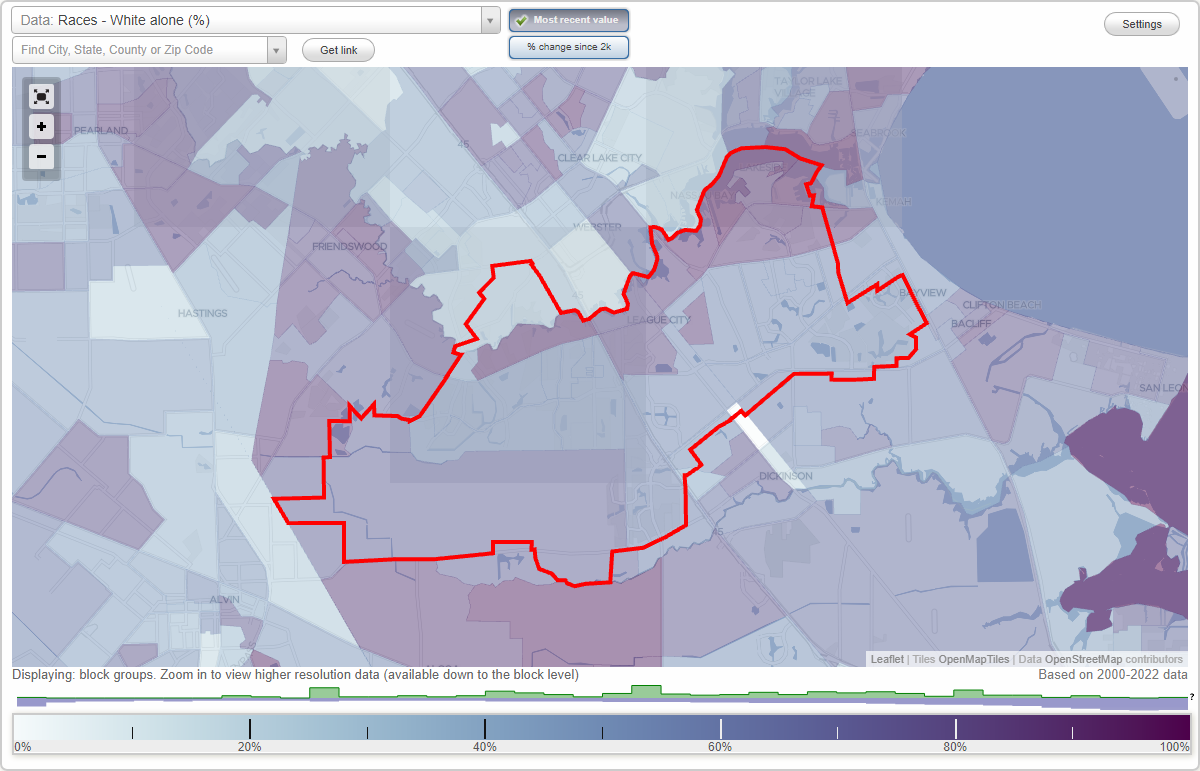
Races - White alone (%)
Races - White alone (% change since 2000)
Races - Black alone (%)
Races - Black alone (% change since 2000)
Races - American Indian alone (%)
Races - American Indian alone (% change since 2000)
Races - Asian alone (%)
Races - Asian alone (% change since 2000)
Races - Hispanic (%)
Races - Hispanic (% change since 2000)
Races - Native Hawaiian and Other Pacific Islander alone (%)
Races - Native Hawaiian and Other Pacific Islander alone (% change since 2000)
Races - Two or more races(%)
Races - Two or more races(% change since 2000)
Races - Other race alone (%)
Races - Other race alone (% change since 2000)
Racial diversity
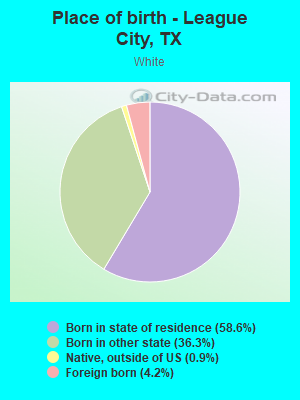
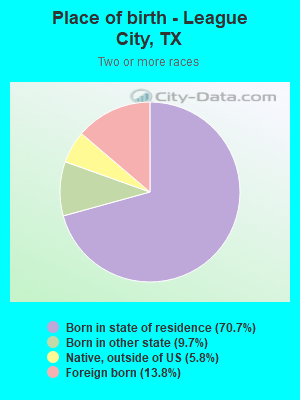
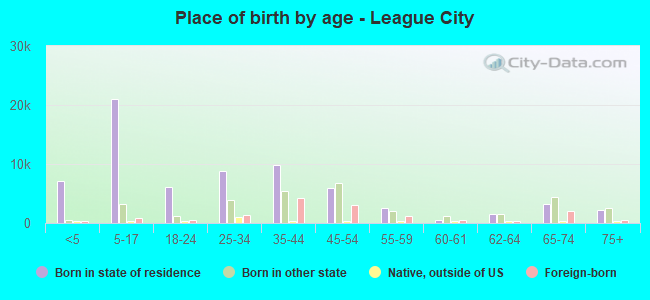
Place of birth - Born in state of residence (%)
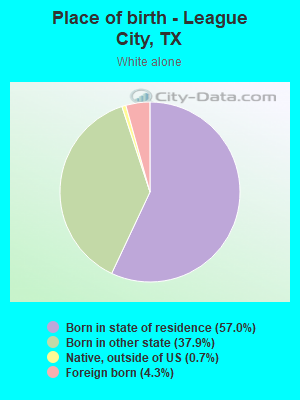
Place of birth - Born in state of residence (%) - White
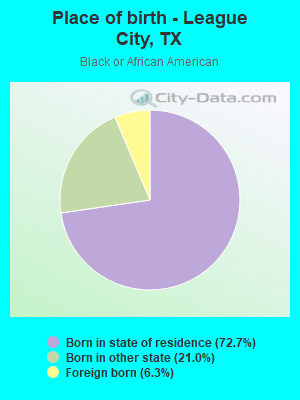
Place of birth - Born in state of residence (%) - Black or African American
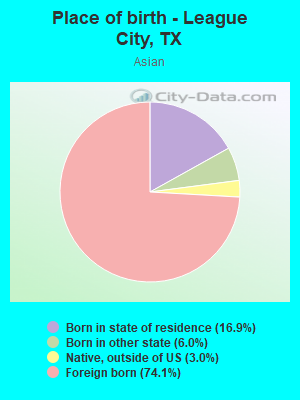
Place of birth - Born in state of residence (%) - Asian
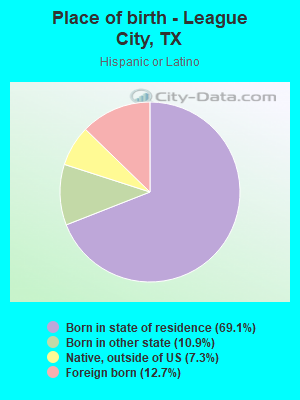
Place of birth - Born in state of residence (%) - Hispanic or Latino
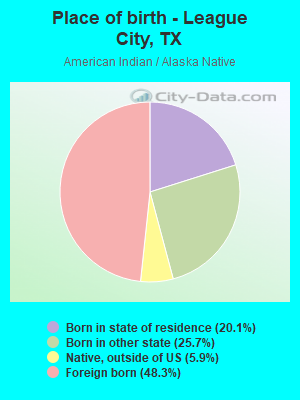
Place of birth - Born in state of residence (%) - American Indian and Alaska Native
Place of birth - Born in state of residence (%) - Multirace
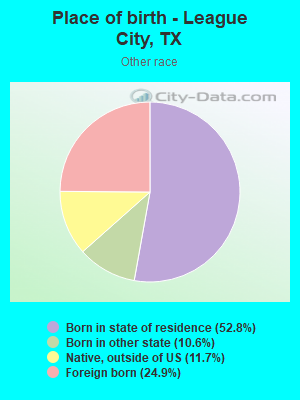
Place of birth - Born in state of residence (%) - Other Race
Place of birth - Born in other state (%)
Place of birth - Born in other state (%) - White
Place of birth - Born in other state (%) - Black or African American
Place of birth - Born in other state (%) - Asian
Place of birth - Born in other state (%) - Hispanic or Latino
Place of birth - Born in other state (%) - American Indian and Alaska Native
Place of birth - Born in other state (%) - Multirace
Place of birth - Born in other state (%) - Other Race
Place of birth - Native, outside of US (%)
Place of birth - Native, outside of US (%) - White
Place of birth - Native, outside of US (%) - Black or African American
Place of birth - Native, outside of US (%) - Asian
Place of birth - Native, outside of US (%) - Hispanic or Latino
Place of birth - Native, outside of US (%) - American Indian and Alaska Native
Place of birth - Native, outside of US (%) - Multirace
Place of birth - Native, outside of US (%) - Other Race
Place of birth - Foreign born (%)
Place of birth - Foreign born (%) - White
Place of birth - Foreign born (%) - Black or African American
Place of birth - Foreign born (%) - Asian
Place of birth - Foreign born (%) - Hispanic or Latino
Place of birth - Foreign born (%) - American Indian and Alaska Native
Place of birth - Foreign born (%) - Multirace
Place of birth - Foreign born (%) - Other Race
Residents speaking English at home (%)
Residents speaking English at home - Born in the United States (%)
Residents speaking English at home - Native, born elsewhere (%)
Residents speaking English at home - Foreign born (%)
Residents speaking Spanish at home (%)
Residents speaking Spanish at home - Born in the United States (%)
Residents speaking Spanish at home - Native, born elsewhere (%)
Residents speaking Spanish at home - Foreign born (%)
Residents speaking other language at home (%)
Residents speaking other language at home - Born in the United States (%)
Residents speaking other language at home - Native, born elsewhere (%)
Residents speaking other language at home - Foreign born (%)
Marital status - Never married (%)
Marital status - Now married (%)
Marital status - Separated (%)
Marital status - Widowed (%)
Marital status - Divorced (%)
Ancestries Reported - Arab (%)
Ancestries Reported - Czech (%)
Ancestries Reported - Danish (%)
Ancestries Reported - Dutch (%)
Ancestries Reported - English (%)
Ancestries Reported - French (%)
Ancestries Reported - French Canadian (%)
Ancestries Reported - German (%)
Ancestries Reported - Greek (%)
Ancestries Reported - Hungarian (%)
Ancestries Reported - Irish (%)
Ancestries Reported - Italian (%)
Ancestries Reported - Lithuanian (%)
Ancestries Reported - Norwegian (%)
Ancestries Reported - Polish (%)
Ancestries Reported - Portuguese (%)
Ancestries Reported - Russian (%)
Ancestries Reported - Scotch-Irish (%)
Ancestries Reported - Scottish (%)
Ancestries Reported - Slovak (%)
Ancestries Reported - Subsaharan African (%)
Ancestries Reported - Swedish (%)
Ancestries Reported - Swiss (%)
Ancestries Reported - Ukrainian (%)
Ancestries Reported - United States (%)
Ancestries Reported - Welsh (%)
Ancestries Reported - West Indian (%)
Ancestries Reported - Other (%)
Geographical mobility - Same house 1 year ago (%)
Geographical mobility - Same house 1 year ago (%) - White
Geographical mobility - Same house 1 year ago (%) - Black or African American
Geographical mobility - Same house 1 year ago (%) - Asian
Geographical mobility - Same house 1 year ago (%) - Hispanic or Latino
Geographical mobility - Same house 1 year ago (%) - American Indian and Alaska Native
Geographical mobility - Same house 1 year ago (%) - Multirace
Geographical mobility - Same house 1 year ago (%) - Other Race
Geographical mobility - Moved within same county (%)
Geographical mobility - Moved within same county (%) - White
Geographical mobility - Moved within same county (%) - Black or African American
Geographical mobility - Moved within same county (%) - Asian
Geographical mobility - Moved within same county (%) - Hispanic or Latino
Geographical mobility - Moved within same county (%) - American Indian and Alaska Native
Geographical mobility - Moved within same county (%) - Multirace
Geographical mobility - Moved within same county (%) - Other Race
Geographical mobility - Moved from different county within same state (%)
Geographical mobility - Moved from different county within same state (%) - White
Geographical mobility - Moved from different county within same state (%) - Black or African American
Geographical mobility - Moved from different county within same state (%) - Asian
Geographical mobility - Moved from different county within same state (%) - Hispanic or Latino
Geographical mobility - Moved from different county within same state (%) - American Indian and Alaska Native
Geographical mobility - Moved from different county within same state (%) - Multirace
Geographical mobility - Moved from different county within same state (%) - Other Race
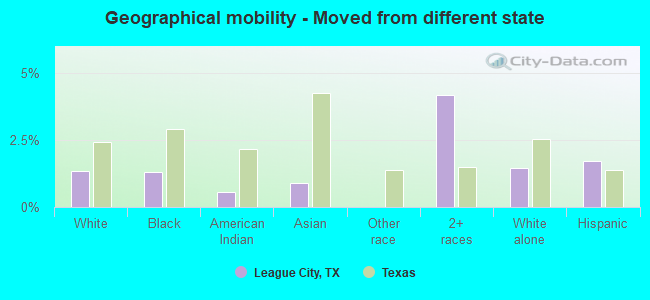
Geographical mobility - Moved from different state (%)
Geographical mobility - Moved from different state (%) - White
Geographical mobility - Moved from different state (%) - Black or African American
Geographical mobility - Moved from different state (%) - Asian
Geographical mobility - Moved from different state (%) - Hispanic or Latino
Geographical mobility - Moved from different state (%) - American Indian and Alaska Native
Geographical mobility - Moved from different state (%) - Multirace
Geographical mobility - Moved from different state (%) - Other Race
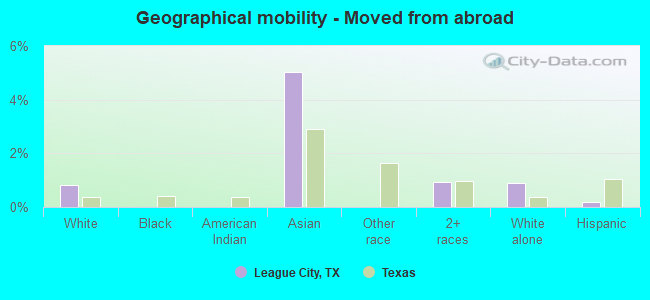
Geographical mobility - Moved from abroad (%)
Geographical mobility - Moved from abroad (%) - White
Geographical mobility - Moved from abroad (%) - Black or African American
Geographical mobility - Moved from abroad (%) - Asian
Geographical mobility - Moved from abroad (%) - Hispanic or Latino
Geographical mobility - Moved from abroad (%) - American Indian and Alaska Native
Geographical mobility - Moved from abroad (%) - Multirace
Geographical mobility - Moved from abroad (%) - Other Race
Place of birth for the foreign-born population - Ireland (%)
Place of birth for the foreign-born population - Denmark (%)
Place of birth for the foreign-born population - Norway (%)
Place of birth for the foreign-born population - Sweden (%)
Place of birth for the foreign-born population - United Kingdom (%)
Place of birth for the foreign-born population - England (%)
Place of birth for the foreign-born population - Scotland (%)
Place of birth for the foreign-born population - Other Northern Europe (%)
Place of birth for the foreign-born population - Austria (%)
Place of birth for the foreign-born population - Belgium (%)
Place of birth for the foreign-born population - France (%)
Place of birth for the foreign-born population - Germany (%)
Place of birth for the foreign-born population - Netherlands (%)
Place of birth for the foreign-born population - Switzerland (%)
Place of birth for the foreign-born population - Other Western Europe (%)
Place of birth for the foreign-born population - Greece (%)
Place of birth for the foreign-born population - Italy (%)
Place of birth for the foreign-born population - Portugal (%)
Place of birth for the foreign-born population - Spain (%)
Place of birth for the foreign-born population - Other Southern Europe (%)
Place of birth for the foreign-born population - Albania (%)
Place of birth for the foreign-born population - Belarus (%)
Place of birth for the foreign-born population - Bosnia and Herzegovina (%)
Place of birth for the foreign-born population - Bulgaria (%)
Place of birth for the foreign-born population - Croatia (%)
Place of birth for the foreign-born population - Czechoslovakia (%)
Place of birth for the foreign-born population - Hungary (%)
Place of birth for the foreign-born population - Latvia (%)
Place of birth for the foreign-born population - Lithuania (%)
Place of birth for the foreign-born population - North Macedonia (Macedonia) (%)
Place of birth for the foreign-born population - Moldova (%)
Place of birth for the foreign-born population - Poland (%)
Place of birth for the foreign-born population - Romania (%)
Place of birth for the foreign-born population - Russia (%)
Place of birth for the foreign-born population - Serbia (%)
Place of birth for the foreign-born population - Ukraine (%)
Place of birth for the foreign-born population - Other Eastern Europe (%)
Place of birth for the foreign-born population - China (%)
Place of birth for the foreign-born population - Hong Kong (%)
Place of birth for the foreign-born population - Taiwan (%)
Place of birth for the foreign-born population - Japan (%)
Place of birth for the foreign-born population - Korea (%)
Place of birth for the foreign-born population - Other Eastern Asia (%)
Place of birth for the foreign-born population - Afghanistan (%)
Place of birth for the foreign-born population - Bangladesh (%)
Place of birth for the foreign-born population - India (%)
Place of birth for the foreign-born population - Iran (%)
Place of birth for the foreign-born population - Kazakhstan (%)
Place of birth for the foreign-born population - Nepal (%)
Place of birth for the foreign-born population - Pakistan (%)
Place of birth for the foreign-born population - Sri Lanka (%)
Place of birth for the foreign-born population - Uzbekistan (%)
Place of birth for the foreign-born population - Other South Central Asia (%)
Place of birth for the foreign-born population - Burma (%)
Place of birth for the foreign-born population - Cambodia (%)
Place of birth for the foreign-born population - Indonesia (%)
Place of birth for the foreign-born population - Laos (%)
Place of birth for the foreign-born population - Malaysia (%)
Place of birth for the foreign-born population - Philippines (%)
Place of birth for the foreign-born population - Singapore (%)
Place of birth for the foreign-born population - Thailand (%)
Place of birth for the foreign-born population - Vietnam (%)
Place of birth for the foreign-born population - Other South Eastern Asia (%)
Place of birth for the foreign-born population - Armenia (%)
Place of birth for the foreign-born population - Iraq (%)
Place of birth for the foreign-born population - Israel (%)
Place of birth for the foreign-born population - Jordan (%)
Place of birth for the foreign-born population - Kuwait (%)
Place of birth for the foreign-born population - Lebanon (%)
Place of birth for the foreign-born population - Saudi Arabia (%)
Place of birth for the foreign-born population - Syria (%)
Place of birth for the foreign-born population - Turkey (%)
Place of birth for the foreign-born population - Yemen (%)
Place of birth for the foreign-born population - Other Western Asia (%)
Place of birth for the foreign-born population - Eritrea (%)
Place of birth for the foreign-born population - Ethiopia (%)
Place of birth for the foreign-born population - Kenya (%)
Place of birth for the foreign-born population - Somalia (%)
Place of birth for the foreign-born population - Uganda (%)
Place of birth for the foreign-born population - Zimbabwe (%)
Place of birth for the foreign-born population - Other Eastern Africa (%)
Place of birth for the foreign-born population - Cameroon (%)
Place of birth for the foreign-born population - Congo (%)
Place of birth for the foreign-born population - Democratic Republic of Congo (Zaire) (%)
Place of birth for the foreign-born population - Other Middle Africa (%)
Place of birth for the foreign-born population - Egypt (%)
Place of birth for the foreign-born population - Morocco (%)
Place of birth for the foreign-born population - Sudan (%)
Place of birth for the foreign-born population - Other Northern Africa (%)
Place of birth for the foreign-born population - South Africa (%)
Place of birth for the foreign-born population - Other Southern Africa (%)
Place of birth for the foreign-born population - Cabo Verde (%)
Place of birth for the foreign-born population - Ghana (%)
Place of birth for the foreign-born population - Liberia (%)
Place of birth for the foreign-born population - Nigeria (%)
Place of birth for the foreign-born population - Senegal (%)
Place of birth for the foreign-born population - Sierra Leone (%)
Place of birth for the foreign-born population - Other Western Africa (%)
Place of birth for the foreign-born population - Australia (%)
Place of birth for the foreign-born population - New Zealand (%)
Place of birth for the foreign-born population - Fiji (%)
Place of birth for the foreign-born population - Micronesia (%)
Place of birth for the foreign-born population - Bahamas (%)
Place of birth for the foreign-born population - Barbados (%)
Place of birth for the foreign-born population - Cuba (%)
Place of birth for the foreign-born population - Dominica (%)
Place of birth for the foreign-born population - Dominican Republic (%)
Place of birth for the foreign-born population - Grenada (%)
Place of birth for the foreign-born population - Haiti (%)
Place of birth for the foreign-born population - Jamaica (%)
Place of birth for the foreign-born population - St. Vincent and the Grenadines (%)
Place of birth for the foreign-born population - Trinidad and Tobago (%)
Place of birth for the foreign-born population - West Indies (%)
Place of birth for the foreign-born population - Other Caribbean (%)
Place of birth for the foreign-born population - Belize (%)
Place of birth for the foreign-born population - Costa Rica (%)
Place of birth for the foreign-born population - El Salvador (%)
Place of birth for the foreign-born population - Guatemala (%)
Place of birth for the foreign-born population - Honduras (%)
Place of birth for the foreign-born population - Mexico (%)
Place of birth for the foreign-born population - Nicaragua (%)
Place of birth for the foreign-born population - Panama (%)
Place of birth for the foreign-born population - Other Central America (%)
Place of birth for the foreign-born population - Argentina (%)
Place of birth for the foreign-born population - Bolivia (%)
Place of birth for the foreign-born population - Brazil (%)
Place of birth for the foreign-born population - Chile (%)
Place of birth for the foreign-born population - Colombia (%)
Place of birth for the foreign-born population - Ecuador (%)
Place of birth for the foreign-born population - Guyana (%)
Place of birth for the foreign-born population - Peru (%)
Place of birth for the foreign-born population - Uruguay (%)
Place of birth for the foreign-born population - Venezuela (%)
Place of birth for the foreign-born population - Other South America (%)
Place of birth for the foreign-born population - Canada (%)
Place of birth for the foreign-born population - Other Northern America (%)
Place of birth for the foreign-born population - Other (%)
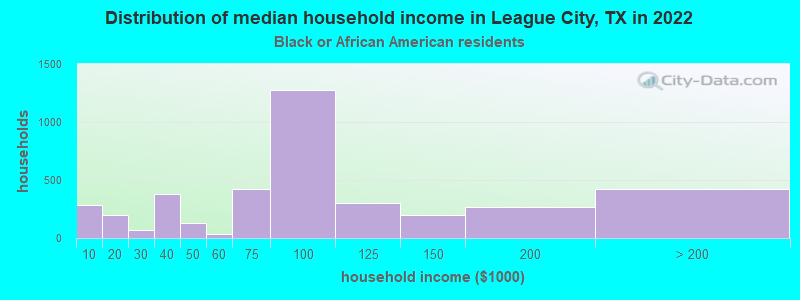
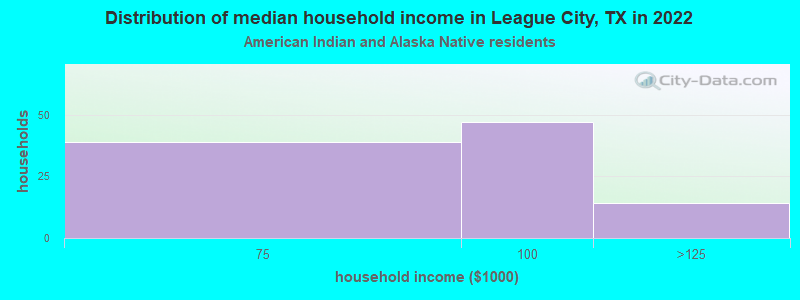
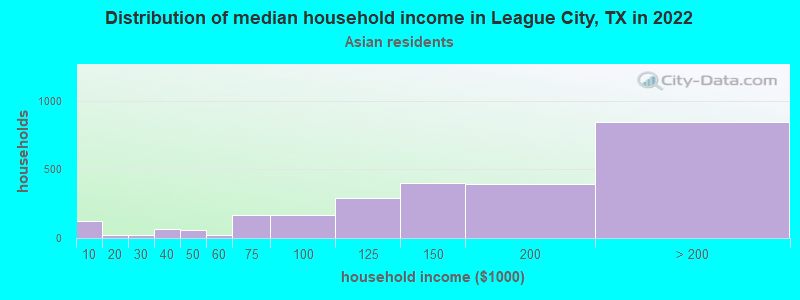
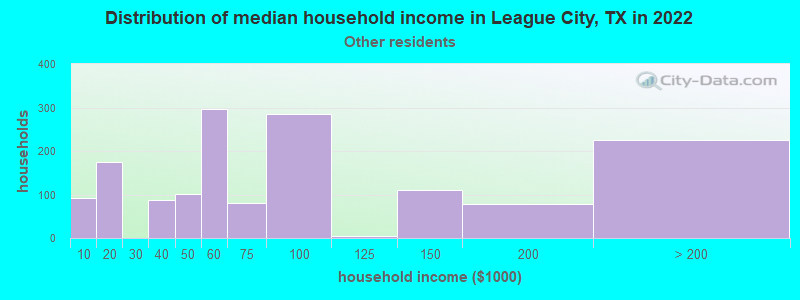
According to 2022 data, the most numerous races in League City, TX are Hispanic (26,478 residents), White alone (70,434 residents), and Black alone (7,707 residents). 81.0% of League City residents speak English at home. 12.1% of League City, TX residents are foreign-born (4.8% born in Latin America, 4.4% born in Asia), which is 40.3% less than the foreign-born rate of 17.0% across the entire state of Texas.
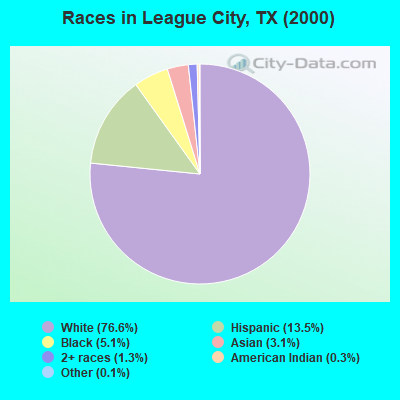
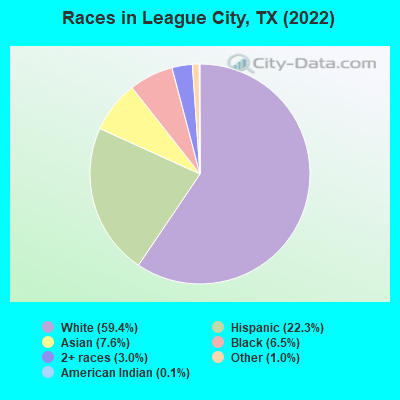
Race distribution in League City
2000 2022
34,807 76.6% White alone 6,130 13.5% Hispanic 2,297 5.1% Black alone 1,419 3.1% Asian alone 579 1.3% Two or more races 128 0.3% American Indian alone 63 0.1% Other race alone 21 0.05% Native Hawaiian and Other
70,434 59.4% White alone 26,478 22.3% Hispanic 9,043 7.6% Asian alone 7,707 6.5% Black alone 3,591 3.0% Two or more races 1,175 1.0% Other race alone 122 0.1% American Indian alone
2000 2022
10,933,313 52.4% White alone 6,669,666 32.0% Hispanic 2,364,255 11.3% Black alone 554,445 2.7% Asian alone 230,567 1.1% Two or more races 68,859 0.3% American Indian alone 19,958 0.10% Other race alone 10,757 0.05% Native Hawaiian and Other
12,070,642 40.2% Hispanic 11,683,430 38.9% White alone 3,508,706 11.7% Black alone 1,608,173 5.4% Asian alone 956,560 3.2% Two or more races 125,763 0.4% Other race alone 47,023 0.2% American Indian alone 29,275 0.10% Native Hawaiian and Other
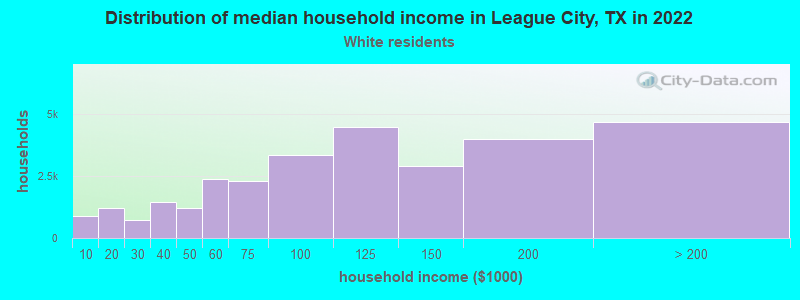
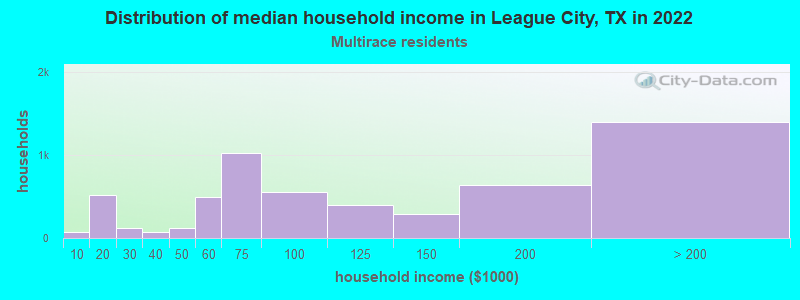
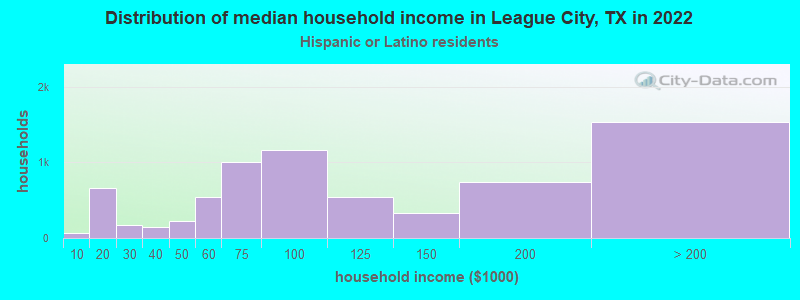
Income and house value in League City Median household income in 2022 $111,473 White non-Hispanic householders$70,434 Black householders$124,588 Asian householders$86,520 Some other race householders$107,234 Two or more races householders$96,792 Hispanic or Latino race householdersMedian 2022 house value $362,810 White Non-Hispanic householders$419,910 Black or African American householders$266,574 American Indian or Alaska Native householders $375,000 Asian householders$252,780 Some other race householders$277,160 Two or more races householders$280,689 Hispanic or Latino householders
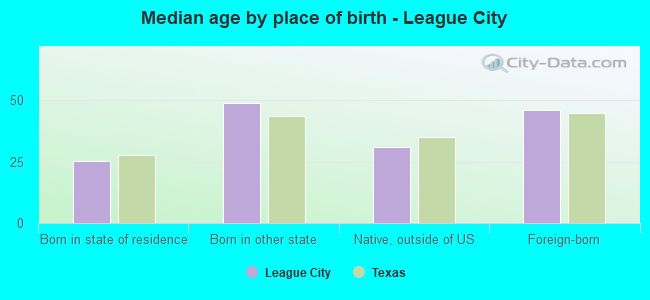
Median age by race in League City
37.1 Median age for White residents37.4 36.5 37.4 Median age for Black or African American residents21.9 46.3 53.2 Median age for American Indian / Alaska Native residents51.7 53.7 40.9 Median age for Asian residents40.1 44.7 -666,666,666.0 Median age for Native Hawaiian / Pacific Islander residents-666,666,666.0 -666,666,666.0 34.3 Median age for Other race residents35.6 32.9 28.5 Median age for Two or more races residents28.6 28.5 37.9 Median age for White alone residents38.0 37.9 29.0 Median age for Hispanic or Latino residents31.2 28.4
Owner/renter occupied households by race in League City
House owners and renters - White residents 21,849 74.2% Owner occupied7,578 25.8% Renter occupiedHouse owners and renters - Black or African American residents 2,063 59.0% Owner occupied1,434 41.0% Renter occupiedHouse owners and renters - American Indian / Alaska Native residents 105 100.0% Owner occupiedHouse owners and renters - Asian residents 2,631 82.5% Owner occupied557 17.5% Renter occupiedHouse owners and renters - Other race residents 1,773 77.3% Owner occupied522 22.7% Renter occupiedHouse owners and renters - Two or more races residents 4,075 77.3% Owner occupied1,198 22.7% Renter occupiedHouse owners and renters - White alone residents 20,513 74.6% Owner occupied6,993 25.4% Renter occupiedHouse owners and renters - Hispanic or Latino residents 5,795 74.1% Owner occupied2,022 25.9% Renter occupied
Language usage in League City
English speakers - Total 81.0% of residents of League City speak English at home.
9.8% of residents speak Spanish at home 8,420 77.8% Speak English very well2,403 22.2% Speak English less than very well9.2% of residents speak other language at home 6,863 67.0% Speak English very well3,373 33.0% Speak English less than very well
English speakers - Born in the United States 95.8% of residents of League City speak English at home.
2.5% of residents speak Spanish at home 776 97.4% Speak English very well21 2.6% Speak English less than very well1.8% of residents speak other language at home 562 100.0% Speak English very well
English speakers - Native, born elsewhere 56.4% of residents of League City speak English at home.
33.3% of residents speak Spanish at home 552 63.5% Speak English very well317 36.5% Speak English less than very well10.3% of residents speak other language at home 268 100.0% Speak English very well
English speakers - Foreign-born 23.6% of residents of League City speak English at home.
22.8% of residents speak Spanish at home 2,101 63.3% Speak English very well1,218 36.7% Speak English less than very well53.6% of residents speak other language at home 4,498 57.6% Speak English very well3,316 42.4% Speak English less than very well
White (Caucasian) - Speak only English Native:
96.8% (65,614)Foreign-born:
55.8% (1,803)
White (Caucasian) - Speak another language Native:
3.2% (2,189)Foreign-born:
44.2% (1,428)
Black or African American - Speak only English Native:
94.7% (7,185)Foreign-born:
55.0% (740)
Black or African American - Speak another language Native:
4.8% (367)Foreign-born:
17.2% (231)
Asian - Speak only English Native:
34.9% (737)Foreign-born:
12.6% (845)
Asian - Speak another language Native:
65.1% (1,372)Foreign-born:
87.4% (5,855)
Other race - Speak only English Native:
67.3% (2,961)Foreign-born:
3.9% (64)
Other race - Speak another language Native:
32.7% (1,441)Foreign-born:
96.1% (1,558)
Two or more races - Speak only English Native:
70.6% (10,175)Foreign-born:
20.7% (515)
Two or more races - Speak another language Native:
29.4% (4,231)Foreign-born:
79.3% (1,977)
White alone - Speak only English Native:
98.8% (62,282)Foreign-born:
57.8% (1,758)
White alone - Speak another language Native:
1.2% (734)Foreign-born:
42.2% (1,286)
Hispanic or Latino - Speak only English Native:
66.6% (13,502)Foreign-born:
6.9% (232)
Hispanic or Latino - Speak another language Native:
33.4% (6,760)Foreign-born:
93.1% (3,136)
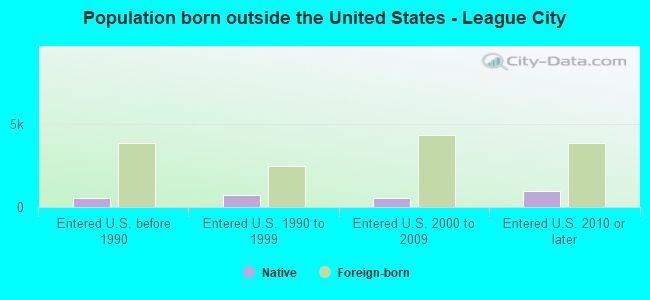
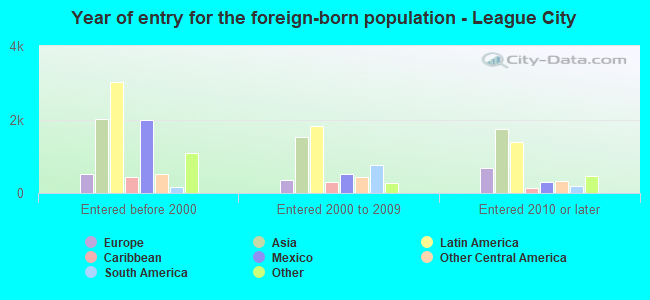
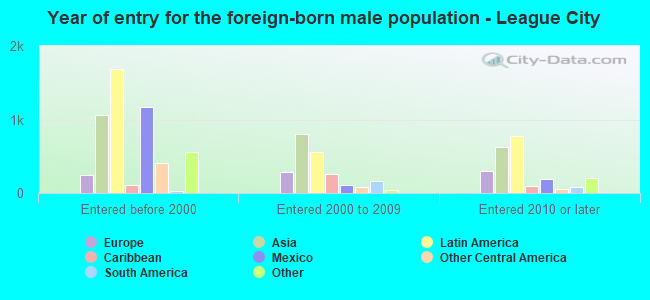
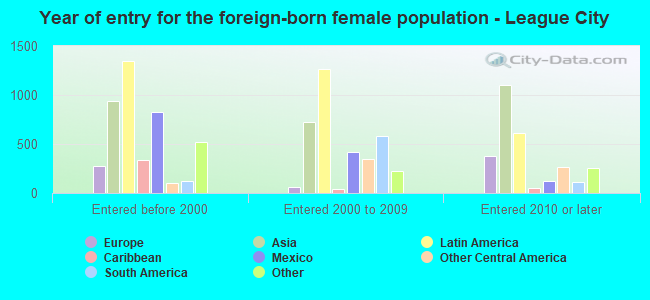
Foreign-born residents in League City 13,998 residents are foreign born (4.8% Latin America , 4.4% Asia ).
This city:
12.1%Texas:
17.1%
Marital status for residents in League City Marital status - White (Caucasian) population 15 years and over
Males 25.8% Never married64.9% Now married0.1% Separated2.5% Widowed6.8% DivorcedFemales 19.7% Never married61.2% Now married2.9% Separated7.0% Widowed9.2% DivorcedWomen who gave birth in the past 12 months Now married:
100.0% (1,013)Unmarried:
0.0% (0)
Women who did not give birth in the past 12 months Now married:
65.7% (10,518)Unmarried:
34.3% (5,492)
Marital status - Black or African American population 15 years and over
Males 34.1% Never married59.1% Now married0.2% Separated1.0% Widowed5.6% DivorcedFemales 33.1% Never married39.5% Now married5.0% Separated3.0% Widowed19.4% DivorcedWomen who gave birth in the past 12 months Now married:
74.7% (357)Unmarried:
25.3% (121)
Women who did not give birth in the past 12 months Now married:
35.4% (784)Unmarried:
64.6% (1,431)
Marital status - American Indian / Alaska Native population 15 years and over
Males 15.9% Never married81.4% Now married0.0% Separated2.7% Widowed0.0% DivorcedFemales 2.4% Never married97.6% Now married0.0% Separated0.0% Widowed0.0% DivorcedWomen who did not give birth in the past 12 months Now married:
83.3% (14)Unmarried:
16.7% (3)
Marital status - Asian population 15 years and over
Males 28.5% Never married64.1% Now married0.0% Separated4.6% Widowed2.8% DivorcedFemales 13.0% Never married68.5% Now married0.0% Separated16.7% Widowed1.8% DivorcedWomen who gave birth in the past 12 months Now married:
100.0% (129)Unmarried:
0.0% (0)
Women who did not give birth in the past 12 months Now married:
62.3% (1,539)Unmarried:
37.7% (932)
Marital status - Other race population 15 years and over
Males 42.4% Never married54.9% Now married0.0% Separated0.0% Widowed2.8% DivorcedFemales 17.6% Never married66.1% Now married3.8% Separated1.8% Widowed10.7% DivorcedWomen who gave birth in the past 12 months Now married:
100.0% (100)Unmarried:
0.0% (0)
Women who did not give birth in the past 12 months Now married:
66.0% (1,138)Unmarried:
34.0% (587)
Marital status - Two or more races population 15 years and over
Males 30.8% Never married63.9% Now married0.7% Separated0.0% Widowed4.6% DivorcedFemales 30.2% Never married60.5% Now married0.0% Separated1.5% Widowed7.9% DivorcedWomen who gave birth in the past 12 months Now married:
100.0% (64)Unmarried:
0.0% (0)
Women who did not give birth in the past 12 months Now married:
56.2% (2,037)Unmarried:
43.8% (1,589)
Marital status - White alone, not Hispanic / Latino population 15 years and over
Males 25.6% Never married65.7% Now married0.1% Separated2.5% Widowed6.2% DivorcedFemales 18.2% Never married61.8% Now married2.9% Separated7.3% Widowed9.8% DivorcedWomen who gave birth in the past 12 months Now married:
100.0% (811)Unmarried:
0.0% (0)
Women who did not give birth in the past 12 months Now married:
67.2% (9,529)Unmarried:
32.8% (4,653)
Marital status - Hispanic or Latino population 15 years and over
Males 35.5% Never married58.0% Now married0.5% Separated0.4% Widowed5.6% DivorcedFemales 26.7% Never married61.6% Now married4.8% Separated1.9% Widowed5.0% DivorcedWomen who gave birth in the past 12 months Now married:
100.0% (415)Unmarried:
0.0% (0)
Women who did not give birth in the past 12 months Now married:
63.8% (4,515)Unmarried:
36.2% (2,561)
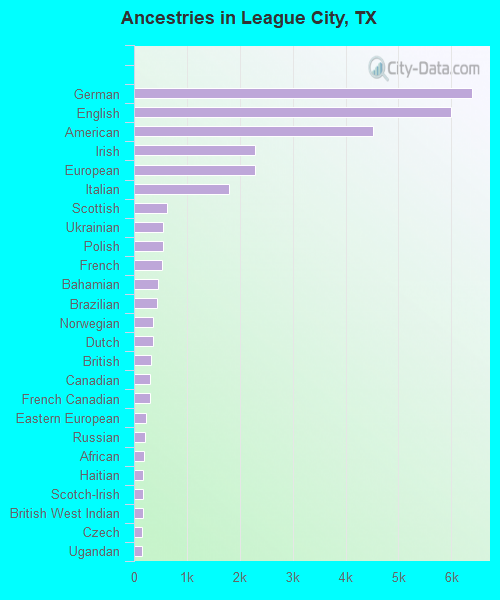
Ancestries in League City
6,393 11.7% German6,001 10.9% English4,523 8.2% American2,291 4.2% Irish2,287 4.2% European1,795 3.3% Italian632 1.2% Scottish551 1.0% Ukrainian549 1.0% Polish526 1.0% French460 0.8% Bahamian432 0.8% Brazilian357 0.7% Norwegian352 0.6% Dutch315 0.6% British310 0.6% Canadian308 0.6% French Canadian219 0.4% Eastern European205 0.4% Russian197 0.4% African173 0.3% Haitian168 0.3% Scotch-Irish167 0.3% British West Indian152 0.3% Czech146 0.3% Ugandan143 0.3% Swedish116 0.2% Hungarian101 0.2% Romanian101 0.2% Welsh99 0.2% Greek99 0.2% Nigerian99 0.2% Scandinavian96 0.2% Lebanese79 0.1% Iranian79 0.1% Trinidadian and Tobagonian67 0.1% Portuguese58 0.1% West Indian57 0.1% Australian43 0.08% Cajun41 0.07% Icelander41 0.07% Turkish40 0.07% Croatian33 0.06% Kenyan31 0.06% Yugoslavian30 0.05% Iraqi28 0.05% Slovene27 0.05% Latvian26 0.05% Danish22 0.04% Albanian22 0.04% Belizean19 0.03% Sierra Leonean17 0.03% Egyptian12 0.02% Assyrian9 0.02% Jamaican8 0.01% Northern European8 0.01% Austrian8 0.01% Serbian7 0.01% Finnish7 0.01% Belgian5 0.01% Swiss5 0.01% Lithuanian5 0.01% Dutch West Indian
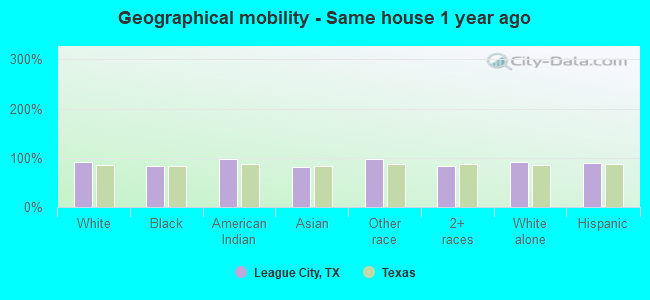
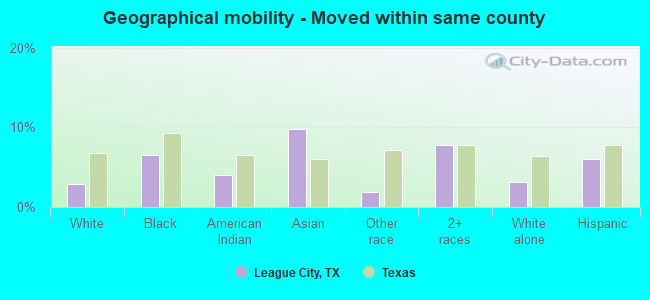
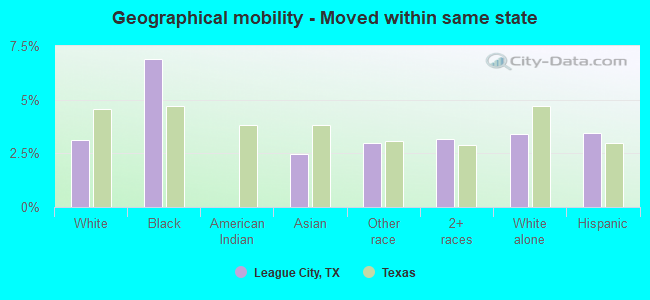
Geographical mobility in League City Same house 1 year ago 69,595 91.8% White (Caucasian)7,619 83.0% Black or African American551 97.1% American Indian / Alaska Native6,014 80.9% Asian5,524 96.8% Other race14,789 83.6% Two or more races63,607 91.1% White alone, not Hispanic / Latino20,747 89.5% Hispanic or LatinoMoved within same county 2,185 2.9% White / Caucasian600 6.5% Black or African American23 4.0% American Indian / Alaska Native729 9.8% Asian105 1.8% Other race1,369 7.7% Two or more races2,185 3.1% White alone, not Hispanic / Latino1,407 6.1% Hispanic or LatinoMoved within same state 2,369 3.1% White / Caucasian633 6.9% Black or African American184 2.5% Asian171 3.0% Other race564 3.2% Two or more races2,369 3.4% White alone, not Hispanic / Latino796 3.4% Hispanic or LatinoMoved from different state 1,011 1.3% White / Caucasian119 1.3% Black or African American3 0.6% American Indian / Alaska Native66 0.9% Asian736 4.2% Two or more races1,011 1.4% White alone, not Hispanic / Latino396 1.7% Hispanic or LatinoMoved from abroad 617 0.8% White373 5.0% Asian165 0.9% Two or more races617 0.9% White alone, not Hispanic / Latino39 0.2% Hispanic or Latino
Children Nativity (place of birth) in League City
Children under 6 years - Living with two parents Both parents native 7,994 100.0% NativeBoth parents foreign-born 584 100.0% NativeOne native, one foreign-born parent 1,084 100.0% NativeChildren under 6 years - Living with one parent Native parent 720 100.0% NativeForeign-born parent 46 100.0% NativeChildren 6 to 17 years - Living with two parents Both parents native 14,808 100.0% NativeBoth parents foreign-born 2,622 81.7% Native587 18.3% Foreign-bornOne native, one foreign-born parent 1,688 100.0% NativeChildren 6 to 17 years - Living with one parent Native parent 2,337 92.7% Native185 7.3% Foreign-bornForeign-born parent 185 100.0% Native
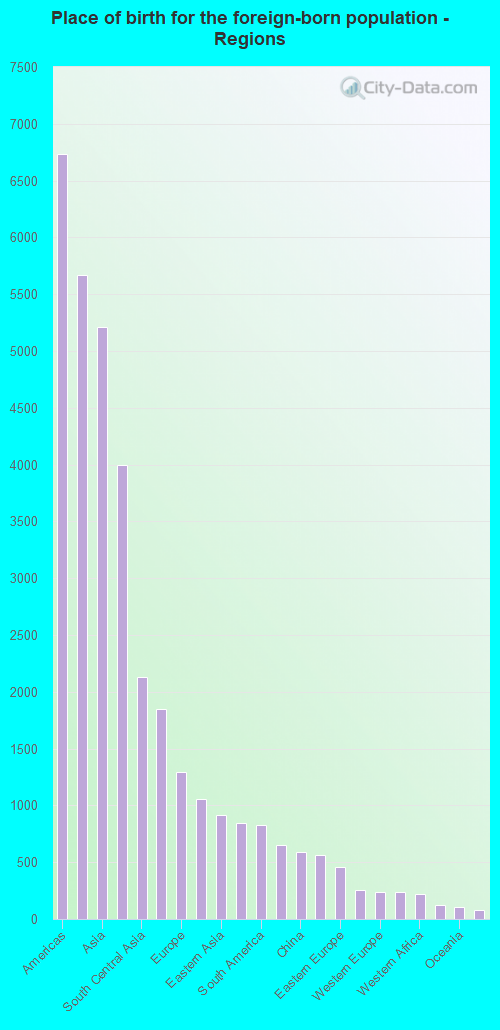
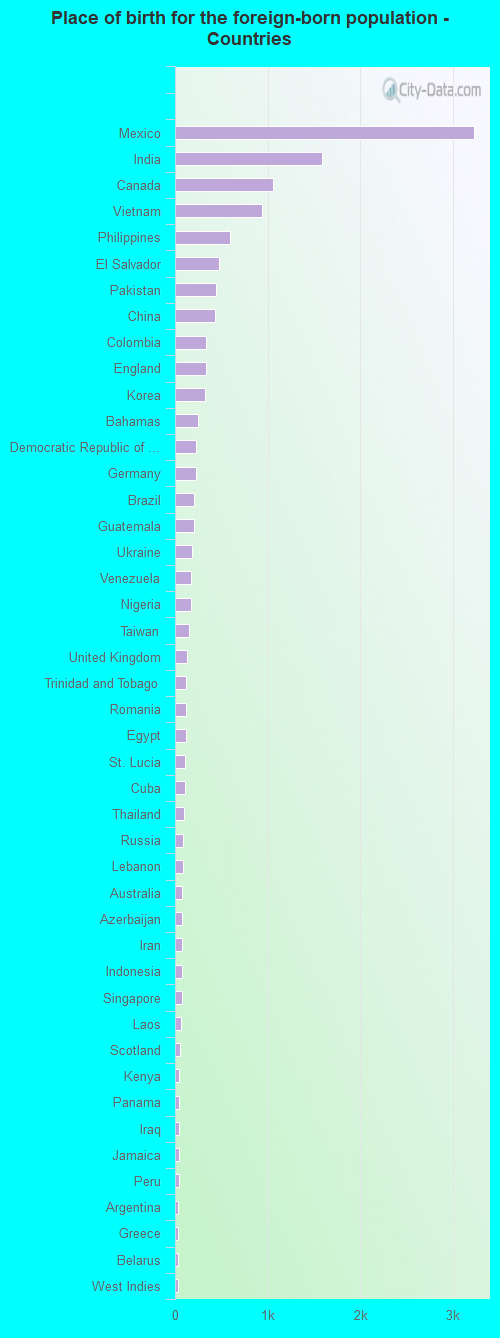
Place of birth for residents in League City 6,730 Americas5,669 Latin America5,212 Asia3,995 Central America2,133 South Central Asia1,848 South Eastern Asia1,292 Europe1,060 Northern America913 Eastern Asia849 Caribbean824 South America654 Africa587 China563 Northern Europe459 Eastern Europe257 Western Asia239 Western Europe235 Middle Africa219 Western Africa119 Northern Africa108 Oceania79 Australia and New Zealand Subregion48 Eastern Africa30 Southern Europe26 Southern Africa3,230 Mexico1,583 India1,060 Canada940 Vietnam590 Philippines477 El Salvador443 Pakistan435 China336 Colombia330 England325 Korea253 Bahamas226 Democratic Republic of Congo (Zaire)222 Germany203 Brazil201 Guatemala185 Ukraine175 Venezuela169 Nigeria152 Taiwan127 United Kingdom124 Trinidad and Tobago122 Romania119 Egypt110 St. Lucia109 Cuba98 Thailand87 Russia83 Lebanon79 Australia78 Azerbaijan77 Iran76 Indonesia71 Singapore65 Laos49 Scotland48 Kenya48 Panama48 Iraq47 Jamaica43 Peru37 Argentina30 Greece30 Belarus30 West Indies29 Kazakhstan27 Nicaragua26 South Africa26 Dominican Republic25 Sierra Leone25 Albania24 Turkey23 Ghana20 Ecuador18 Denmark17 Armenia16 Netherlands9 Haiti9 Honduras8 Cameroon8 Bolivia8 Poland5 Malaysia3 Kuwait
Grandparents responsible for own grandchildren in League City
Grandparents (30 to 59 years) White / Caucasian 14 19.4% Responsible for grandchildren58 80.6% Not responsible for grandchildrenBlack or African American 49 100.0% Not responsible for grandchildrenAsian 13 100.0% Not responsible for grandchildrenOther race 13 50.5% Responsible for grandchildren13 49.5% Not responsible for grandchildrenTwo or more races 259 100.0% Not responsible for grandchildrenWhite alone, not Hispanic / Latino 14 17.1% Responsible for grandchildren69 82.9% Not responsible for grandchildrenHispanic or Latino 13 9.0% Responsible for grandchildren128 91.0% Not responsible for grandchildrenGrandparents (60 years and over) White / Caucasian 99 32.5% Responsible for grandchildren205 67.5% Not responsible for grandchildrenBlack or African American 137 100.0% Not responsible for grandchildrenAsian 10 7.9% Responsible for grandchildren120 92.1% Not responsible for grandchildrenOther race 77 100.0% Not responsible for grandchildrenTwo or more races 38 100.0% Not responsible for grandchildrenWhite alone, not Hispanic / Latino 94 32.1% Responsible for grandchildren199 67.9% Not responsible for grandchildrenHispanic or Latino 43 15.5% Responsible for grandchildren235 84.5% Not responsible for grandchildren