Races in Lyme, New Hampshire (NH) Detailed Stats
Ancestries, Foreign-born residents, place of birth

Recent posts about races in Lyme, New Hampshire on our local forum with over 2,400,000 registered users:
 | Lyme Disease help (9 replies) |
| Relocation suggestions (30 replies) |
| Lyme Disease for Newbies (22 replies) |
| First visit to NH (28 replies) |
| AP Article: After an absence, New England’s ticks are back — and hungry (1 reply) |
| Some ideas for relocation? (18 replies) |
Latest news about races in Lyme, NH collected exclusively by city-data.com from local newspapers, TV, and radio stations
2.6% of Lyme, NH residents are foreign-born (1.3% born in Europe, 0.8% born in Asia, 0.4% born in North America), which is 95.2% less than the foreign-born rate of 5.0% across the entire state of New Hampshire.
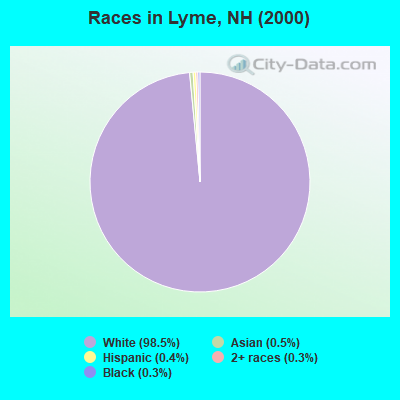
Race distribution in Lyme

- 1,65398.5%White alone
- 90.5%Asian alone
- 60.4%Hispanic
- 50.3%Two or more races
- 50.3%Black alone
- 10.06%American Indian alone
2000
2022
-
- 1,175,25295.1%White alone
- 20,4891.7%Hispanic
- 15,8031.3%Asian alone
- 11,6060.9%Two or more races
- 8,3540.7%Black alone
- 2,6980.2%American Indian alone
- 1,2540.1%Other race alone
- 3300.03%Native Hawaiian and Other
Pacific Islander alone

-
- 1,208,10186.6%White alone
- 63,4794.5%Hispanic
- 60,7244.4%Two or more races
- 36,5192.6%Asian alone
- 17,9311.3%Black alone
- 6,6150.5%Other race alone
- 1,0140.07%American Indian alone
- 8480.06%Native Hawaiian and Other
Pacific Islander alone

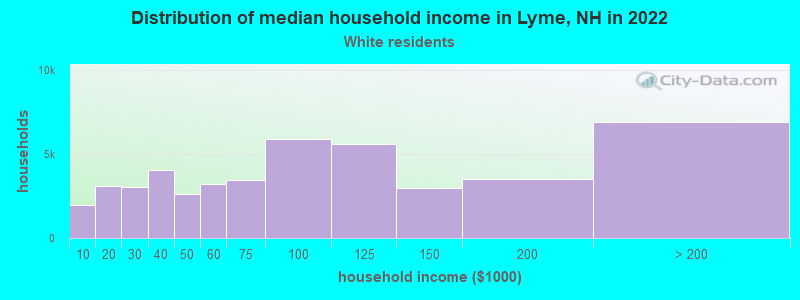
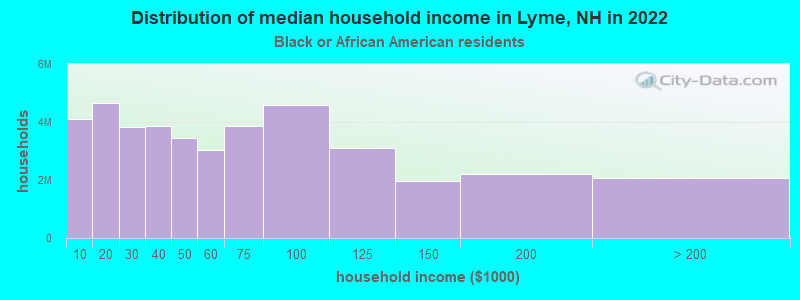
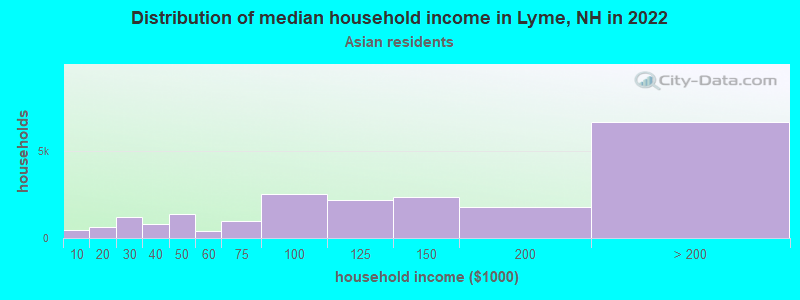
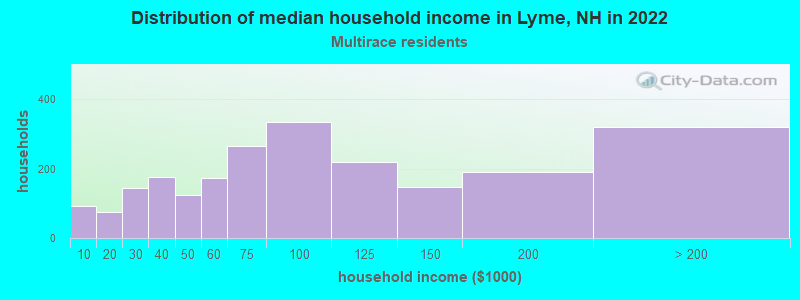
Income and house value in Lyme
- Median household income in 2022
- $110,000White non-Hispanic householders
- over $200,000Asian householders
- $19,814Two or more races householders
- Median 2022 house value
- $527,057White Non-Hispanic householders
- $852,433Black or African American householders
- $719,150Asian householders
Household income for White non-Hispanic householders
Household income for Black householders
Household income for Asian householders
Household income for Two or more races householders
Foreign-born residents in Lyme
43 residents are foreign born (1.3% Europe, 0.8% Asia, 0.4% North America).
| This city: | 2.6% |
| New Hampshire: | 4.4% |
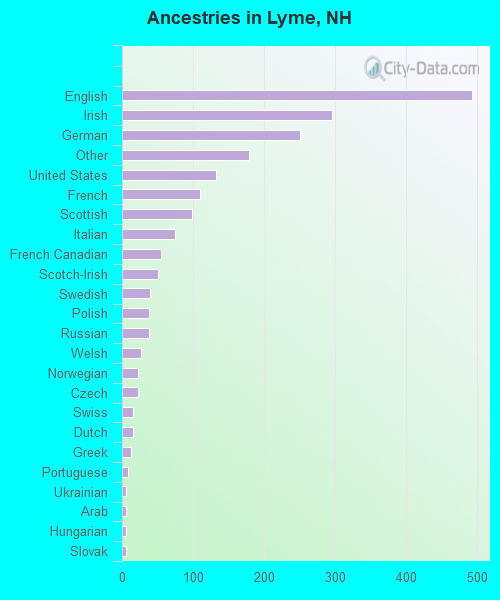
Ancestries in Lyme

- 49224.6%English
- 29514.7%Irish
- 25012.5%German
- 1798.9%Other
- 1326.6%United States
- 1105.5%French
- 994.9%Scottish
- 743.7%Italian
- 552.7%French Canadian
- 502.5%Scotch-Irish
- 402.0%Swedish
- 381.9%Polish
- 381.9%Russian
- 271.3%Welsh
- 231.1%Norwegian
- 221.1%Czech
- 160.8%Swiss
- 150.7%Dutch
- 120.6%Greek
- 90.4%Portuguese
- 60.3%Ukrainian
- 50.2%Arab
- 50.2%Hungarian
- 50.2%Slovak
- 30.1%Danish
- 20.10%Lithuanian
Zip codes: 03768.