Races in Mansfield, Ohio (OH) Detailed Stats
Data:
Races - White alone (%)
Races - White alone (% change since 2000)
Races - Black alone (%)
Races - Black alone (% change since 2000)
Races - American Indian alone (%)
Races - American Indian alone (% change since 2000)
Races - Asian alone (%)
Races - Asian alone (% change since 2000)
Races - Hispanic (%)
Races - Hispanic (% change since 2000)
Races - Native Hawaiian and Other Pacific Islander alone (%)
Races - Native Hawaiian and Other Pacific Islander alone (% change since 2000)
Races - Two or more races(%)
Races - Two or more races(% change since 2000)
Races - Other race alone (%)
Races - Other race alone (% change since 2000)
Racial diversity
Place of birth - Born in state of residence (%)
Place of birth - Born in state of residence (%) - White
Place of birth - Born in state of residence (%) - Black or African American
Place of birth - Born in state of residence (%) - Asian
Place of birth - Born in state of residence (%) - Hispanic or Latino
Place of birth - Born in state of residence (%) - American Indian and Alaska Native
Place of birth - Born in state of residence (%) - Multirace
Place of birth - Born in state of residence (%) - Other Race
Place of birth - Born in other state (%)
Place of birth - Born in other state (%) - White
Place of birth - Born in other state (%) - Black or African American
Place of birth - Born in other state (%) - Asian
Place of birth - Born in other state (%) - Hispanic or Latino
Place of birth - Born in other state (%) - American Indian and Alaska Native
Place of birth - Born in other state (%) - Multirace
Place of birth - Born in other state (%) - Other Race
Place of birth - Native, outside of US (%)
Place of birth - Native, outside of US (%) - White
Place of birth - Native, outside of US (%) - Black or African American
Place of birth - Native, outside of US (%) - Asian
Place of birth - Native, outside of US (%) - Hispanic or Latino
Place of birth - Native, outside of US (%) - American Indian and Alaska Native
Place of birth - Native, outside of US (%) - Multirace
Place of birth - Native, outside of US (%) - Other Race
Place of birth - Foreign born (%)
Place of birth - Foreign born (%) - White
Place of birth - Foreign born (%) - Black or African American
Place of birth - Foreign born (%) - Asian
Place of birth - Foreign born (%) - Hispanic or Latino
Place of birth - Foreign born (%) - American Indian and Alaska Native
Place of birth - Foreign born (%) - Multirace
Place of birth - Foreign born (%) - Other Race
Residents speaking English at home (%)
Residents speaking English at home - Born in the United States (%)
Residents speaking English at home - Native, born elsewhere (%)
Residents speaking English at home - Foreign born (%)
Residents speaking Spanish at home (%)
Residents speaking Spanish at home - Born in the United States (%)
Residents speaking Spanish at home - Native, born elsewhere (%)
Residents speaking Spanish at home - Foreign born (%)
Residents speaking other language at home (%)
Residents speaking other language at home - Born in the United States (%)
Residents speaking other language at home - Native, born elsewhere (%)
Residents speaking other language at home - Foreign born (%)
Marital status - Never married (%)
Marital status - Now married (%)
Marital status - Separated (%)
Marital status - Widowed (%)
Marital status - Divorced (%)
Ancestries Reported - Arab (%)
Ancestries Reported - Czech (%)
Ancestries Reported - Danish (%)
Ancestries Reported - Dutch (%)
Ancestries Reported - English (%)
Ancestries Reported - French (%)
Ancestries Reported - French Canadian (%)
Ancestries Reported - German (%)
Ancestries Reported - Greek (%)
Ancestries Reported - Hungarian (%)
Ancestries Reported - Irish (%)
Ancestries Reported - Italian (%)
Ancestries Reported - Lithuanian (%)
Ancestries Reported - Norwegian (%)
Ancestries Reported - Polish (%)
Ancestries Reported - Portuguese (%)
Ancestries Reported - Russian (%)
Ancestries Reported - Scotch-Irish (%)
Ancestries Reported - Scottish (%)
Ancestries Reported - Slovak (%)
Ancestries Reported - Subsaharan African (%)
Ancestries Reported - Swedish (%)
Ancestries Reported - Swiss (%)
Ancestries Reported - Ukrainian (%)
Ancestries Reported - United States (%)
Ancestries Reported - Welsh (%)
Ancestries Reported - West Indian (%)
Ancestries Reported - Other (%)
Geographical mobility - Same house 1 year ago (%)
Geographical mobility - Same house 1 year ago (%) - White
Geographical mobility - Same house 1 year ago (%) - Black or African American
Geographical mobility - Same house 1 year ago (%) - Asian
Geographical mobility - Same house 1 year ago (%) - Hispanic or Latino
Geographical mobility - Same house 1 year ago (%) - American Indian and Alaska Native
Geographical mobility - Same house 1 year ago (%) - Multirace
Geographical mobility - Same house 1 year ago (%) - Other Race
Geographical mobility - Moved within same county (%)
Geographical mobility - Moved within same county (%) - White
Geographical mobility - Moved within same county (%) - Black or African American
Geographical mobility - Moved within same county (%) - Asian
Geographical mobility - Moved within same county (%) - Hispanic or Latino
Geographical mobility - Moved within same county (%) - American Indian and Alaska Native
Geographical mobility - Moved within same county (%) - Multirace
Geographical mobility - Moved within same county (%) - Other Race
Geographical mobility - Moved from different county within same state (%)
Geographical mobility - Moved from different county within same state (%) - White
Geographical mobility - Moved from different county within same state (%) - Black or African American
Geographical mobility - Moved from different county within same state (%) - Asian
Geographical mobility - Moved from different county within same state (%) - Hispanic or Latino
Geographical mobility - Moved from different county within same state (%) - American Indian and Alaska Native
Geographical mobility - Moved from different county within same state (%) - Multirace
Geographical mobility - Moved from different county within same state (%) - Other Race
Geographical mobility - Moved from different state (%)
Geographical mobility - Moved from different state (%) - White
Geographical mobility - Moved from different state (%) - Black or African American
Geographical mobility - Moved from different state (%) - Asian
Geographical mobility - Moved from different state (%) - Hispanic or Latino
Geographical mobility - Moved from different state (%) - American Indian and Alaska Native
Geographical mobility - Moved from different state (%) - Multirace
Geographical mobility - Moved from different state (%) - Other Race
Geographical mobility - Moved from abroad (%)
Geographical mobility - Moved from abroad (%) - White
Geographical mobility - Moved from abroad (%) - Black or African American
Geographical mobility - Moved from abroad (%) - Asian
Geographical mobility - Moved from abroad (%) - Hispanic or Latino
Geographical mobility - Moved from abroad (%) - American Indian and Alaska Native
Geographical mobility - Moved from abroad (%) - Multirace
Geographical mobility - Moved from abroad (%) - Other Race
Place of birth for the foreign-born population - Ireland (%)
Place of birth for the foreign-born population - Denmark (%)
Place of birth for the foreign-born population - Norway (%)
Place of birth for the foreign-born population - Sweden (%)
Place of birth for the foreign-born population - United Kingdom (%)
Place of birth for the foreign-born population - England (%)
Place of birth for the foreign-born population - Scotland (%)
Place of birth for the foreign-born population - Other Northern Europe (%)
Place of birth for the foreign-born population - Austria (%)
Place of birth for the foreign-born population - Belgium (%)
Place of birth for the foreign-born population - France (%)
Place of birth for the foreign-born population - Germany (%)
Place of birth for the foreign-born population - Netherlands (%)
Place of birth for the foreign-born population - Switzerland (%)
Place of birth for the foreign-born population - Other Western Europe (%)
Place of birth for the foreign-born population - Greece (%)
Place of birth for the foreign-born population - Italy (%)
Place of birth for the foreign-born population - Portugal (%)
Place of birth for the foreign-born population - Spain (%)
Place of birth for the foreign-born population - Other Southern Europe (%)
Place of birth for the foreign-born population - Albania (%)
Place of birth for the foreign-born population - Belarus (%)
Place of birth for the foreign-born population - Bosnia and Herzegovina (%)
Place of birth for the foreign-born population - Bulgaria (%)
Place of birth for the foreign-born population - Croatia (%)
Place of birth for the foreign-born population - Czechoslovakia (%)
Place of birth for the foreign-born population - Hungary (%)
Place of birth for the foreign-born population - Latvia (%)
Place of birth for the foreign-born population - Lithuania (%)
Place of birth for the foreign-born population - North Macedonia (Macedonia) (%)
Place of birth for the foreign-born population - Moldova (%)
Place of birth for the foreign-born population - Poland (%)
Place of birth for the foreign-born population - Romania (%)
Place of birth for the foreign-born population - Russia (%)
Place of birth for the foreign-born population - Serbia (%)
Place of birth for the foreign-born population - Ukraine (%)
Place of birth for the foreign-born population - Other Eastern Europe (%)
Place of birth for the foreign-born population - China (%)
Place of birth for the foreign-born population - Hong Kong (%)
Place of birth for the foreign-born population - Taiwan (%)
Place of birth for the foreign-born population - Japan (%)
Place of birth for the foreign-born population - Korea (%)
Place of birth for the foreign-born population - Other Eastern Asia (%)
Place of birth for the foreign-born population - Afghanistan (%)
Place of birth for the foreign-born population - Bangladesh (%)
Place of birth for the foreign-born population - India (%)
Place of birth for the foreign-born population - Iran (%)
Place of birth for the foreign-born population - Kazakhstan (%)
Place of birth for the foreign-born population - Nepal (%)
Place of birth for the foreign-born population - Pakistan (%)
Place of birth for the foreign-born population - Sri Lanka (%)
Place of birth for the foreign-born population - Uzbekistan (%)
Place of birth for the foreign-born population - Other South Central Asia (%)
Place of birth for the foreign-born population - Burma (%)
Place of birth for the foreign-born population - Cambodia (%)
Place of birth for the foreign-born population - Indonesia (%)
Place of birth for the foreign-born population - Laos (%)
Place of birth for the foreign-born population - Malaysia (%)
Place of birth for the foreign-born population - Philippines (%)
Place of birth for the foreign-born population - Singapore (%)
Place of birth for the foreign-born population - Thailand (%)
Place of birth for the foreign-born population - Vietnam (%)
Place of birth for the foreign-born population - Other South Eastern Asia (%)
Place of birth for the foreign-born population - Armenia (%)
Place of birth for the foreign-born population - Iraq (%)
Place of birth for the foreign-born population - Israel (%)
Place of birth for the foreign-born population - Jordan (%)
Place of birth for the foreign-born population - Kuwait (%)
Place of birth for the foreign-born population - Lebanon (%)
Place of birth for the foreign-born population - Saudi Arabia (%)
Place of birth for the foreign-born population - Syria (%)
Place of birth for the foreign-born population - Turkey (%)
Place of birth for the foreign-born population - Yemen (%)
Place of birth for the foreign-born population - Other Western Asia (%)
Place of birth for the foreign-born population - Eritrea (%)
Place of birth for the foreign-born population - Ethiopia (%)
Place of birth for the foreign-born population - Kenya (%)
Place of birth for the foreign-born population - Somalia (%)
Place of birth for the foreign-born population - Uganda (%)
Place of birth for the foreign-born population - Zimbabwe (%)
Place of birth for the foreign-born population - Other Eastern Africa (%)
Place of birth for the foreign-born population - Cameroon (%)
Place of birth for the foreign-born population - Congo (%)
Place of birth for the foreign-born population - Democratic Republic of Congo (Zaire) (%)
Place of birth for the foreign-born population - Other Middle Africa (%)
Place of birth for the foreign-born population - Egypt (%)
Place of birth for the foreign-born population - Morocco (%)
Place of birth for the foreign-born population - Sudan (%)
Place of birth for the foreign-born population - Other Northern Africa (%)
Place of birth for the foreign-born population - South Africa (%)
Place of birth for the foreign-born population - Other Southern Africa (%)
Place of birth for the foreign-born population - Cabo Verde (%)
Place of birth for the foreign-born population - Ghana (%)
Place of birth for the foreign-born population - Liberia (%)
Place of birth for the foreign-born population - Nigeria (%)
Place of birth for the foreign-born population - Senegal (%)
Place of birth for the foreign-born population - Sierra Leone (%)
Place of birth for the foreign-born population - Other Western Africa (%)
Place of birth for the foreign-born population - Australia (%)
Place of birth for the foreign-born population - New Zealand (%)
Place of birth for the foreign-born population - Fiji (%)
Place of birth for the foreign-born population - Micronesia (%)
Place of birth for the foreign-born population - Bahamas (%)
Place of birth for the foreign-born population - Barbados (%)
Place of birth for the foreign-born population - Cuba (%)
Place of birth for the foreign-born population - Dominica (%)
Place of birth for the foreign-born population - Dominican Republic (%)
Place of birth for the foreign-born population - Grenada (%)
Place of birth for the foreign-born population - Haiti (%)
Place of birth for the foreign-born population - Jamaica (%)
Place of birth for the foreign-born population - St. Vincent and the Grenadines (%)
Place of birth for the foreign-born population - Trinidad and Tobago (%)
Place of birth for the foreign-born population - West Indies (%)
Place of birth for the foreign-born population - Other Caribbean (%)
Place of birth for the foreign-born population - Belize (%)
Place of birth for the foreign-born population - Costa Rica (%)
Place of birth for the foreign-born population - El Salvador (%)
Place of birth for the foreign-born population - Guatemala (%)
Place of birth for the foreign-born population - Honduras (%)
Place of birth for the foreign-born population - Mexico (%)
Place of birth for the foreign-born population - Nicaragua (%)
Place of birth for the foreign-born population - Panama (%)
Place of birth for the foreign-born population - Other Central America (%)
Place of birth for the foreign-born population - Argentina (%)
Place of birth for the foreign-born population - Bolivia (%)
Place of birth for the foreign-born population - Brazil (%)
Place of birth for the foreign-born population - Chile (%)
Place of birth for the foreign-born population - Colombia (%)
Place of birth for the foreign-born population - Ecuador (%)
Place of birth for the foreign-born population - Guyana (%)
Place of birth for the foreign-born population - Peru (%)
Place of birth for the foreign-born population - Uruguay (%)
Place of birth for the foreign-born population - Venezuela (%)
Place of birth for the foreign-born population - Other South America (%)
Place of birth for the foreign-born population - Canada (%)
Place of birth for the foreign-born population - Other Northern America (%)
Place of birth for the foreign-born population - Other (%)
Latest news about races in Mansfield, OH collected exclusively by city-data.com from local newspapers, TV, and radio stations
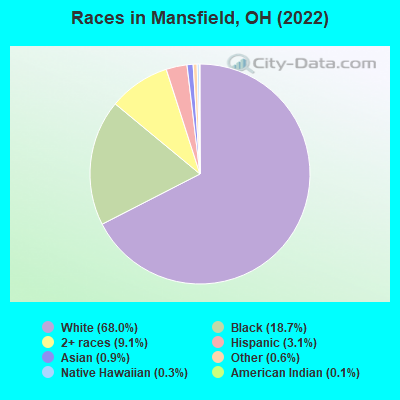
According to 2022 data, the most numerous races in Mansfield, OH are White alone (32,345 residents), Black alone (8,883 residents), and Two or more races (4,333 residents). 96.5% of Mansfield residents speak English at home. 1.8% of Mansfield, OH residents are foreign-born , which is 122.3% less than the foreign-born rate of 4.0% across the entire state of Ohio.
Race distribution in Mansfield
2000 2022
9,538,111 84.0% White alone 1,290,662 11.4% Black alone 217,123 1.9% Hispanic 137,770 1.2% Two or more races 131,670 1.2% Asian alone 21,985 0.2% American Indian alone 13,483 0.1% Other race alone 2,336 0.02% Native Hawaiian and Other
8,948,793 76.1% White alone 1,401,403 11.9% Black alone 529,291 4.5% Two or more races 517,232 4.4% Hispanic 293,387 2.5% Asian alone 52,805 0.4% Other race alone 9,785 0.08% American Indian alone 3,362 0.03% Native Hawaiian and Other
Income and house value in Mansfield Median household income in 2022 $41,087 White non-Hispanic householders$43,211 Black householders$39,459 American Indian and Alaska Native householders$45,588 Two or more races householders$28,601 Hispanic or Latino race householdersMedian 2022 house value $112,301 White Non-Hispanic householders$72,339 Black or African American householders$109,384 American Indian or Alaska Native householders $380,220 Asian householders$911,537 Native Hawaiian and other Pacific Islander householders$55,858 Some other race householders$85,903 Two or more races householders$89,695 Hispanic or Latino householders
Median age by race in Mansfield
42.0 Median age for White residents40.2 43.1 40.8 Median age for Black or African American residents39.9 45.5 37.9 Median age for American Indian / Alaska Native residents36.5 60.1 34.9 Median age for Asian residents34.8 46.0 45.1 Median age for Native Hawaiian / Pacific Islander residents42.3 -666,666,666.0 43.6 Median age for Other race residents43.4 42.8 23.2 Median age for Two or more races residents23.7 19.3 42.2 Median age for White alone residents40.5 43.4 31.4 Median age for Hispanic or Latino residents32.2 28.6
Owner/renter occupied households by race in Mansfield
House owners and renters - White residents 8,075 54.4% Owner occupied6,780 45.6% Renter occupiedHouse owners and renters - Black or African American residents 845 41.9% Owner occupied1,173 58.1% Renter occupiedHouse owners and renters - American Indian / Alaska Native residents 6 22.0% Owner occupied20 78.0% Renter occupiedHouse owners and renters - Asian residents 86 48.0% Owner occupied94 52.0% Renter occupiedHouse owners and renters - Native Hawaiian / Pacific Islander residents 17 100.0% Renter occupiedHouse owners and renters - Other race residents 38 21.6% Owner occupied140 78.4% Renter occupiedHouse owners and renters - Two or more races residents 695 48.7% Owner occupied733 51.3% Renter occupiedHouse owners and renters - White alone residents 8,118 54.7% Owner occupied6,733 45.3% Renter occupiedHouse owners and renters - Hispanic or Latino residents 112 37.2% Owner occupied189 62.8% Renter occupied
Language usage in Mansfield
English speakers - Total 96.5% of residents of Mansfield speak English at home.
1.7% of residents speak Spanish at home 313 41.8% Speak English very well435 58.2% Speak English less than very well1.9% of residents speak other language at home 717 82.0% Speak English very well157 18.0% Speak English less than very well
English speakers - Born in the United States 95.9% of residents of Mansfield speak English at home.
3.3% of residents speak Spanish at home 142 55.7% Speak English very well113 44.3% Speak English less than very well3.3% of residents speak other language at home 244 96.8% Speak English very well8 3.2% Speak English less than very well
English speakers - Native, born elsewhere 37.2% of residents of Mansfield speak English at home.
31.1% of residents speak Spanish at home 38 35.2% Speak English very well70 64.8% Speak English less than very well9.2% of residents speak other language at home 24 75.0% Speak English very well8 25.0% Speak English less than very well
English speakers - Foreign-born 18.9% of residents of Mansfield speak English at home.
27.4% of residents speak Spanish at home 19 12.3% Speak English very well136 87.7% Speak English less than very well60.2% of residents speak other language at home 190 55.7% Speak English very well151 44.3% Speak English less than very well
White (Caucasian) - Speak only English Native:
99.2% (31,110)Foreign-born:
21.7% (65)
White (Caucasian) - Speak another language Native:
1.1% (336)Foreign-born:
79.5% (237)
Black or African American - Speak another language Native:
3.4% (297)Foreign-born:
97.3% (8)
Asian - Speak only English Native:
77.5% (171)Foreign-born:
10.0% (25)
Asian - Speak another language Native:
23.9% (53)Foreign-born:
90.4% (225)
Other race - Speak another language Native:
62.5% (363)Foreign-born:
100.0% (116)
Two or more races - Speak only English Native:
96.0% (3,924)Foreign-born:
38.2% (22)
Two or more races - Speak another language Native:
3.3% (134)Foreign-born:
56.9% (32)
White alone - Speak only English Native:
99.5% (30,702)Foreign-born:
20.2% (59)
White alone - Speak another language Native:
0.9% (266)Foreign-born:
81.7% (240)
Hispanic or Latino - Speak only English Native:
67.2% (925)Foreign-born:
31.7% (31)
Hispanic or Latino - Speak another language Native:
33.8% (465)Foreign-born:
94.3% (92)
Foreign-born residents in Mansfield 859 residents are foreign born
Marital status for residents in Mansfield Marital status - White (Caucasian) population 15 years and over
Males 39.6% Never married34.0% Now married2.6% Separated3.8% Widowed20.0% DivorcedFemales 31.7% Never married32.2% Now married3.1% Separated13.9% Widowed19.1% DivorcedWomen who gave birth in the past 12 months Now married:
33.3% (134)Unmarried:
66.7% (269)
Women who did not give birth in the past 12 months Now married:
34.8% (2,355)Unmarried:
65.2% (4,422)
Marital status - Black or African American population 15 years and over
Males 66.9% Never married19.2% Now married2.5% Separated1.1% Widowed10.4% DivorcedFemales 48.0% Never married24.5% Now married3.8% Separated10.8% Widowed12.8% DivorcedWomen who gave birth in the past 12 months Now married:
43.3% (44)Unmarried:
56.7% (58)
Women who did not give birth in the past 12 months Now married:
20.5% (270)Unmarried:
79.5% (1,046)
Marital status - American Indian / Alaska Native population 15 years and over
Males 70.0% Never married20.0% Now married10.0% Separated0.0% Widowed0.0% DivorcedFemales 0.0% Never married61.5% Now married0.0% Separated7.7% Widowed30.8% DivorcedMarital status - Asian population 15 years and over
Males 54.9% Never married37.8% Now married0.0% Separated0.0% Widowed7.3% DivorcedFemales 29.4% Never married63.3% Now married0.0% Separated7.3% Widowed0.0% DivorcedWomen who did not give birth in the past 12 months Now married:
57.3% (86)Unmarried:
42.7% (64)
Marital status - Other race population 15 years and over
Males 35.9% Never married42.1% Now married0.0% Separated14.8% Widowed7.2% DivorcedFemales 4.4% Never married71.8% Now married0.0% Separated13.6% Widowed10.3% DivorcedWomen who did not give birth in the past 12 months Now married:
80.7% (221)Unmarried:
19.3% (53)
Marital status - Two or more races population 15 years and over
Males 59.9% Never married21.0% Now married3.0% Separated5.5% Widowed10.6% DivorcedFemales 61.8% Never married21.0% Now married0.0% Separated10.6% Widowed6.6% DivorcedWomen who gave birth in the past 12 months Now married:
6.5% (8)Unmarried:
93.5% (116)
Women who did not give birth in the past 12 months Now married:
18.6% (119)Unmarried:
81.4% (520)
Marital status - White alone, not Hispanic / Latino population 15 years and over
Males 39.3% Never married34.3% Now married2.7% Separated3.8% Widowed20.0% DivorcedFemales 31.5% Never married32.4% Now married3.1% Separated13.8% Widowed19.1% DivorcedWomen who gave birth in the past 12 months Now married:
33.3% (133)Unmarried:
66.7% (268)
Women who did not give birth in the past 12 months Now married:
35.1% (2,338)Unmarried:
64.9% (4,323)
Marital status - Hispanic or Latino population 15 years and over
Males 58.2% Never married21.5% Now married1.9% Separated5.7% Widowed12.7% DivorcedFemales 34.5% Never married46.2% Now married0.0% Separated7.8% Widowed11.4% DivorcedWomen who did not give birth in the past 12 months Now married:
51.8% (212)Unmarried:
48.2% (197)
Ancestries in Mansfield
3,007 14.6% German1,820 8.9% American1,690 8.2% English1,168 5.7% Irish955 4.7% Italian668 3.3% European300 1.5% Polish208 1.0% African183 0.9% French178 0.9% Scotch-Irish143 0.7% French Canadian122 0.6% Macedonian108 0.5% Greek96 0.5% Scottish93 0.5% Russian91 0.4% Lebanese78 0.4% Welsh77 0.4% Czech77 0.4% Czechoslovakian64 0.3% Dutch51 0.2% Hungarian49 0.2% Yugoslavian44 0.2% Serbian39 0.2% Slovak37 0.2% British32 0.2% Austrian27 0.1% Scandinavian18 0.09% Arab17 0.08% Jamaican16 0.08% Finnish16 0.08% Swiss15 0.07% Norwegian14 0.07% Haitian12 0.06% Latvian10 0.05% Belgian8 0.04% Pennsylvania German7 0.03% Ukrainian5 0.02% Egyptian5 0.02% Lithuanian5 0.02% Northern European5 0.02% Croatian4 0.02% Eastern European
Geographical mobility in Mansfield Same house 1 year ago 26,919 81.9% White (Caucasian)6,858 76.4% Black or African American72 77.0% American Indian / Alaska Native359 76.7% Asian161 100.0% Native Hawaiian / Pacific Islander544 75.8% Other race4,343 70.5% Two or more races26,517 82.0% White alone, not Hispanic / Latino1,086 74.5% Hispanic or LatinoMoved within same county 3,359 10.2% White / Caucasian684 7.6% Black or African American7 7.6% American Indian / Alaska Native853 13.8% Two or more races3,320 10.3% White alone, not Hispanic / Latino51 3.5% Hispanic or LatinoMoved within same state 1,538 4.7% White / Caucasian1,138 12.7% Black or African American10 10.4% American Indian / Alaska Native10 2.2% Asian193 26.9% Other race260 4.2% Two or more races1,453 4.5% White alone, not Hispanic / Latino331 22.7% Hispanic or LatinoMoved from different state 737 2.2% White / Caucasian396 4.4% Black or African American64 13.6% Asian20 2.9% Other race30 0.5% Two or more races737 2.3% White alone, not Hispanic / Latino16 1.1% Hispanic or LatinoMoved from abroad 212 0.6% White57 0.6% Black or African American68 1.1% Two or more races212 0.7% White alone, not Hispanic / Latino38 2.6% Hispanic or Latino
Children Nativity (place of birth) in Mansfield
Children under 6 years - Living with two parents Both parents native 938 100.0% NativeOne native, one foreign-born parent 36 100.0% NativeChildren under 6 years - Living with one parent Native parent 1,813 100.0% NativeChildren 6 to 17 years - Living with two parents Both parents native 2,254 100.0% NativeBoth parents foreign-born 21 71.5% Native8 28.5% Foreign-bornOne native, one foreign-born parent 40 100.0% NativeChildren 6 to 17 years - Living with one parent Native parent 2,871 100.0% NativeForeign-born parent 91 56.9% Native69 43.1% Foreign-born
Grandparents responsible for own grandchildren in Mansfield
Grandparents (30 to 59 years) White / Caucasian 123 45.7% Responsible for grandchildren146 54.3% Not responsible for grandchildrenBlack or African American 14 34.8% Responsible for grandchildren26 65.2% Not responsible for grandchildrenTwo or more races 42 97.3% Responsible for grandchildren1 2.7% Not responsible for grandchildrenWhite alone, not Hispanic / Latino 122 45.1% Responsible for grandchildren149 54.9% Not responsible for grandchildrenGrandparents (60 years and over) White / Caucasian 31 27.3% Responsible for grandchildren81 72.7% Not responsible for grandchildrenBlack or African American 66 51.1% Responsible for grandchildren63 48.9% Not responsible for grandchildrenWhite alone, not Hispanic / Latino 31 27.2% Responsible for grandchildren82 72.8% Not responsible for grandchildren