Races in Mechanicsville, Virginia (VA) Detailed Stats
Data:
Races - White alone (%)
Races - White alone (% change since 2000)
Races - Black alone (%)
Races - Black alone (% change since 2000)
Races - American Indian alone (%)
Races - American Indian alone (% change since 2000)
Races - Asian alone (%)
Races - Asian alone (% change since 2000)
Races - Hispanic (%)
Races - Hispanic (% change since 2000)
Races - Native Hawaiian and Other Pacific Islander alone (%)
Races - Native Hawaiian and Other Pacific Islander alone (% change since 2000)
Races - Two or more races(%)
Races - Two or more races(% change since 2000)
Races - Other race alone (%)
Races - Other race alone (% change since 2000)
Racial diversity
Place of birth - Born in state of residence (%)
Place of birth - Born in state of residence (%) - White
Place of birth - Born in state of residence (%) - Black or African American
Place of birth - Born in state of residence (%) - Asian
Place of birth - Born in state of residence (%) - Hispanic or Latino
Place of birth - Born in state of residence (%) - American Indian and Alaska Native
Place of birth - Born in state of residence (%) - Multirace
Place of birth - Born in state of residence (%) - Other Race
Place of birth - Born in other state (%)
Place of birth - Born in other state (%) - White
Place of birth - Born in other state (%) - Black or African American
Place of birth - Born in other state (%) - Asian
Place of birth - Born in other state (%) - Hispanic or Latino
Place of birth - Born in other state (%) - American Indian and Alaska Native
Place of birth - Born in other state (%) - Multirace
Place of birth - Born in other state (%) - Other Race
Place of birth - Native, outside of US (%)
Place of birth - Native, outside of US (%) - White
Place of birth - Native, outside of US (%) - Black or African American
Place of birth - Native, outside of US (%) - Asian
Place of birth - Native, outside of US (%) - Hispanic or Latino
Place of birth - Native, outside of US (%) - American Indian and Alaska Native
Place of birth - Native, outside of US (%) - Multirace
Place of birth - Native, outside of US (%) - Other Race
Place of birth - Foreign born (%)
Place of birth - Foreign born (%) - White
Place of birth - Foreign born (%) - Black or African American
Place of birth - Foreign born (%) - Asian
Place of birth - Foreign born (%) - Hispanic or Latino
Place of birth - Foreign born (%) - American Indian and Alaska Native
Place of birth - Foreign born (%) - Multirace
Place of birth - Foreign born (%) - Other Race
Residents speaking English at home (%)
Residents speaking English at home - Born in the United States (%)
Residents speaking English at home - Native, born elsewhere (%)
Residents speaking English at home - Foreign born (%)
Residents speaking Spanish at home (%)
Residents speaking Spanish at home - Born in the United States (%)
Residents speaking Spanish at home - Native, born elsewhere (%)
Residents speaking Spanish at home - Foreign born (%)
Residents speaking other language at home (%)
Residents speaking other language at home - Born in the United States (%)
Residents speaking other language at home - Native, born elsewhere (%)
Residents speaking other language at home - Foreign born (%)
Marital status - Never married (%)
Marital status - Now married (%)
Marital status - Separated (%)
Marital status - Widowed (%)
Marital status - Divorced (%)
Ancestries Reported - Arab (%)
Ancestries Reported - Czech (%)
Ancestries Reported - Danish (%)
Ancestries Reported - Dutch (%)
Ancestries Reported - English (%)
Ancestries Reported - French (%)
Ancestries Reported - French Canadian (%)
Ancestries Reported - German (%)
Ancestries Reported - Greek (%)
Ancestries Reported - Hungarian (%)
Ancestries Reported - Irish (%)
Ancestries Reported - Italian (%)
Ancestries Reported - Lithuanian (%)
Ancestries Reported - Norwegian (%)
Ancestries Reported - Polish (%)
Ancestries Reported - Portuguese (%)
Ancestries Reported - Russian (%)
Ancestries Reported - Scotch-Irish (%)
Ancestries Reported - Scottish (%)
Ancestries Reported - Slovak (%)
Ancestries Reported - Subsaharan African (%)
Ancestries Reported - Swedish (%)
Ancestries Reported - Swiss (%)
Ancestries Reported - Ukrainian (%)
Ancestries Reported - United States (%)
Ancestries Reported - Welsh (%)
Ancestries Reported - West Indian (%)
Ancestries Reported - Other (%)
Geographical mobility - Same house 1 year ago (%)
Geographical mobility - Same house 1 year ago (%) - White
Geographical mobility - Same house 1 year ago (%) - Black or African American
Geographical mobility - Same house 1 year ago (%) - Asian
Geographical mobility - Same house 1 year ago (%) - Hispanic or Latino
Geographical mobility - Same house 1 year ago (%) - American Indian and Alaska Native
Geographical mobility - Same house 1 year ago (%) - Multirace
Geographical mobility - Same house 1 year ago (%) - Other Race
Geographical mobility - Moved within same county (%)
Geographical mobility - Moved within same county (%) - White
Geographical mobility - Moved within same county (%) - Black or African American
Geographical mobility - Moved within same county (%) - Asian
Geographical mobility - Moved within same county (%) - Hispanic or Latino
Geographical mobility - Moved within same county (%) - American Indian and Alaska Native
Geographical mobility - Moved within same county (%) - Multirace
Geographical mobility - Moved within same county (%) - Other Race
Geographical mobility - Moved from different county within same state (%)
Geographical mobility - Moved from different county within same state (%) - White
Geographical mobility - Moved from different county within same state (%) - Black or African American
Geographical mobility - Moved from different county within same state (%) - Asian
Geographical mobility - Moved from different county within same state (%) - Hispanic or Latino
Geographical mobility - Moved from different county within same state (%) - American Indian and Alaska Native
Geographical mobility - Moved from different county within same state (%) - Multirace
Geographical mobility - Moved from different county within same state (%) - Other Race
Geographical mobility - Moved from different state (%)
Geographical mobility - Moved from different state (%) - White
Geographical mobility - Moved from different state (%) - Black or African American
Geographical mobility - Moved from different state (%) - Asian
Geographical mobility - Moved from different state (%) - Hispanic or Latino
Geographical mobility - Moved from different state (%) - American Indian and Alaska Native
Geographical mobility - Moved from different state (%) - Multirace
Geographical mobility - Moved from different state (%) - Other Race
Geographical mobility - Moved from abroad (%)
Geographical mobility - Moved from abroad (%) - White
Geographical mobility - Moved from abroad (%) - Black or African American
Geographical mobility - Moved from abroad (%) - Asian
Geographical mobility - Moved from abroad (%) - Hispanic or Latino
Geographical mobility - Moved from abroad (%) - American Indian and Alaska Native
Geographical mobility - Moved from abroad (%) - Multirace
Geographical mobility - Moved from abroad (%) - Other Race
Place of birth for the foreign-born population - Ireland (%)
Place of birth for the foreign-born population - Denmark (%)
Place of birth for the foreign-born population - Norway (%)
Place of birth for the foreign-born population - Sweden (%)
Place of birth for the foreign-born population - United Kingdom (%)
Place of birth for the foreign-born population - England (%)
Place of birth for the foreign-born population - Scotland (%)
Place of birth for the foreign-born population - Other Northern Europe (%)
Place of birth for the foreign-born population - Austria (%)
Place of birth for the foreign-born population - Belgium (%)
Place of birth for the foreign-born population - France (%)
Place of birth for the foreign-born population - Germany (%)
Place of birth for the foreign-born population - Netherlands (%)
Place of birth for the foreign-born population - Switzerland (%)
Place of birth for the foreign-born population - Other Western Europe (%)
Place of birth for the foreign-born population - Greece (%)
Place of birth for the foreign-born population - Italy (%)
Place of birth for the foreign-born population - Portugal (%)
Place of birth for the foreign-born population - Spain (%)
Place of birth for the foreign-born population - Other Southern Europe (%)
Place of birth for the foreign-born population - Albania (%)
Place of birth for the foreign-born population - Belarus (%)
Place of birth for the foreign-born population - Bosnia and Herzegovina (%)
Place of birth for the foreign-born population - Bulgaria (%)
Place of birth for the foreign-born population - Croatia (%)
Place of birth for the foreign-born population - Czechoslovakia (%)
Place of birth for the foreign-born population - Hungary (%)
Place of birth for the foreign-born population - Latvia (%)
Place of birth for the foreign-born population - Lithuania (%)
Place of birth for the foreign-born population - North Macedonia (Macedonia) (%)
Place of birth for the foreign-born population - Moldova (%)
Place of birth for the foreign-born population - Poland (%)
Place of birth for the foreign-born population - Romania (%)
Place of birth for the foreign-born population - Russia (%)
Place of birth for the foreign-born population - Serbia (%)
Place of birth for the foreign-born population - Ukraine (%)
Place of birth for the foreign-born population - Other Eastern Europe (%)
Place of birth for the foreign-born population - China (%)
Place of birth for the foreign-born population - Hong Kong (%)
Place of birth for the foreign-born population - Taiwan (%)
Place of birth for the foreign-born population - Japan (%)
Place of birth for the foreign-born population - Korea (%)
Place of birth for the foreign-born population - Other Eastern Asia (%)
Place of birth for the foreign-born population - Afghanistan (%)
Place of birth for the foreign-born population - Bangladesh (%)
Place of birth for the foreign-born population - India (%)
Place of birth for the foreign-born population - Iran (%)
Place of birth for the foreign-born population - Kazakhstan (%)
Place of birth for the foreign-born population - Nepal (%)
Place of birth for the foreign-born population - Pakistan (%)
Place of birth for the foreign-born population - Sri Lanka (%)
Place of birth for the foreign-born population - Uzbekistan (%)
Place of birth for the foreign-born population - Other South Central Asia (%)
Place of birth for the foreign-born population - Burma (%)
Place of birth for the foreign-born population - Cambodia (%)
Place of birth for the foreign-born population - Indonesia (%)
Place of birth for the foreign-born population - Laos (%)
Place of birth for the foreign-born population - Malaysia (%)
Place of birth for the foreign-born population - Philippines (%)
Place of birth for the foreign-born population - Singapore (%)
Place of birth for the foreign-born population - Thailand (%)
Place of birth for the foreign-born population - Vietnam (%)
Place of birth for the foreign-born population - Other South Eastern Asia (%)
Place of birth for the foreign-born population - Armenia (%)
Place of birth for the foreign-born population - Iraq (%)
Place of birth for the foreign-born population - Israel (%)
Place of birth for the foreign-born population - Jordan (%)
Place of birth for the foreign-born population - Kuwait (%)
Place of birth for the foreign-born population - Lebanon (%)
Place of birth for the foreign-born population - Saudi Arabia (%)
Place of birth for the foreign-born population - Syria (%)
Place of birth for the foreign-born population - Turkey (%)
Place of birth for the foreign-born population - Yemen (%)
Place of birth for the foreign-born population - Other Western Asia (%)
Place of birth for the foreign-born population - Eritrea (%)
Place of birth for the foreign-born population - Ethiopia (%)
Place of birth for the foreign-born population - Kenya (%)
Place of birth for the foreign-born population - Somalia (%)
Place of birth for the foreign-born population - Uganda (%)
Place of birth for the foreign-born population - Zimbabwe (%)
Place of birth for the foreign-born population - Other Eastern Africa (%)
Place of birth for the foreign-born population - Cameroon (%)
Place of birth for the foreign-born population - Congo (%)
Place of birth for the foreign-born population - Democratic Republic of Congo (Zaire) (%)
Place of birth for the foreign-born population - Other Middle Africa (%)
Place of birth for the foreign-born population - Egypt (%)
Place of birth for the foreign-born population - Morocco (%)
Place of birth for the foreign-born population - Sudan (%)
Place of birth for the foreign-born population - Other Northern Africa (%)
Place of birth for the foreign-born population - South Africa (%)
Place of birth for the foreign-born population - Other Southern Africa (%)
Place of birth for the foreign-born population - Cabo Verde (%)
Place of birth for the foreign-born population - Ghana (%)
Place of birth for the foreign-born population - Liberia (%)
Place of birth for the foreign-born population - Nigeria (%)
Place of birth for the foreign-born population - Senegal (%)
Place of birth for the foreign-born population - Sierra Leone (%)
Place of birth for the foreign-born population - Other Western Africa (%)
Place of birth for the foreign-born population - Australia (%)
Place of birth for the foreign-born population - New Zealand (%)
Place of birth for the foreign-born population - Fiji (%)
Place of birth for the foreign-born population - Micronesia (%)
Place of birth for the foreign-born population - Bahamas (%)
Place of birth for the foreign-born population - Barbados (%)
Place of birth for the foreign-born population - Cuba (%)
Place of birth for the foreign-born population - Dominica (%)
Place of birth for the foreign-born population - Dominican Republic (%)
Place of birth for the foreign-born population - Grenada (%)
Place of birth for the foreign-born population - Haiti (%)
Place of birth for the foreign-born population - Jamaica (%)
Place of birth for the foreign-born population - St. Vincent and the Grenadines (%)
Place of birth for the foreign-born population - Trinidad and Tobago (%)
Place of birth for the foreign-born population - West Indies (%)
Place of birth for the foreign-born population - Other Caribbean (%)
Place of birth for the foreign-born population - Belize (%)
Place of birth for the foreign-born population - Costa Rica (%)
Place of birth for the foreign-born population - El Salvador (%)
Place of birth for the foreign-born population - Guatemala (%)
Place of birth for the foreign-born population - Honduras (%)
Place of birth for the foreign-born population - Mexico (%)
Place of birth for the foreign-born population - Nicaragua (%)
Place of birth for the foreign-born population - Panama (%)
Place of birth for the foreign-born population - Other Central America (%)
Place of birth for the foreign-born population - Argentina (%)
Place of birth for the foreign-born population - Bolivia (%)
Place of birth for the foreign-born population - Brazil (%)
Place of birth for the foreign-born population - Chile (%)
Place of birth for the foreign-born population - Colombia (%)
Place of birth for the foreign-born population - Ecuador (%)
Place of birth for the foreign-born population - Guyana (%)
Place of birth for the foreign-born population - Peru (%)
Place of birth for the foreign-born population - Uruguay (%)
Place of birth for the foreign-born population - Venezuela (%)
Place of birth for the foreign-born population - Other South America (%)
Place of birth for the foreign-born population - Canada (%)
Place of birth for the foreign-born population - Other Northern America (%)
Place of birth for the foreign-born population - Other (%)
Latest news about races in Mechanicsville, VA collected exclusively by city-data.com from local newspapers, TV, and radio stations
According to 2022 data, the most numerous races in Mechanicsville, VA are White alone (31,322 residents), Black alone (2,965 residents), and Hispanic (700 residents). 96.7% of Mechanicsville residents speak English at home. 4.0% of Mechanicsville, VA residents are foreign-born (1.6% born in Europe, 1.4% born in Asia), which is 203.4% less than the foreign-born rate of 12.0% across the entire state of Virginia.
Race distribution in Mechanicsville
2000 2022
4,965,637 70.2% White alone 1,376,378 19.4% Black alone 329,540 4.7% Hispanic 259,277 3.7% Asian alone 114,022 1.6% Two or more races 18,596 0.3% American Indian alone 11,685 0.2% Other race alone 3,380 0.05% Native Hawaiian and Other
5,095,130 58.7% White alone 1,594,785 18.4% Black alone 905,750 10.4% Hispanic 602,881 6.9% Asian alone 406,047 4.7% Two or more races 60,419 0.7% Other race alone 11,738 0.1% American Indian alone 6,869 0.08% Native Hawaiian and Other
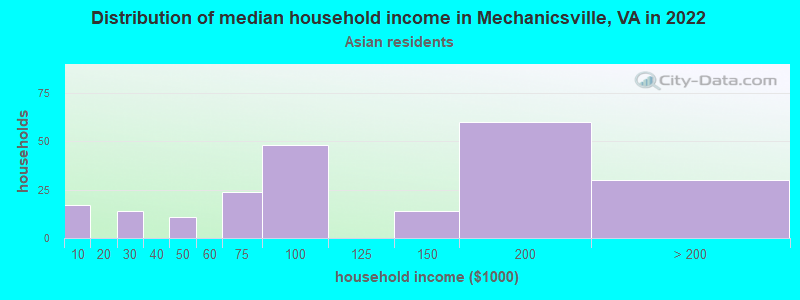
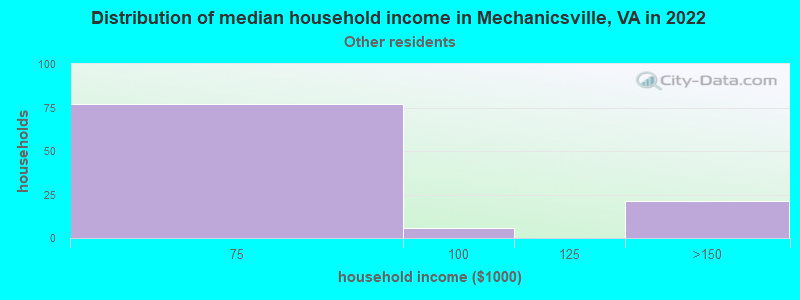
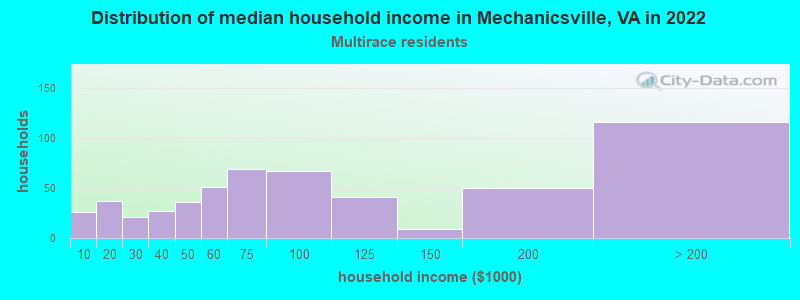
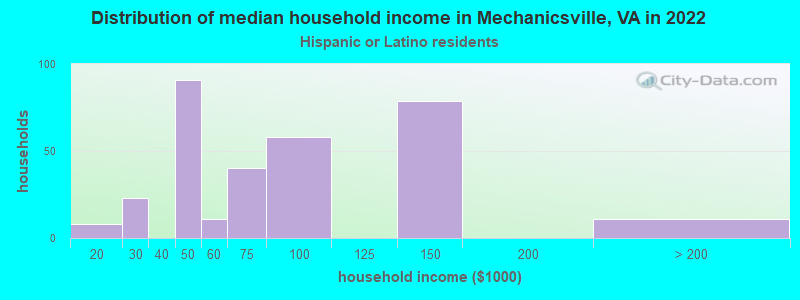
Income and house value in Mechanicsville Median household income in 2022 $91,342 White non-Hispanic householders$86,913 Black householders$161,072 Some other race householders$58,685 Two or more races householders$122,677 Hispanic or Latino race householdersMedian 2022 house value $319,665 White Non-Hispanic householders$327,161 Black or African American householders$272,029 American Indian or Alaska Native householders $453,382 Asian householders$269,128 Some other race householders$311,201 Two or more races householders$276,623 Hispanic or Latino householders
Median age by race in Mechanicsville
43.7 Median age for White residents41.4 45.4 44.5 Median age for Black or African American residents40.9 53.1 56.7 Median age for American Indian / Alaska Native residents-682,352,940.5 -687,861,271.0 36.2 Median age for Asian residents45.8 30.6 -810,810,810.0 Median age for Native Hawaiian / Pacific Islander residents-666,666,666.0 -666,666,666.0 15.1 Median age for Other race residents11.6 37.0 22.7 Median age for Two or more races residents23.7 19.5 43.3 Median age for White alone residents41.4 45.0 41.6 Median age for Hispanic or Latino residents34.2 39.7
Owner/renter occupied households by race in Mechanicsville
House owners and renters - White residents 10,966 82.6% Owner occupied2,310 17.4% Renter occupiedHouse owners and renters - Black or African American residents 985 63.9% Owner occupied556 36.1% Renter occupiedHouse owners and renters - American Indian / Alaska Native residents 58 64.6% Owner occupied32 35.4% Renter occupiedHouse owners and renters - Asian residents 280 96.8% Owner occupied9 3.2% Renter occupiedHouse owners and renters - Other race residents 59 54.4% Owner occupied49 45.6% Renter occupiedHouse owners and renters - Two or more races residents 182 40.4% Owner occupied269 59.6% Renter occupiedHouse owners and renters - White alone residents 10,903 82.8% Owner occupied2,267 17.2% Renter occupiedHouse owners and renters - Hispanic or Latino residents 97 33.2% Owner occupied196 66.8% Renter occupied
Language usage in Mechanicsville
English speakers - Total 96.7% of residents of Mechanicsville speak English at home.
0.6% of residents speak Spanish at home 201 93.9% Speak English very well13 6.1% Speak English less than very well2.6% of residents speak other language at home 874 88.6% Speak English very well112 11.4% Speak English less than very well
English speakers - Born in the United States 98.0% of residents of Mechanicsville speak English at home.
1.3% of residents speak Spanish at home 124 100.0% Speak English very well0.8% of residents speak other language at home 41 54.7% Speak English very well34 45.3% Speak English less than very well
English speakers - Native, born elsewhere 90.7% of residents of Mechanicsville speak English at home.
English speakers - Foreign-born 41.1% of residents of Mechanicsville speak English at home.
2.3% of residents speak Spanish at home 21 80.8% Speak English very well5 19.2% Speak English less than very well68.5% of residents speak other language at home 695 87.9% Speak English very well96 12.1% Speak English less than very well
White (Caucasian) - Speak only English Native:
99.3% (29,793)Foreign-born:
100.0% (483)
White (Caucasian) - Speak another language Native:
0.7% (211)Foreign-born:
43.2% (209)
Black or African American - Speak only English Native:
96.9% (2,829)Foreign-born:
66.4% (78)
Black or African American - Speak another language Native:
3.1% (91)Foreign-born:
26.6% (31)
Asian - Speak only English Native:
52.7% (100)Foreign-born:
27.4% (132)
Asian - Speak another language Native:
47.1% (89)Foreign-born:
73.6% (355)
Other race - Speak another language Native:
19.9% (71)Foreign-born:
98.4% (12)
Two or more races - Speak only English Native:
94.7% (2,100)Foreign-born:
56.3% (65)
Two or more races - Speak another language Native:
2.8% (61)Foreign-born:
40.8% (47)
White alone - Speak only English Native:
99.3% (29,630)Foreign-born:
42.6% (240)
White alone - Speak another language Native:
0.7% (206)Foreign-born:
50.8% (286)
Hispanic or Latino - Speak only English Native:
60.8% (633)Foreign-born:
68.5% (60)
Hispanic or Latino - Speak another language Native:
39.3% (408)Foreign-born:
35.1% (31)
Foreign-born residents in Mechanicsville 1,549 residents are foreign born (1.6% Europe , 1.4% Asia ).
This city:
4.0%Virginia:
12.6%
Marital status for residents in Mechanicsville Marital status - White (Caucasian) population 15 years and over
Males 27.2% Never married56.3% Now married1.9% Separated4.7% Widowed9.9% DivorcedFemales 24.4% Never married49.4% Now married1.4% Separated11.2% Widowed13.7% DivorcedWomen who gave birth in the past 12 months Now married:
70.1% (252)Unmarried:
29.9% (108)
Women who did not give birth in the past 12 months Now married:
47.1% (3,244)Unmarried:
52.9% (3,637)
Marital status - Black or African American population 15 years and over
Males 35.1% Never married35.6% Now married1.8% Separated3.7% Widowed23.7% DivorcedFemales 34.0% Never married31.8% Now married1.3% Separated2.4% Widowed30.6% DivorcedWomen who did not give birth in the past 12 months Now married:
35.9% (182)Unmarried:
64.1% (325)
Marital status - American Indian / Alaska Native population 15 years and over
Males 0.0% Never married100.0% Now married0.0% Separated0.0% Widowed0.0% DivorcedFemales 0.0% Never married0.0% Now married0.0% Separated0.0% Widowed100.0% DivorcedMarital status - Asian population 15 years and over
Males 6.2% Never married90.9% Now married0.0% Separated0.0% Widowed2.9% DivorcedFemales 20.0% Never married69.3% Now married7.0% Separated3.7% Widowed0.0% DivorcedWomen who gave birth in the past 12 months Now married:
100.0% (8)Unmarried:
0.0% (0)
Women who did not give birth in the past 12 months Now married:
67.3% (151)Unmarried:
32.7% (74)
Marital status - Other race population 15 years and over
Males 18.1% Never married81.9% Now married0.0% Separated0.0% Widowed0.0% DivorcedFemales 35.5% Never married64.5% Now married0.0% Separated0.0% Widowed0.0% DivorcedWomen who did not give birth in the past 12 months Now married:
62.7% (84)Unmarried:
37.3% (50)
Marital status - Two or more races population 15 years and over
Males 50.7% Never married48.9% Now married0.3% Separated0.0% Widowed0.0% DivorcedFemales 40.7% Never married43.1% Now married5.1% Separated8.5% Widowed2.6% DivorcedWomen who gave birth in the past 12 months Now married:
100.0% (27)Unmarried:
0.0% (0)
Women who did not give birth in the past 12 months Now married:
35.0% (207)Unmarried:
65.0% (384)
Marital status - White alone, not Hispanic / Latino population 15 years and over
Males 27.2% Never married56.6% Now married1.5% Separated4.8% Widowed10.0% DivorcedFemales 24.4% Never married49.3% Now married1.4% Separated11.3% Widowed13.6% DivorcedWomen who gave birth in the past 12 months Now married:
70.1% (256)Unmarried:
29.9% (109)
Women who did not give birth in the past 12 months Now married:
46.8% (3,236)Unmarried:
53.2% (3,675)
Marital status - Hispanic or Latino population 15 years and over
Males 26.9% Never married51.9% Now married21.3% Separated0.0% Widowed0.0% DivorcedFemales 29.3% Never married60.7% Now married0.0% Separated0.0% Widowed10.0% DivorcedWomen who did not give birth in the past 12 months Now married:
62.8% (109)Unmarried:
37.2% (65)
Ancestries in Mechanicsville
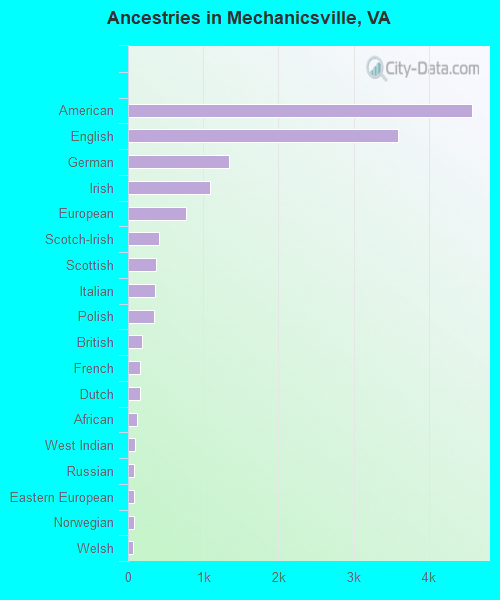
4,569 24.3% American3,590 19.1% English1,346 7.2% German1,094 5.8% Irish765 4.1% European416 2.2% Scotch-Irish375 2.0% Scottish363 1.9% Italian352 1.9% Polish184 1.0% British163 0.9% French153 0.8% Dutch115 0.6% African99 0.5% West Indian80 0.4% Russian75 0.4% Eastern European74 0.4% Norwegian72 0.4% Welsh35 0.2% Ukrainian31 0.2% Czech23 0.1% Romanian21 0.1% Egyptian21 0.1% French Canadian19 0.1% Swedish17 0.09% Ethiopian14 0.07% Arab14 0.07% Hungarian13 0.07% Austrian10 0.05% Cajun10 0.05% Canadian8 0.04% Slovak7 0.04% Jordanian7 0.04% Celtic6 0.03% Greek6 0.03% Lithuanian5 0.03% Latvian5 0.03% Portuguese4 0.02% Macedonian4 0.02% Croatian2 0.01% Lebanese
Geographical mobility in Mechanicsville Same house 1 year ago 29,498 92.6% White (Caucasian)2,984 87.8% Black or African American55 62.5% American Indian / Alaska Native610 91.2% Asian484 100.0% Other race2,023 83.1% Two or more races29,443 92.5% White alone, not Hispanic / Latino662 94.6% Hispanic or LatinoMoved within same county 1,660 5.2% White / Caucasian235 6.9% Black or African American58 65.9% American Indian / Alaska Native25 3.8% Asian16 68.3% Native Hawaiian / Pacific Islander1 0.2% Other race74 3.0% Two or more races1,697 5.3% White alone, not Hispanic / Latino36 5.1% Hispanic or LatinoMoved within same state 645 2.0% White / Caucasian148 4.3% Black or African American14 2.1% Asian17 70.6% Native Hawaiian / Pacific Islander119 4.9% Two or more races639 2.0% White alone, not Hispanic / LatinoMoved from different state 92 0.3% White / Caucasian11 0.3% Black or African American12 1.8% Asian104 4.3% Two or more races92 0.3% White alone, not Hispanic / Latino
Children Nativity (place of birth) in Mechanicsville
Children under 6 years - Living with two parents Both parents native 1,562 99.4% Native10 0.6% Foreign-bornOne native, one foreign-born parent 94 100.0% NativeChildren under 6 years - Living with one parent Native parent 608 99.2% Native5 0.8% Foreign-bornForeign-born parent 3 100.0% Foreign-bornChildren 6 to 17 years - Living with two parents Both parents native 3,638 98.8% Native45 1.2% Foreign-bornBoth parents foreign-born 125 85.6% Native21 14.4% Foreign-bornOne native, one foreign-born parent 198 97.3% Native6 2.7% Foreign-bornChildren 6 to 17 years - Living with one parent Native parent 2,031 99.6% Native8 0.4% Foreign-bornForeign-born parent 41 54.4% Native35 45.6% Foreign-born
Grandparents responsible for own grandchildren in Mechanicsville
Grandparents (30 to 59 years) White / Caucasian 21 24.4% Responsible for grandchildren65 75.6% Not responsible for grandchildrenBlack or African American 8 100.0% Not responsible for grandchildrenWhite alone, not Hispanic / Latino 21 22.7% Responsible for grandchildren72 77.3% Not responsible for grandchildrenGrandparents (60 years and over) White / Caucasian 125 27.6% Responsible for grandchildren329 72.4% Not responsible for grandchildrenBlack or African American 43 100.0% Not responsible for grandchildrenWhite alone, not Hispanic / Latino 127 26.8% Responsible for grandchildren347 73.2% Not responsible for grandchildren