Races in Menomonie, Wisconsin (WI) Detailed Stats
Data:
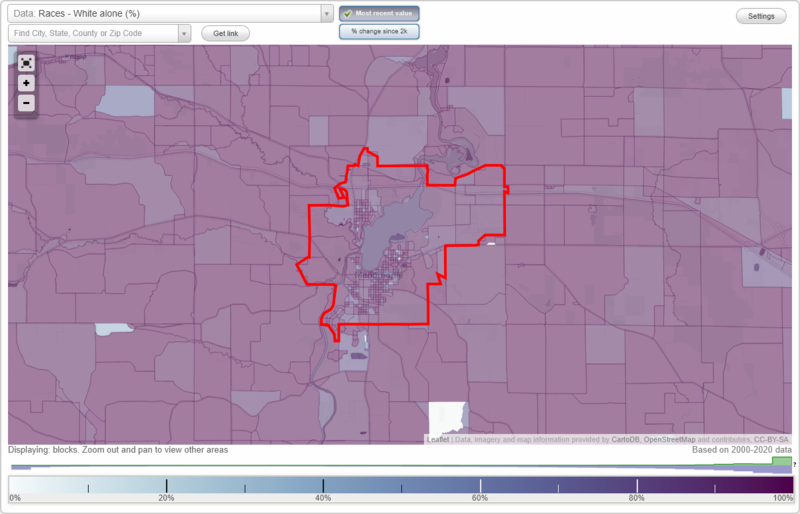
Races - White alone (%)
Races - White alone (% change since 2000)
Races - Black alone (%)
Races - Black alone (% change since 2000)
Races - American Indian alone (%)
Races - American Indian alone (% change since 2000)
Races - Asian alone (%)
Races - Asian alone (% change since 2000)
Races - Hispanic (%)
Races - Hispanic (% change since 2000)
Races - Native Hawaiian and Other Pacific Islander alone (%)
Races - Native Hawaiian and Other Pacific Islander alone (% change since 2000)
Races - Two or more races(%)
Races - Two or more races(% change since 2000)
Races - Other race alone (%)
Races - Other race alone (% change since 2000)
Racial diversity
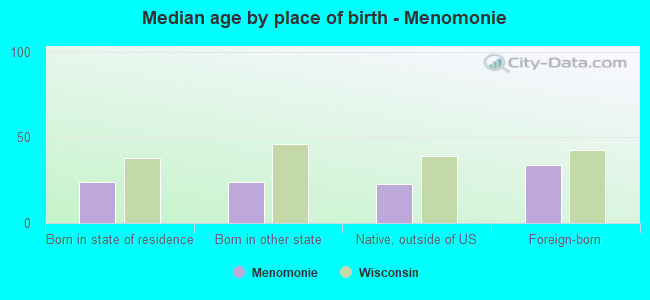
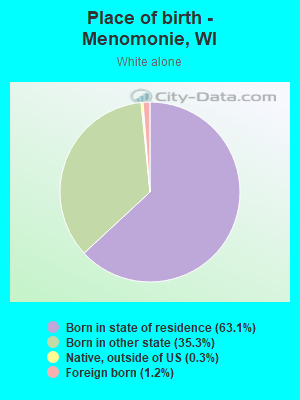
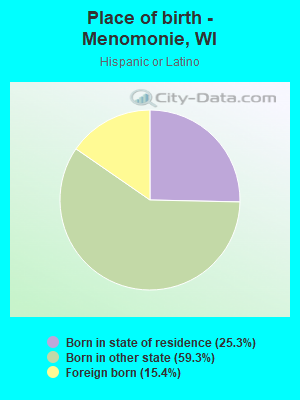
Place of birth - Born in state of residence (%)
Place of birth - Born in state of residence (%) - White
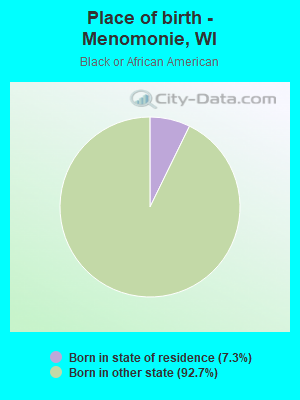
Place of birth - Born in state of residence (%) - Black or African American
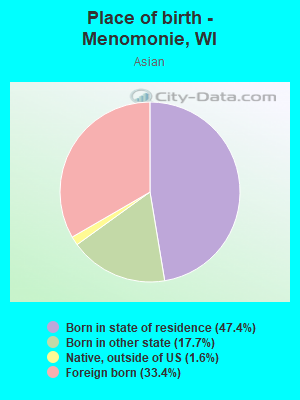
Place of birth - Born in state of residence (%) - Asian
Place of birth - Born in state of residence (%) - Hispanic or Latino
Place of birth - Born in state of residence (%) - American Indian and Alaska Native
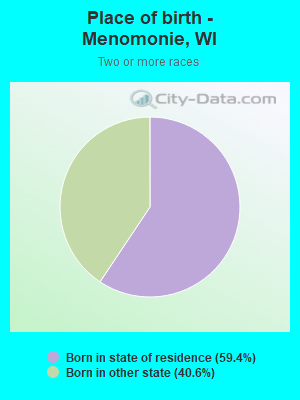
Place of birth - Born in state of residence (%) - Multirace
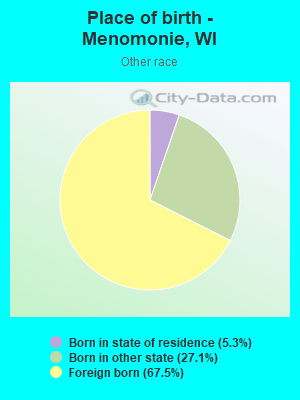
Place of birth - Born in state of residence (%) - Other Race
Place of birth - Born in other state (%)
Place of birth - Born in other state (%) - White
Place of birth - Born in other state (%) - Black or African American
Place of birth - Born in other state (%) - Asian
Place of birth - Born in other state (%) - Hispanic or Latino
Place of birth - Born in other state (%) - American Indian and Alaska Native
Place of birth - Born in other state (%) - Multirace
Place of birth - Born in other state (%) - Other Race
Place of birth - Native, outside of US (%)
Place of birth - Native, outside of US (%) - White
Place of birth - Native, outside of US (%) - Black or African American
Place of birth - Native, outside of US (%) - Asian
Place of birth - Native, outside of US (%) - Hispanic or Latino
Place of birth - Native, outside of US (%) - American Indian and Alaska Native
Place of birth - Native, outside of US (%) - Multirace
Place of birth - Native, outside of US (%) - Other Race
Place of birth - Foreign born (%)
Place of birth - Foreign born (%) - White
Place of birth - Foreign born (%) - Black or African American
Place of birth - Foreign born (%) - Asian
Place of birth - Foreign born (%) - Hispanic or Latino
Place of birth - Foreign born (%) - American Indian and Alaska Native
Place of birth - Foreign born (%) - Multirace
Place of birth - Foreign born (%) - Other Race
Residents speaking English at home (%)
Residents speaking English at home - Born in the United States (%)
Residents speaking English at home - Native, born elsewhere (%)
Residents speaking English at home - Foreign born (%)
Residents speaking Spanish at home (%)
Residents speaking Spanish at home - Born in the United States (%)
Residents speaking Spanish at home - Native, born elsewhere (%)
Residents speaking Spanish at home - Foreign born (%)
Residents speaking other language at home (%)
Residents speaking other language at home - Born in the United States (%)
Residents speaking other language at home - Native, born elsewhere (%)
Residents speaking other language at home - Foreign born (%)
Marital status - Never married (%)
Marital status - Now married (%)
Marital status - Separated (%)
Marital status - Widowed (%)
Marital status - Divorced (%)
Ancestries Reported - Arab (%)
Ancestries Reported - Czech (%)
Ancestries Reported - Danish (%)
Ancestries Reported - Dutch (%)
Ancestries Reported - English (%)
Ancestries Reported - French (%)
Ancestries Reported - French Canadian (%)
Ancestries Reported - German (%)
Ancestries Reported - Greek (%)
Ancestries Reported - Hungarian (%)
Ancestries Reported - Irish (%)
Ancestries Reported - Italian (%)
Ancestries Reported - Lithuanian (%)
Ancestries Reported - Norwegian (%)
Ancestries Reported - Polish (%)
Ancestries Reported - Portuguese (%)
Ancestries Reported - Russian (%)
Ancestries Reported - Scotch-Irish (%)
Ancestries Reported - Scottish (%)
Ancestries Reported - Slovak (%)
Ancestries Reported - Subsaharan African (%)
Ancestries Reported - Swedish (%)
Ancestries Reported - Swiss (%)
Ancestries Reported - Ukrainian (%)
Ancestries Reported - United States (%)
Ancestries Reported - Welsh (%)
Ancestries Reported - West Indian (%)
Ancestries Reported - Other (%)
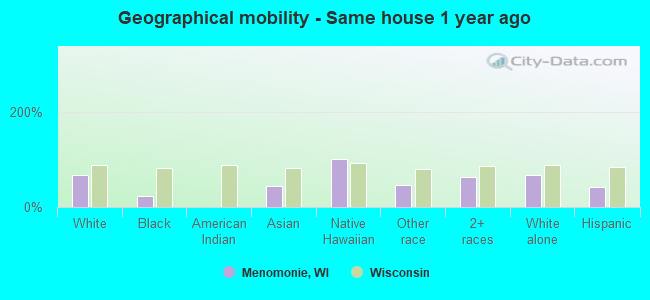
Geographical mobility - Same house 1 year ago (%)
Geographical mobility - Same house 1 year ago (%) - White
Geographical mobility - Same house 1 year ago (%) - Black or African American
Geographical mobility - Same house 1 year ago (%) - Asian
Geographical mobility - Same house 1 year ago (%) - Hispanic or Latino
Geographical mobility - Same house 1 year ago (%) - American Indian and Alaska Native
Geographical mobility - Same house 1 year ago (%) - Multirace
Geographical mobility - Same house 1 year ago (%) - Other Race
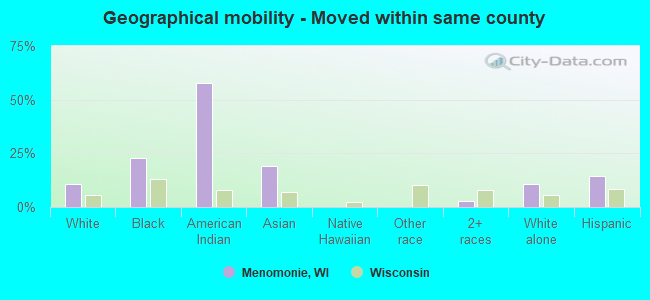
Geographical mobility - Moved within same county (%)
Geographical mobility - Moved within same county (%) - White
Geographical mobility - Moved within same county (%) - Black or African American
Geographical mobility - Moved within same county (%) - Asian
Geographical mobility - Moved within same county (%) - Hispanic or Latino
Geographical mobility - Moved within same county (%) - American Indian and Alaska Native
Geographical mobility - Moved within same county (%) - Multirace
Geographical mobility - Moved within same county (%) - Other Race
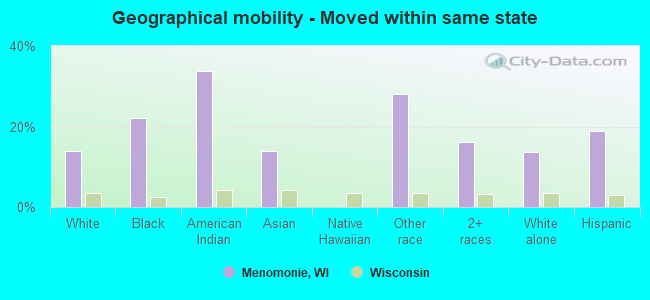
Geographical mobility - Moved from different county within same state (%)
Geographical mobility - Moved from different county within same state (%) - White
Geographical mobility - Moved from different county within same state (%) - Black or African American
Geographical mobility - Moved from different county within same state (%) - Asian
Geographical mobility - Moved from different county within same state (%) - Hispanic or Latino
Geographical mobility - Moved from different county within same state (%) - American Indian and Alaska Native
Geographical mobility - Moved from different county within same state (%) - Multirace
Geographical mobility - Moved from different county within same state (%) - Other Race
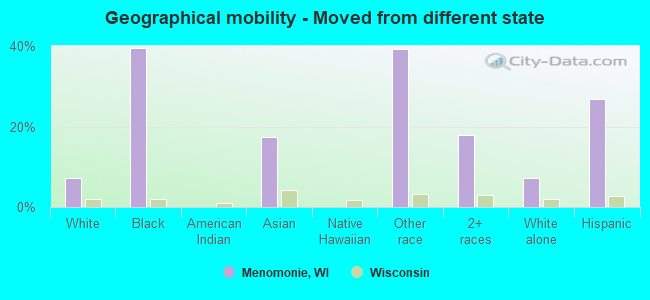
Geographical mobility - Moved from different state (%)
Geographical mobility - Moved from different state (%) - White
Geographical mobility - Moved from different state (%) - Black or African American
Geographical mobility - Moved from different state (%) - Asian
Geographical mobility - Moved from different state (%) - Hispanic or Latino
Geographical mobility - Moved from different state (%) - American Indian and Alaska Native
Geographical mobility - Moved from different state (%) - Multirace
Geographical mobility - Moved from different state (%) - Other Race
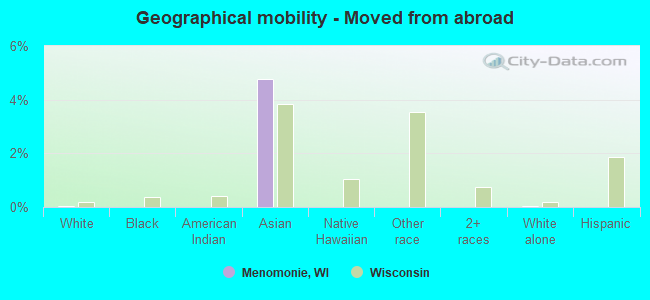
Geographical mobility - Moved from abroad (%)
Geographical mobility - Moved from abroad (%) - White
Geographical mobility - Moved from abroad (%) - Black or African American
Geographical mobility - Moved from abroad (%) - Asian
Geographical mobility - Moved from abroad (%) - Hispanic or Latino
Geographical mobility - Moved from abroad (%) - American Indian and Alaska Native
Geographical mobility - Moved from abroad (%) - Multirace
Geographical mobility - Moved from abroad (%) - Other Race
Place of birth for the foreign-born population - Ireland (%)
Place of birth for the foreign-born population - Denmark (%)
Place of birth for the foreign-born population - Norway (%)
Place of birth for the foreign-born population - Sweden (%)
Place of birth for the foreign-born population - United Kingdom (%)
Place of birth for the foreign-born population - England (%)
Place of birth for the foreign-born population - Scotland (%)
Place of birth for the foreign-born population - Other Northern Europe (%)
Place of birth for the foreign-born population - Austria (%)
Place of birth for the foreign-born population - Belgium (%)
Place of birth for the foreign-born population - France (%)
Place of birth for the foreign-born population - Germany (%)
Place of birth for the foreign-born population - Netherlands (%)
Place of birth for the foreign-born population - Switzerland (%)
Place of birth for the foreign-born population - Other Western Europe (%)
Place of birth for the foreign-born population - Greece (%)
Place of birth for the foreign-born population - Italy (%)
Place of birth for the foreign-born population - Portugal (%)
Place of birth for the foreign-born population - Spain (%)
Place of birth for the foreign-born population - Other Southern Europe (%)
Place of birth for the foreign-born population - Albania (%)
Place of birth for the foreign-born population - Belarus (%)
Place of birth for the foreign-born population - Bosnia and Herzegovina (%)
Place of birth for the foreign-born population - Bulgaria (%)
Place of birth for the foreign-born population - Croatia (%)
Place of birth for the foreign-born population - Czechoslovakia (%)
Place of birth for the foreign-born population - Hungary (%)
Place of birth for the foreign-born population - Latvia (%)
Place of birth for the foreign-born population - Lithuania (%)
Place of birth for the foreign-born population - North Macedonia (Macedonia) (%)
Place of birth for the foreign-born population - Moldova (%)
Place of birth for the foreign-born population - Poland (%)
Place of birth for the foreign-born population - Romania (%)
Place of birth for the foreign-born population - Russia (%)
Place of birth for the foreign-born population - Serbia (%)
Place of birth for the foreign-born population - Ukraine (%)
Place of birth for the foreign-born population - Other Eastern Europe (%)
Place of birth for the foreign-born population - China (%)
Place of birth for the foreign-born population - Hong Kong (%)
Place of birth for the foreign-born population - Taiwan (%)
Place of birth for the foreign-born population - Japan (%)
Place of birth for the foreign-born population - Korea (%)
Place of birth for the foreign-born population - Other Eastern Asia (%)
Place of birth for the foreign-born population - Afghanistan (%)
Place of birth for the foreign-born population - Bangladesh (%)
Place of birth for the foreign-born population - India (%)
Place of birth for the foreign-born population - Iran (%)
Place of birth for the foreign-born population - Kazakhstan (%)
Place of birth for the foreign-born population - Nepal (%)
Place of birth for the foreign-born population - Pakistan (%)
Place of birth for the foreign-born population - Sri Lanka (%)
Place of birth for the foreign-born population - Uzbekistan (%)
Place of birth for the foreign-born population - Other South Central Asia (%)
Place of birth for the foreign-born population - Burma (%)
Place of birth for the foreign-born population - Cambodia (%)
Place of birth for the foreign-born population - Indonesia (%)
Place of birth for the foreign-born population - Laos (%)
Place of birth for the foreign-born population - Malaysia (%)
Place of birth for the foreign-born population - Philippines (%)
Place of birth for the foreign-born population - Singapore (%)
Place of birth for the foreign-born population - Thailand (%)
Place of birth for the foreign-born population - Vietnam (%)
Place of birth for the foreign-born population - Other South Eastern Asia (%)
Place of birth for the foreign-born population - Armenia (%)
Place of birth for the foreign-born population - Iraq (%)
Place of birth for the foreign-born population - Israel (%)
Place of birth for the foreign-born population - Jordan (%)
Place of birth for the foreign-born population - Kuwait (%)
Place of birth for the foreign-born population - Lebanon (%)
Place of birth for the foreign-born population - Saudi Arabia (%)
Place of birth for the foreign-born population - Syria (%)
Place of birth for the foreign-born population - Turkey (%)
Place of birth for the foreign-born population - Yemen (%)
Place of birth for the foreign-born population - Other Western Asia (%)
Place of birth for the foreign-born population - Eritrea (%)
Place of birth for the foreign-born population - Ethiopia (%)
Place of birth for the foreign-born population - Kenya (%)
Place of birth for the foreign-born population - Somalia (%)
Place of birth for the foreign-born population - Uganda (%)
Place of birth for the foreign-born population - Zimbabwe (%)
Place of birth for the foreign-born population - Other Eastern Africa (%)
Place of birth for the foreign-born population - Cameroon (%)
Place of birth for the foreign-born population - Congo (%)
Place of birth for the foreign-born population - Democratic Republic of Congo (Zaire) (%)
Place of birth for the foreign-born population - Other Middle Africa (%)
Place of birth for the foreign-born population - Egypt (%)
Place of birth for the foreign-born population - Morocco (%)
Place of birth for the foreign-born population - Sudan (%)
Place of birth for the foreign-born population - Other Northern Africa (%)
Place of birth for the foreign-born population - South Africa (%)
Place of birth for the foreign-born population - Other Southern Africa (%)
Place of birth for the foreign-born population - Cabo Verde (%)
Place of birth for the foreign-born population - Ghana (%)
Place of birth for the foreign-born population - Liberia (%)
Place of birth for the foreign-born population - Nigeria (%)
Place of birth for the foreign-born population - Senegal (%)
Place of birth for the foreign-born population - Sierra Leone (%)
Place of birth for the foreign-born population - Other Western Africa (%)
Place of birth for the foreign-born population - Australia (%)
Place of birth for the foreign-born population - New Zealand (%)
Place of birth for the foreign-born population - Fiji (%)
Place of birth for the foreign-born population - Micronesia (%)
Place of birth for the foreign-born population - Bahamas (%)
Place of birth for the foreign-born population - Barbados (%)
Place of birth for the foreign-born population - Cuba (%)
Place of birth for the foreign-born population - Dominica (%)
Place of birth for the foreign-born population - Dominican Republic (%)
Place of birth for the foreign-born population - Grenada (%)
Place of birth for the foreign-born population - Haiti (%)
Place of birth for the foreign-born population - Jamaica (%)
Place of birth for the foreign-born population - St. Vincent and the Grenadines (%)
Place of birth for the foreign-born population - Trinidad and Tobago (%)
Place of birth for the foreign-born population - West Indies (%)
Place of birth for the foreign-born population - Other Caribbean (%)
Place of birth for the foreign-born population - Belize (%)
Place of birth for the foreign-born population - Costa Rica (%)
Place of birth for the foreign-born population - El Salvador (%)
Place of birth for the foreign-born population - Guatemala (%)
Place of birth for the foreign-born population - Honduras (%)
Place of birth for the foreign-born population - Mexico (%)
Place of birth for the foreign-born population - Nicaragua (%)
Place of birth for the foreign-born population - Panama (%)
Place of birth for the foreign-born population - Other Central America (%)
Place of birth for the foreign-born population - Argentina (%)
Place of birth for the foreign-born population - Bolivia (%)
Place of birth for the foreign-born population - Brazil (%)
Place of birth for the foreign-born population - Chile (%)
Place of birth for the foreign-born population - Colombia (%)
Place of birth for the foreign-born population - Ecuador (%)
Place of birth for the foreign-born population - Guyana (%)
Place of birth for the foreign-born population - Peru (%)
Place of birth for the foreign-born population - Uruguay (%)
Place of birth for the foreign-born population - Venezuela (%)
Place of birth for the foreign-born population - Other South America (%)
Place of birth for the foreign-born population - Canada (%)
Place of birth for the foreign-born population - Other Northern America (%)
Place of birth for the foreign-born population - Other (%)
Latest news about races in Menomonie, WI collected exclusively by city-data.com from local newspapers, TV, and radio stations
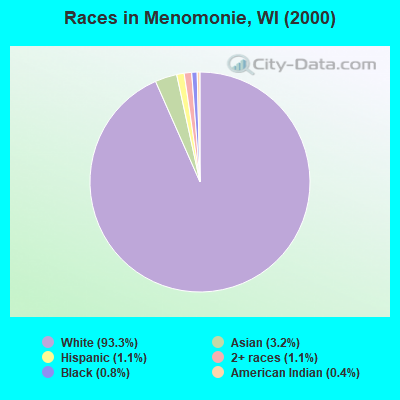
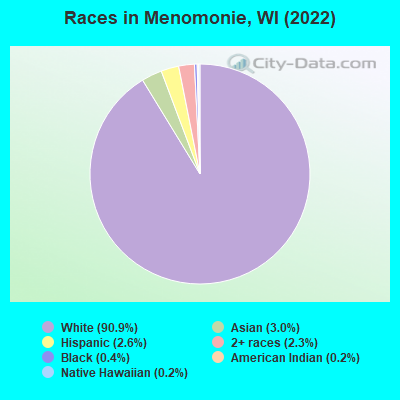
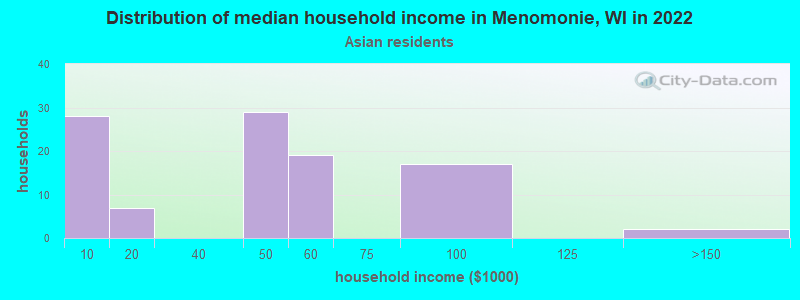
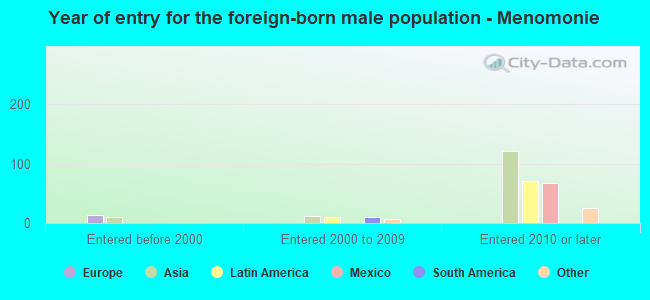
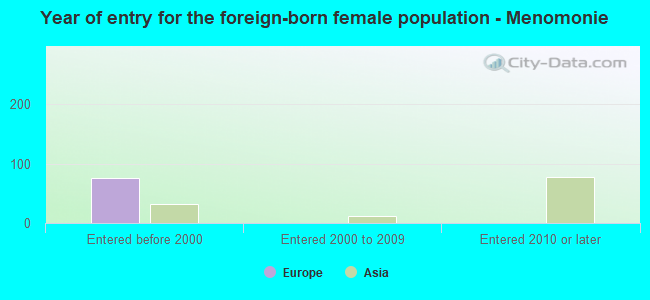
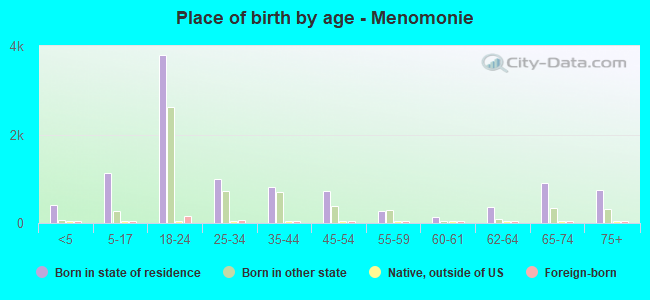
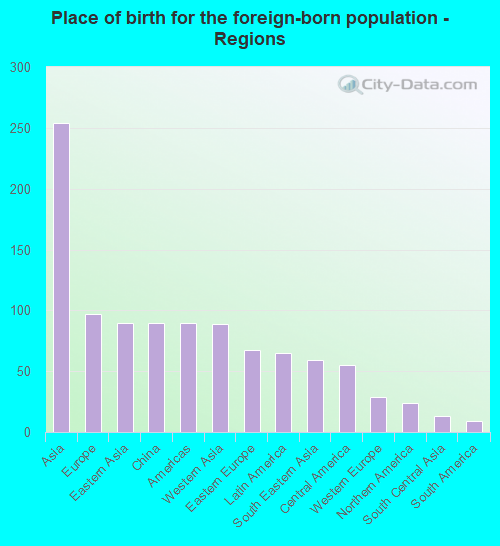
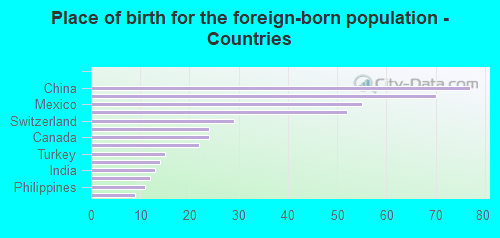
According to 2022 data, the most numerous races in Menomonie, WI are White alone (15,078 residents), Hispanic (424 residents), and Black alone (67 residents). 94.2% of Menomonie residents speak English at home. 2.7% of Menomonie, WI residents are foreign-born (1.5% born in Asia, 0.6% born in Europe, 0.4% born in Latin America), which is 87.3% less than the foreign-born rate of 5.0% across the entire state of Wisconsin.
Race distribution in Menomonie
2000 2022
4,681,630 87.3% White alone 300,245 5.6% Black alone 192,921 3.6% Hispanic 87,995 1.6% Asian alone 51,921 1.0% Two or more races 43,980 0.8% American Indian alone 3,637 0.07% Other race alone 1,346 0.03% Native Hawaiian and Other
4,654,031 79.0% White alone 447,022 7.6% Hispanic 345,678 5.9% Black alone 217,532 3.7% Two or more races 172,242 2.9% Asian alone 33,762 0.6% American Indian alone 19,680 0.3% Other race alone 2,592 0.04% Native Hawaiian and Other
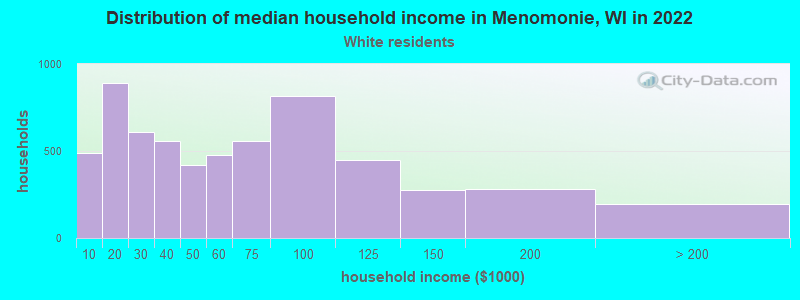
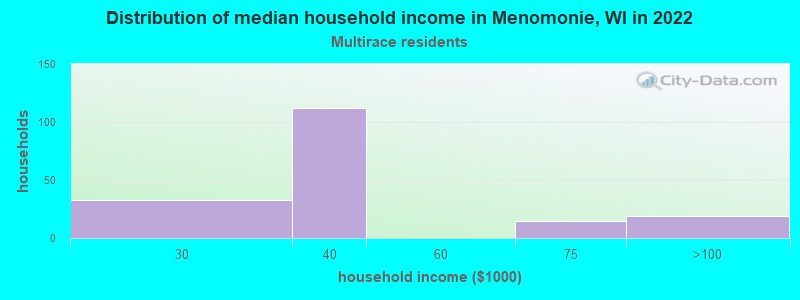
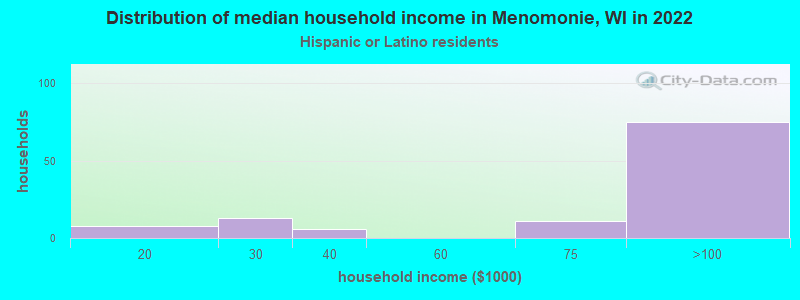
Income and house value in Menomonie Median household income in 2022 $50,382 White non-Hispanic householders$33,703 Two or more races householders$88,249 Hispanic or Latino race householdersMedian 2022 house value $214,003 White Non-Hispanic householders $169,485 Asian householders$231,178 Two or more races householders$62,144 Hispanic or Latino householders
Median age by race in Menomonie
25.4 Median age for White residents24.2 26.2 23.0 Median age for Black or African American residents22.3 24.9 59.7 Median age for American Indian / Alaska Native residents60.5 -689,393,938.7 23.3 Median age for Asian residents22.5 24.6 -825,688,072.6 Median age for Native Hawaiian / Pacific Islander residents-862,745,097.2 -732,444,443.7 26.1 Median age for Other race residents35.1 22.8 21.9 Median age for Two or more races residents21.7 22.4 25.1 Median age for White alone residents24.0 26.2 21.9 Median age for Hispanic or Latino residents24.7 21.4
Owner/renter occupied households by race in Menomonie
House owners and renters - White residents 2,394 40.8% Owner occupied3,468 59.2% Renter occupiedHouse owners and renters - Black or African American residents 4 100.0% Renter occupiedHouse owners and renters - Asian residents 5 4.5% Owner occupied95 95.5% Renter occupiedHouse owners and renters - Other race residents 13 100.0% Renter occupiedHouse owners and renters - Two or more races residents 14 7.7% Owner occupied169 92.3% Renter occupiedHouse owners and renters - White alone residents 2,342 40.0% Owner occupied3,516 60.0% Renter occupiedHouse owners and renters - Hispanic or Latino residents 67 58.4% Owner occupied48 41.6% Renter occupied
Language usage in Menomonie
English speakers - Total 94.2% of residents of Menomonie speak English at home.
1.1% of residents speak Spanish at home 135 75.0% Speak English very well45 25.0% Speak English less than very well4.7% of residents speak other language at home 427 56.3% Speak English very well331 43.7% Speak English less than very well
English speakers - Born in the United States 96.1% of residents of Menomonie speak English at home.
2.0% of residents speak Spanish at home 101 88.6% Speak English very well13 11.4% Speak English less than very well1.9% of residents speak other language at home 85 78.0% Speak English very well24 22.0% Speak English less than very well
All residents speak only English at home
English speakers - Foreign-born 22.6% of residents of Menomonie speak English at home.
12.0% of residents speak Spanish at home 29 54.7% Speak English very well24 45.3% Speak English less than very well65.9% of residents speak other language at home 82 28.1% Speak English very well210 71.9% Speak English less than very well
White (Caucasian) - Speak only English Native:
99.1% (14,346)Foreign-born:
23.6% (33)
White (Caucasian) - Speak another language Native:
1.1% (165)Foreign-born:
71.5% (99)
Asian - Speak only English Native:
44.8% (151)Foreign-born:
32.7% (55)
Asian - Speak another language Native:
54.2% (182)Foreign-born:
65.5% (111)
Other race - Speak another language Native:
73.5% (19)Foreign-born:
83.8% (49)
White alone - Speak only English Native:
98.8% (14,242)Foreign-born:
19.0% (36)
White alone - Speak another language Native:
1.2% (174)Foreign-born:
81.0% (152)
Hispanic or Latino - Speak only English Native:
79.7% (289)Foreign-born:
13.2% (9)
Hispanic or Latino - Speak another language Native:
21.9% (80)Foreign-born:
85.9% (58)
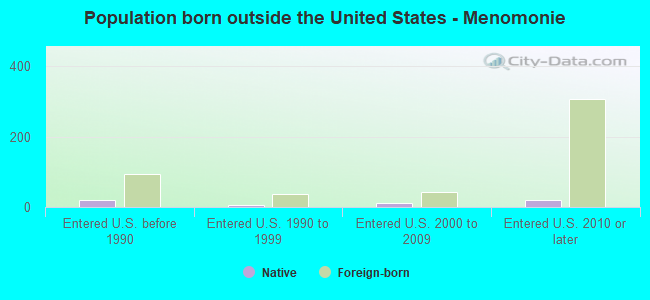
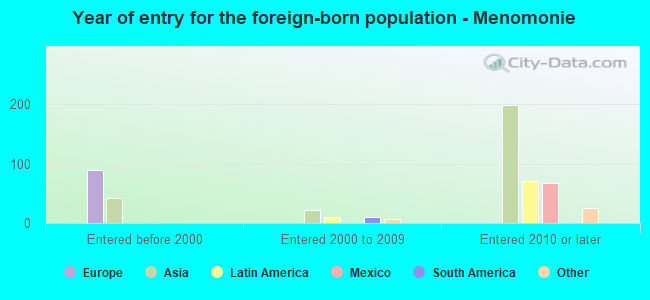
Foreign-born residents in Menomonie 443 residents are foreign born (1.5% Asia , 0.6% Europe , 0.4% Latin America ).
This city:
2.7%Wisconsin:
5.0%
Marital status for residents in Menomonie Marital status - White (Caucasian) population 15 years and over
Males 61.7% Never married26.8% Now married1.0% Separated2.3% Widowed8.2% DivorcedFemales 53.7% Never married24.0% Now married0.0% Separated8.6% Widowed13.7% DivorcedWomen who gave birth in the past 12 months Now married:
95.9% (159)Unmarried:
4.1% (7)
Women who did not give birth in the past 12 months Now married:
17.8% (803)Unmarried:
82.2% (3,713)
Marital status - Black or African American population 15 years and over
Males 95.5% Never married4.5% Now married0.0% Separated0.0% Widowed0.0% DivorcedFemales 100.0% Never married0.0% Now married0.0% Separated0.0% Widowed0.0% DivorcedWomen who did not give birth in the past 12 months Now married:
0.0% (0)Unmarried:
100.0% (22)
Marital status - Asian population 15 years and over
Males 86.0% Never married14.0% Now married0.0% Separated0.0% Widowed0.0% DivorcedFemales 81.5% Never married11.3% Now married0.0% Separated0.0% Widowed7.2% DivorcedWomen who gave birth in the past 12 months Now married:
100.0% (9)Unmarried:
0.0% (0)
Women who did not give birth in the past 12 months Now married:
0.0% (0)Unmarried:
100.0% (171)
Marital status - Other race population 15 years and over
Males 89.4% Never married10.6% Now married0.0% Separated0.0% Widowed0.0% DivorcedFemales 100.0% Never married0.0% Now married0.0% Separated0.0% Widowed0.0% DivorcedWomen who did not give birth in the past 12 months Now married:
0.0% (0)Unmarried:
100.0% (26)
Marital status - Two or more races population 15 years and over
Males 94.2% Never married5.3% Now married0.0% Separated0.0% Widowed0.4% DivorcedFemales 70.0% Never married13.8% Now married0.0% Separated0.0% Widowed16.2% DivorcedWomen who did not give birth in the past 12 months Now married:
15.1% (27)Unmarried:
84.9% (150)
Marital status - White alone, not Hispanic / Latino population 15 years and over
Males 62.0% Never married26.5% Now married1.0% Separated2.3% Widowed8.2% DivorcedFemales 53.4% Never married24.2% Now married0.0% Separated8.6% Widowed13.8% DivorcedWomen who gave birth in the past 12 months Now married:
95.9% (163)Unmarried:
4.1% (7)
Women who did not give birth in the past 12 months Now married:
18.0% (819)Unmarried:
82.0% (3,730)
Marital status - Hispanic or Latino population 15 years and over
Males 66.2% Never married29.9% Now married0.0% Separated0.0% Widowed3.9% DivorcedFemales 85.3% Never married0.0% Now married0.0% Separated6.6% Widowed8.1% DivorcedWomen who did not give birth in the past 12 months Now married:
0.0% (0)Unmarried:
100.0% (121)
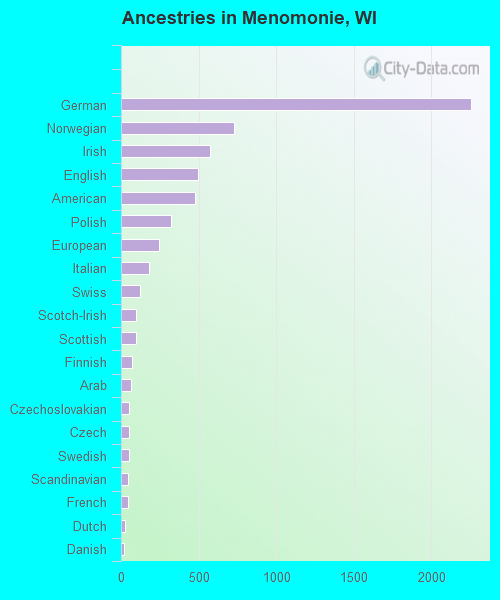
Ancestries in Menomonie
2,261 31.6% German728 10.2% Norwegian571 8.0% Irish497 6.9% English475 6.6% American324 4.5% Polish247 3.4% European183 2.6% Italian122 1.7% Swiss96 1.3% Scotch-Irish95 1.3% Scottish71 1.0% Finnish62 0.9% Arab52 0.7% Czechoslovakian51 0.7% Czech49 0.7% Swedish48 0.7% Scandinavian46 0.6% French24 0.3% Dutch22 0.3% Danish18 0.3% French Canadian14 0.2% Eastern European12 0.2% Northern European12 0.2% Turkish11 0.2% Austrian11 0.2% Somali10 0.1% British10 0.1% Ukrainian9 0.1% Moroccan7 0.10% Croatian4 0.06% Slovak4 0.06% Welsh3 0.04% Russian2 0.03% African2 0.03% Iranian
Geographical mobility in Menomonie Same house 1 year ago 10,052 67.5% White (Caucasian)15 22.7% Black or African American222 44.4% Asian25 100.0% Native Hawaiian / Pacific Islander40 46.5% Other race405 61.9% Two or more races10,164 68.0% White alone, not Hispanic / Latino173 40.8% Hispanic or LatinoMoved within same county 1,591 10.7% White / Caucasian16 23.0% Black or African American22 57.6% American Indian / Alaska Native96 19.1% Asian20 3.0% Two or more races1,571 10.5% White alone, not Hispanic / Latino62 14.6% Hispanic or LatinoMoved within same state 2,055 13.8% White / Caucasian15 22.2% Black or African American13 33.8% American Indian / Alaska Native70 14.0% Asian24 28.2% Other race105 16.1% Two or more races2,031 13.6% White alone, not Hispanic / Latino80 18.9% Hispanic or LatinoMoved from different state 1,088 7.3% White / Caucasian27 39.5% Black or African American87 17.3% Asian33 39.2% Other race117 17.8% Two or more races1,073 7.2% White alone, not Hispanic / Latino114 26.9% Hispanic or LatinoMoved from abroad 4 0.0% White24 4.8% Asian4 0.0% White alone, not Hispanic / Latino
Children Nativity (place of birth) in Menomonie
Children under 6 years - Living with two parents Both parents native 447 100.0% NativeBoth parents foreign-born 5 50.3% Native5 49.7% Foreign-bornOne native, one foreign-born parent 12 100.0% NativeChildren under 6 years - Living with one parent Native parent 127 100.0% NativeChildren 6 to 17 years - Living with two parents Both parents native 755 100.0% NativeBoth parents foreign-born 24 100.0% NativeOne native, one foreign-born parent 68 100.0% NativeChildren 6 to 17 years - Living with one parent Native parent 381 100.0% NativeForeign-born parent 33 48.4% Native35 51.6% Foreign-born
Grandparents responsible for own grandchildren in Menomonie
Grandparents (30 to 59 years) White / Caucasian 39 100.0% Not responsible for grandchildrenWhite alone, not Hispanic / Latino 40 100.0% Not responsible for grandchildren
Grandparents (60 years and over) White / Caucasian 50 100.0% Not responsible for grandchildrenWhite alone, not Hispanic / Latino 52 100.0% Not responsible for grandchildren