Races in Ojus, Florida (FL) Detailed Stats
Data:
Races - White alone (%)
Races - White alone (% change since 2000)
Races - Black alone (%)
Races - Black alone (% change since 2000)
Races - American Indian alone (%)
Races - American Indian alone (% change since 2000)
Races - Asian alone (%)
Races - Asian alone (% change since 2000)
Races - Hispanic (%)
Races - Hispanic (% change since 2000)
Races - Native Hawaiian and Other Pacific Islander alone (%)
Races - Native Hawaiian and Other Pacific Islander alone (% change since 2000)
Races - Two or more races(%)
Races - Two or more races(% change since 2000)
Races - Other race alone (%)
Races - Other race alone (% change since 2000)
Racial diversity
Place of birth - Born in state of residence (%)
Place of birth - Born in state of residence (%) - White
Place of birth - Born in state of residence (%) - Black or African American
Place of birth - Born in state of residence (%) - Asian
Place of birth - Born in state of residence (%) - Hispanic or Latino
Place of birth - Born in state of residence (%) - American Indian and Alaska Native
Place of birth - Born in state of residence (%) - Multirace
Place of birth - Born in state of residence (%) - Other Race
Place of birth - Born in other state (%)
Place of birth - Born in other state (%) - White
Place of birth - Born in other state (%) - Black or African American
Place of birth - Born in other state (%) - Asian
Place of birth - Born in other state (%) - Hispanic or Latino
Place of birth - Born in other state (%) - American Indian and Alaska Native
Place of birth - Born in other state (%) - Multirace
Place of birth - Born in other state (%) - Other Race
Place of birth - Native, outside of US (%)
Place of birth - Native, outside of US (%) - White
Place of birth - Native, outside of US (%) - Black or African American
Place of birth - Native, outside of US (%) - Asian
Place of birth - Native, outside of US (%) - Hispanic or Latino
Place of birth - Native, outside of US (%) - American Indian and Alaska Native
Place of birth - Native, outside of US (%) - Multirace
Place of birth - Native, outside of US (%) - Other Race
Place of birth - Foreign born (%)
Place of birth - Foreign born (%) - White
Place of birth - Foreign born (%) - Black or African American
Place of birth - Foreign born (%) - Asian
Place of birth - Foreign born (%) - Hispanic or Latino
Place of birth - Foreign born (%) - American Indian and Alaska Native
Place of birth - Foreign born (%) - Multirace
Place of birth - Foreign born (%) - Other Race
Residents speaking English at home (%)
Residents speaking English at home - Born in the United States (%)
Residents speaking English at home - Native, born elsewhere (%)
Residents speaking English at home - Foreign born (%)
Residents speaking Spanish at home (%)
Residents speaking Spanish at home - Born in the United States (%)
Residents speaking Spanish at home - Native, born elsewhere (%)
Residents speaking Spanish at home - Foreign born (%)
Residents speaking other language at home (%)
Residents speaking other language at home - Born in the United States (%)
Residents speaking other language at home - Native, born elsewhere (%)
Residents speaking other language at home - Foreign born (%)
Marital status - Never married (%)
Marital status - Now married (%)
Marital status - Separated (%)
Marital status - Widowed (%)
Marital status - Divorced (%)
Ancestries Reported - Arab (%)
Ancestries Reported - Czech (%)
Ancestries Reported - Danish (%)
Ancestries Reported - Dutch (%)
Ancestries Reported - English (%)
Ancestries Reported - French (%)
Ancestries Reported - French Canadian (%)
Ancestries Reported - German (%)
Ancestries Reported - Greek (%)
Ancestries Reported - Hungarian (%)
Ancestries Reported - Irish (%)
Ancestries Reported - Italian (%)
Ancestries Reported - Lithuanian (%)
Ancestries Reported - Norwegian (%)
Ancestries Reported - Polish (%)
Ancestries Reported - Portuguese (%)
Ancestries Reported - Russian (%)
Ancestries Reported - Scotch-Irish (%)
Ancestries Reported - Scottish (%)
Ancestries Reported - Slovak (%)
Ancestries Reported - Subsaharan African (%)
Ancestries Reported - Swedish (%)
Ancestries Reported - Swiss (%)
Ancestries Reported - Ukrainian (%)
Ancestries Reported - United States (%)
Ancestries Reported - Welsh (%)
Ancestries Reported - West Indian (%)
Ancestries Reported - Other (%)
Geographical mobility - Same house 1 year ago (%)
Geographical mobility - Same house 1 year ago (%) - White
Geographical mobility - Same house 1 year ago (%) - Black or African American
Geographical mobility - Same house 1 year ago (%) - Asian
Geographical mobility - Same house 1 year ago (%) - Hispanic or Latino
Geographical mobility - Same house 1 year ago (%) - American Indian and Alaska Native
Geographical mobility - Same house 1 year ago (%) - Multirace
Geographical mobility - Same house 1 year ago (%) - Other Race
Geographical mobility - Moved within same county (%)
Geographical mobility - Moved within same county (%) - White
Geographical mobility - Moved within same county (%) - Black or African American
Geographical mobility - Moved within same county (%) - Asian
Geographical mobility - Moved within same county (%) - Hispanic or Latino
Geographical mobility - Moved within same county (%) - American Indian and Alaska Native
Geographical mobility - Moved within same county (%) - Multirace
Geographical mobility - Moved within same county (%) - Other Race
Geographical mobility - Moved from different county within same state (%)
Geographical mobility - Moved from different county within same state (%) - White
Geographical mobility - Moved from different county within same state (%) - Black or African American
Geographical mobility - Moved from different county within same state (%) - Asian
Geographical mobility - Moved from different county within same state (%) - Hispanic or Latino
Geographical mobility - Moved from different county within same state (%) - American Indian and Alaska Native
Geographical mobility - Moved from different county within same state (%) - Multirace
Geographical mobility - Moved from different county within same state (%) - Other Race
Geographical mobility - Moved from different state (%)
Geographical mobility - Moved from different state (%) - White
Geographical mobility - Moved from different state (%) - Black or African American
Geographical mobility - Moved from different state (%) - Asian
Geographical mobility - Moved from different state (%) - Hispanic or Latino
Geographical mobility - Moved from different state (%) - American Indian and Alaska Native
Geographical mobility - Moved from different state (%) - Multirace
Geographical mobility - Moved from different state (%) - Other Race
Geographical mobility - Moved from abroad (%)
Geographical mobility - Moved from abroad (%) - White
Geographical mobility - Moved from abroad (%) - Black or African American
Geographical mobility - Moved from abroad (%) - Asian
Geographical mobility - Moved from abroad (%) - Hispanic or Latino
Geographical mobility - Moved from abroad (%) - American Indian and Alaska Native
Geographical mobility - Moved from abroad (%) - Multirace
Geographical mobility - Moved from abroad (%) - Other Race
Place of birth for the foreign-born population - Ireland (%)
Place of birth for the foreign-born population - Denmark (%)
Place of birth for the foreign-born population - Norway (%)
Place of birth for the foreign-born population - Sweden (%)
Place of birth for the foreign-born population - United Kingdom (%)
Place of birth for the foreign-born population - England (%)
Place of birth for the foreign-born population - Scotland (%)
Place of birth for the foreign-born population - Other Northern Europe (%)
Place of birth for the foreign-born population - Austria (%)
Place of birth for the foreign-born population - Belgium (%)
Place of birth for the foreign-born population - France (%)
Place of birth for the foreign-born population - Germany (%)
Place of birth for the foreign-born population - Netherlands (%)
Place of birth for the foreign-born population - Switzerland (%)
Place of birth for the foreign-born population - Other Western Europe (%)
Place of birth for the foreign-born population - Greece (%)
Place of birth for the foreign-born population - Italy (%)
Place of birth for the foreign-born population - Portugal (%)
Place of birth for the foreign-born population - Spain (%)
Place of birth for the foreign-born population - Other Southern Europe (%)
Place of birth for the foreign-born population - Albania (%)
Place of birth for the foreign-born population - Belarus (%)
Place of birth for the foreign-born population - Bosnia and Herzegovina (%)
Place of birth for the foreign-born population - Bulgaria (%)
Place of birth for the foreign-born population - Croatia (%)
Place of birth for the foreign-born population - Czechoslovakia (%)
Place of birth for the foreign-born population - Hungary (%)
Place of birth for the foreign-born population - Latvia (%)
Place of birth for the foreign-born population - Lithuania (%)
Place of birth for the foreign-born population - North Macedonia (Macedonia) (%)
Place of birth for the foreign-born population - Moldova (%)
Place of birth for the foreign-born population - Poland (%)
Place of birth for the foreign-born population - Romania (%)
Place of birth for the foreign-born population - Russia (%)
Place of birth for the foreign-born population - Serbia (%)
Place of birth for the foreign-born population - Ukraine (%)
Place of birth for the foreign-born population - Other Eastern Europe (%)
Place of birth for the foreign-born population - China (%)
Place of birth for the foreign-born population - Hong Kong (%)
Place of birth for the foreign-born population - Taiwan (%)
Place of birth for the foreign-born population - Japan (%)
Place of birth for the foreign-born population - Korea (%)
Place of birth for the foreign-born population - Other Eastern Asia (%)
Place of birth for the foreign-born population - Afghanistan (%)
Place of birth for the foreign-born population - Bangladesh (%)
Place of birth for the foreign-born population - India (%)
Place of birth for the foreign-born population - Iran (%)
Place of birth for the foreign-born population - Kazakhstan (%)
Place of birth for the foreign-born population - Nepal (%)
Place of birth for the foreign-born population - Pakistan (%)
Place of birth for the foreign-born population - Sri Lanka (%)
Place of birth for the foreign-born population - Uzbekistan (%)
Place of birth for the foreign-born population - Other South Central Asia (%)
Place of birth for the foreign-born population - Burma (%)
Place of birth for the foreign-born population - Cambodia (%)
Place of birth for the foreign-born population - Indonesia (%)
Place of birth for the foreign-born population - Laos (%)
Place of birth for the foreign-born population - Malaysia (%)
Place of birth for the foreign-born population - Philippines (%)
Place of birth for the foreign-born population - Singapore (%)
Place of birth for the foreign-born population - Thailand (%)
Place of birth for the foreign-born population - Vietnam (%)
Place of birth for the foreign-born population - Other South Eastern Asia (%)
Place of birth for the foreign-born population - Armenia (%)
Place of birth for the foreign-born population - Iraq (%)
Place of birth for the foreign-born population - Israel (%)
Place of birth for the foreign-born population - Jordan (%)
Place of birth for the foreign-born population - Kuwait (%)
Place of birth for the foreign-born population - Lebanon (%)
Place of birth for the foreign-born population - Saudi Arabia (%)
Place of birth for the foreign-born population - Syria (%)
Place of birth for the foreign-born population - Turkey (%)
Place of birth for the foreign-born population - Yemen (%)
Place of birth for the foreign-born population - Other Western Asia (%)
Place of birth for the foreign-born population - Eritrea (%)
Place of birth for the foreign-born population - Ethiopia (%)
Place of birth for the foreign-born population - Kenya (%)
Place of birth for the foreign-born population - Somalia (%)
Place of birth for the foreign-born population - Uganda (%)
Place of birth for the foreign-born population - Zimbabwe (%)
Place of birth for the foreign-born population - Other Eastern Africa (%)
Place of birth for the foreign-born population - Cameroon (%)
Place of birth for the foreign-born population - Congo (%)
Place of birth for the foreign-born population - Democratic Republic of Congo (Zaire) (%)
Place of birth for the foreign-born population - Other Middle Africa (%)
Place of birth for the foreign-born population - Egypt (%)
Place of birth for the foreign-born population - Morocco (%)
Place of birth for the foreign-born population - Sudan (%)
Place of birth for the foreign-born population - Other Northern Africa (%)
Place of birth for the foreign-born population - South Africa (%)
Place of birth for the foreign-born population - Other Southern Africa (%)
Place of birth for the foreign-born population - Cabo Verde (%)
Place of birth for the foreign-born population - Ghana (%)
Place of birth for the foreign-born population - Liberia (%)
Place of birth for the foreign-born population - Nigeria (%)
Place of birth for the foreign-born population - Senegal (%)
Place of birth for the foreign-born population - Sierra Leone (%)
Place of birth for the foreign-born population - Other Western Africa (%)
Place of birth for the foreign-born population - Australia (%)
Place of birth for the foreign-born population - New Zealand (%)
Place of birth for the foreign-born population - Fiji (%)
Place of birth for the foreign-born population - Micronesia (%)
Place of birth for the foreign-born population - Bahamas (%)
Place of birth for the foreign-born population - Barbados (%)
Place of birth for the foreign-born population - Cuba (%)
Place of birth for the foreign-born population - Dominica (%)
Place of birth for the foreign-born population - Dominican Republic (%)
Place of birth for the foreign-born population - Grenada (%)
Place of birth for the foreign-born population - Haiti (%)
Place of birth for the foreign-born population - Jamaica (%)
Place of birth for the foreign-born population - St. Vincent and the Grenadines (%)
Place of birth for the foreign-born population - Trinidad and Tobago (%)
Place of birth for the foreign-born population - West Indies (%)
Place of birth for the foreign-born population - Other Caribbean (%)
Place of birth for the foreign-born population - Belize (%)
Place of birth for the foreign-born population - Costa Rica (%)
Place of birth for the foreign-born population - El Salvador (%)
Place of birth for the foreign-born population - Guatemala (%)
Place of birth for the foreign-born population - Honduras (%)
Place of birth for the foreign-born population - Mexico (%)
Place of birth for the foreign-born population - Nicaragua (%)
Place of birth for the foreign-born population - Panama (%)
Place of birth for the foreign-born population - Other Central America (%)
Place of birth for the foreign-born population - Argentina (%)
Place of birth for the foreign-born population - Bolivia (%)
Place of birth for the foreign-born population - Brazil (%)
Place of birth for the foreign-born population - Chile (%)
Place of birth for the foreign-born population - Colombia (%)
Place of birth for the foreign-born population - Ecuador (%)
Place of birth for the foreign-born population - Guyana (%)
Place of birth for the foreign-born population - Peru (%)
Place of birth for the foreign-born population - Uruguay (%)
Place of birth for the foreign-born population - Venezuela (%)
Place of birth for the foreign-born population - Other South America (%)
Place of birth for the foreign-born population - Canada (%)
Place of birth for the foreign-born population - Other Northern America (%)
Place of birth for the foreign-born population - Other (%)
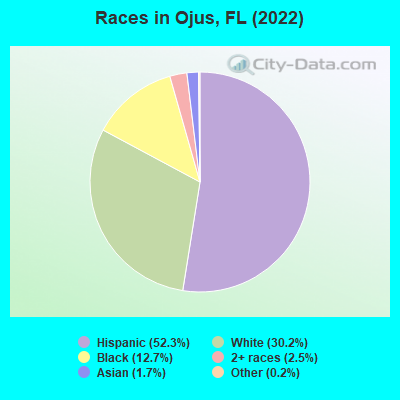
According to 2022 data, the most numerous races in Ojus, FL are White alone (4,942 residents), Hispanic (8,560 residents), and Black alone (2,079 residents). 33.6% of Ojus residents speak English at home. 52.6% of Ojus, FL residents are foreign-born (43.0% born in Latin America), which is 60.1% greater than the foreign-born rate of 21.0% across the entire state of Florida.
Race distribution in Ojus
2000 2022
10,458,509 65.4% White alone 2,682,715 16.8% Hispanic 2,264,268 14.2% Black alone 261,693 1.6% Asian alone 236,954 1.5% Two or more races 42,358 0.3% American Indian alone 28,994 0.2% Other race alone 6,887 0.04% Native Hawaiian and Other
11,309,403 50.8% White alone 6,025,039 27.1% Hispanic 3,241,015 14.6% Black alone 861,630 3.9% Two or more races 623,692 2.8% Asian alone 152,054 0.7% Other race alone 22,504 0.1% American Indian alone 9,486 0.04% Native Hawaiian and Other
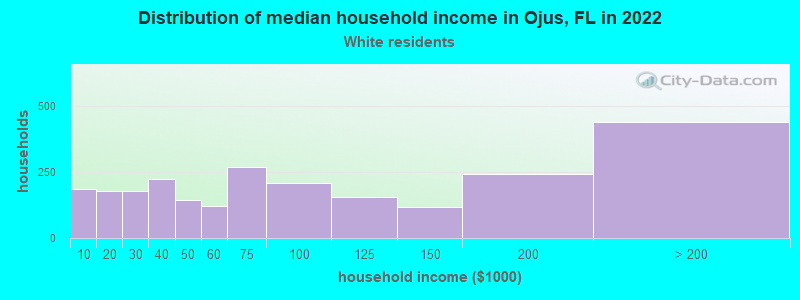
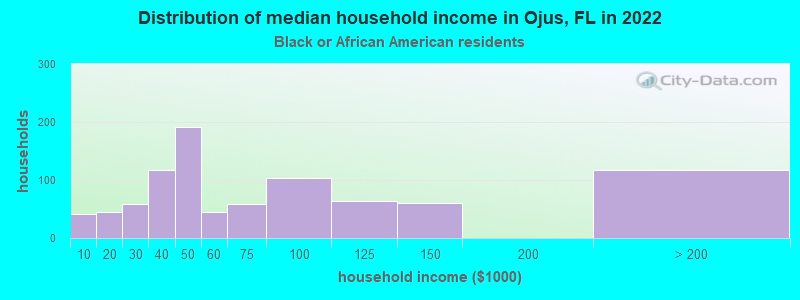
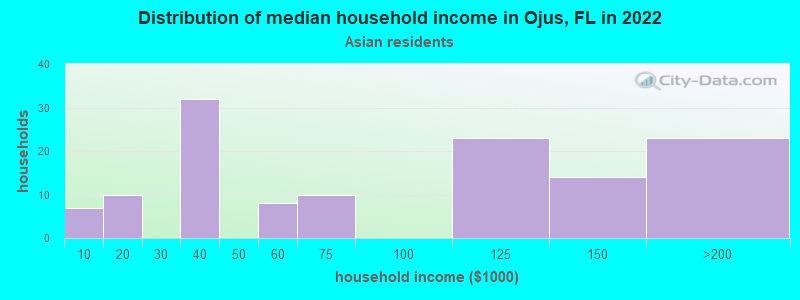
Income and house value in Ojus Median household income in 2022 $75,269 White non-Hispanic householders$52,398 Black householders$63,551 Two or more races householders$49,800 Hispanic or Latino race householdersMedian 2022 house value over $1,000,000 White Non-Hispanic householdersover $1,000,000 Black or African American householders $895,576 Asian householders$841,921 Some other race householders$784,842 Two or more races householdersover $1,000,000 Hispanic or Latino householders
Median age by race in Ojus
42.1 Median age for White residents39.1 45.6 32.8 Median age for Black or African American residents31.5 33.6 -653,446,647.1 Median age for American Indian / Alaska Native residents-543,352,600.6 -762,696,213.5 59.0 Median age for Asian residents61.8 56.5 -679,849,340.2 Median age for Native Hawaiian / Pacific Islander residents-858,307,848.3 -443,298,968.6 51.3 Median age for Other race residents41.6 54.3 48.2 Median age for Two or more races residents45.8 49.7 48.4 Median age for White alone residents43.8 53.4 45.0 Median age for Hispanic or Latino residents40.9 49.5
Owner/renter occupied households by race in Ojus
House owners and renters - White residents 1,941 77.2% Owner occupied574 22.8% Renter occupiedHouse owners and renters - Black or African American residents 382 42.3% Owner occupied521 57.7% Renter occupiedHouse owners and renters - Asian residents 115 86.2% Owner occupied19 13.8% Renter occupiedHouse owners and renters - Other race residents 395 63.3% Owner occupied228 36.7% Renter occupiedHouse owners and renters - Two or more races residents 1,237 62.5% Owner occupied743 37.5% Renter occupiedHouse owners and renters - White alone residents 1,810 82.7% Owner occupied379 17.3% Renter occupiedHouse owners and renters - Hispanic or Latino residents 2,391 63.8% Owner occupied1,356 36.2% Renter occupied
Language usage in Ojus
English speakers - Total 33.6% of residents of Ojus speak English at home.
47.6% of residents speak Spanish at home 4,202 56.5% Speak English very well3,229 43.5% Speak English less than very well19.0% of residents speak other language at home 2,167 73.0% Speak English very well800 27.0% Speak English less than very well
English speakers - Born in the United States 73.9% of residents of Ojus speak English at home.
20.1% of residents speak Spanish at home 554 95.7% Speak English very well25 4.3% Speak English less than very well5.9% of residents speak other language at home 169 100.0% Speak English very well
English speakers - Native, born elsewhere 37.7% of residents of Ojus speak English at home.
64.5% of residents speak Spanish at home 241 68.7% Speak English very well110 31.3% Speak English less than very well
English speakers - Foreign-born 11.6% of residents of Ojus speak English at home.
64.1% of residents speak Spanish at home 2,440 44.7% Speak English very well3,023 55.3% Speak English less than very well24.1% of residents speak other language at home 1,312 64.0% Speak English very well738 36.0% Speak English less than very well
White (Caucasian) - Speak only English Native:
82.2% (3,002)Foreign-born:
8.3% (157)
White (Caucasian) - Speak another language Native:
27.3% (995)Foreign-born:
91.2% (1,722)
Black or African American - Speak only English Native:
62.5% (736)Foreign-born:
32.8% (337)
Black or African American - Speak another language Native:
37.5% (442)Foreign-born:
67.7% (697)
Asian - Speak only English Native:
56.3% (12)Foreign-born:
19.0% (50)
Asian - Speak another language Native:
43.7% (10)Foreign-born:
81.0% (214)
Other race - Speak only English Native:
11.7% (30)Foreign-born:
31.2% (301)
Other race - Speak another language Native:
88.3% (225)Foreign-born:
68.3% (659)
Two or more races - Speak only English Native:
28.7% (351)Foreign-born:
5.0% (161)
Two or more races - Speak another language Native:
71.0% (868)Foreign-born:
95.1% (3,044)
White alone - Speak only English Native:
83.3% (2,966)Foreign-born:
16.0% (182)
White alone - Speak another language Native:
17.2% (612)Foreign-born:
81.5% (931)
Hispanic or Latino - Speak only English Native:
29.7% (698)Foreign-born:
6.5% (378)
Hispanic or Latino - Speak another language Native:
70.8% (1,664)Foreign-born:
93.7% (5,489)
Foreign-born residents in Ojus 8,611 residents are foreign born (43.0% Latin America ).
This city:
52.6%Florida:
21.1%
Marital status for residents in Ojus Marital status - White (Caucasian) population 15 years and over
Males 34.5% Never married49.8% Now married2.2% Separated3.1% Widowed10.4% DivorcedFemales 20.6% Never married47.4% Now married2.3% Separated13.2% Widowed16.5% DivorcedWomen who gave birth in the past 12 months Now married:
100.0% (20)Unmarried:
0.0% (0)
Women who did not give birth in the past 12 months Now married:
49.0% (461)Unmarried:
51.0% (480)
Marital status - Black or African American population 15 years and over
Males 45.9% Never married40.4% Now married0.0% Separated1.3% Widowed12.4% DivorcedFemales 49.3% Never married33.3% Now married0.5% Separated3.4% Widowed13.5% DivorcedWomen who gave birth in the past 12 months Now married:
0.0% (0)Unmarried:
100.0% (31)
Women who did not give birth in the past 12 months Now married:
17.5% (145)Unmarried:
82.5% (682)
Marital status - Asian population 15 years and over
Males 25.3% Never married62.0% Now married0.0% Separated12.7% Widowed0.0% DivorcedFemales 28.2% Never married27.7% Now married0.0% Separated34.5% Widowed9.7% DivorcedWomen who did not give birth in the past 12 months Now married:
23.2% (14)Unmarried:
76.8% (45)
Marital status - Other race population 15 years and over
Males 11.5% Never married88.5% Now married0.0% Separated0.0% Widowed0.0% DivorcedFemales 21.4% Never married47.4% Now married0.0% Separated6.1% Widowed25.1% DivorcedWomen who gave birth in the past 12 months Now married:
0.0% (0)Unmarried:
100.0% (25)
Women who did not give birth in the past 12 months Now married:
27.3% (59)Unmarried:
72.7% (156)
Marital status - Two or more races population 15 years and over
Males 25.1% Never married53.0% Now married2.9% Separated1.2% Widowed17.7% DivorcedFemales 17.4% Never married59.0% Now married7.3% Separated2.9% Widowed13.3% DivorcedWomen who gave birth in the past 12 months Now married:
76.7% (73)Unmarried:
23.3% (22)
Women who did not give birth in the past 12 months Now married:
58.7% (382)Unmarried:
41.3% (269)
Marital status - White alone, not Hispanic / Latino population 15 years and over
Males 38.0% Never married45.1% Now married0.0% Separated4.6% Widowed12.3% DivorcedFemales 19.0% Never married45.3% Now married2.9% Separated17.7% Widowed15.2% DivorcedWomen who gave birth in the past 12 months Now married:
100.0% (6)Unmarried:
0.0% (0)
Women who did not give birth in the past 12 months Now married:
49.8% (346)Unmarried:
50.2% (349)
Marital status - Hispanic or Latino population 15 years and over
Males 28.4% Never married57.1% Now married3.6% Separated1.2% Widowed9.7% DivorcedFemales 23.7% Never married50.2% Now married3.1% Separated6.4% Widowed16.6% DivorcedWomen who gave birth in the past 12 months Now married:
78.8% (65)Unmarried:
21.2% (18)
Women who did not give birth in the past 12 months Now married:
43.8% (740)Unmarried:
56.2% (949)
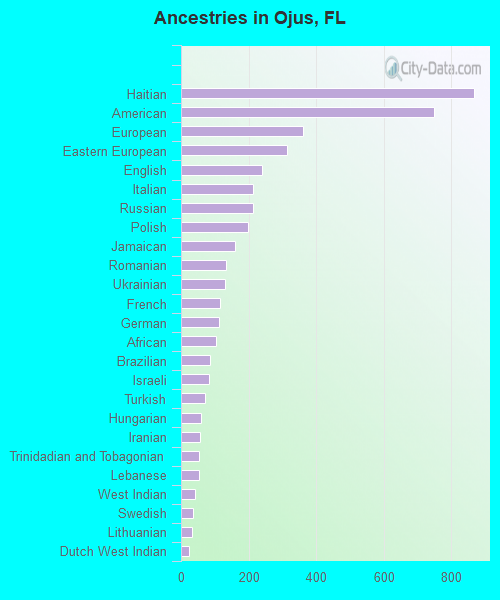
Ancestries in Ojus
869 8.6% Haitian750 7.4% American361 3.6% European315 3.1% Eastern European240 2.4% English213 2.1% Italian213 2.1% Russian199 2.0% Polish161 1.6% Jamaican134 1.3% Romanian130 1.3% Ukrainian116 1.2% French114 1.1% German104 1.0% African87 0.9% Brazilian83 0.8% Israeli70 0.7% Turkish59 0.6% Hungarian57 0.6% Iranian53 0.5% Trinidadian and Tobagonian52 0.5% Lebanese40 0.4% West Indian37 0.4% Swedish32 0.3% Lithuanian25 0.2% Dutch West Indian23 0.2% Moroccan21 0.2% Norwegian20 0.2% Slovak19 0.2% Portuguese19 0.2% Greek19 0.2% Canadian17 0.2% Iraqi11 0.1% Dutch10 0.10% Danish8 0.08% Irish
Geographical mobility in Ojus Same house 1 year ago 4,902 88.2% White (Caucasian)2,067 89.2% Black or African American278 95.0% Asian1,179 94.9% Other race4,108 88.7% Two or more races4,296 88.0% White alone, not Hispanic / Latino7,494 88.2% Hispanic or LatinoMoved within same county 391 7.0% White / Caucasian145 6.3% Black or African American8 2.8% Asian20 1.6% Other race240 5.2% Two or more races402 8.2% White alone, not Hispanic / Latino609 7.2% Hispanic or LatinoMoved within same state 109 2.0% White / Caucasian44 1.9% Black or African American23 1.9% Other race116 2.5% Two or more races79 1.6% White alone, not Hispanic / Latino130 1.5% Hispanic or LatinoMoved from different state 65 1.2% White / Caucasian15 0.7% Black or African American57 1.2% White alone, not Hispanic / Latino15 0.2% Hispanic or LatinoMoved from abroad 22 0.4% White16 5.5% Asian192 4.1% Two or more races209 2.5% Hispanic or Latino
Children Nativity (place of birth) in Ojus
Children under 6 years - Living with two parents Both parents native 121 100.0% NativeBoth parents foreign-born 350 77.3% Native103 22.7% Foreign-bornOne native, one foreign-born parent 103 100.0% NativeChildren under 6 years - Living with one parent Native parent 70 99.4% Native0 0.6% Foreign-bornForeign-born parent 141 93.9% Native9 6.1% Foreign-bornChildren 6 to 17 years - Living with two parents Both parents native 356 98.9% Native4 1.1% Foreign-bornBoth parents foreign-born 381 69.0% Native171 31.0% Foreign-bornOne native, one foreign-born parent 240 100.0% NativeChildren 6 to 17 years - Living with one parent Native parent 221 100.0% NativeForeign-born parent 358 57.9% Native260 42.1% Foreign-born
Grandparents responsible for own grandchildren in Ojus
Grandparents (30 to 59 years) White / Caucasian 4 21.6% Responsible for grandchildren15 78.4% Not responsible for grandchildrenBlack or African American 4 100.0% Not responsible for grandchildrenTwo or more races 45 100.0% Responsible for grandchildrenWhite alone, not Hispanic / Latino 8 100.0% Not responsible for grandchildrenHispanic or Latino 31 58.0% Responsible for grandchildren22 42.0% Not responsible for grandchildrenGrandparents (60 years and over) White / Caucasian 33 42.3% Responsible for grandchildren44 57.7% Not responsible for grandchildrenTwo or more races 33 100.0% Not responsible for grandchildrenWhite alone, not Hispanic / Latino 17 31.5% Responsible for grandchildren37 68.5% Not responsible for grandchildrenHispanic or Latino 38 50.5% Responsible for grandchildren37 49.5% Not responsible for grandchildren