Races in Scranton, Pennsylvania (PA) Detailed Stats
Data:
Races - White alone (%)
Races - White alone (% change since 2000)
Races - Black alone (%)
Races - Black alone (% change since 2000)
Races - American Indian alone (%)
Races - American Indian alone (% change since 2000)
Races - Asian alone (%)
Races - Asian alone (% change since 2000)
Races - Hispanic (%)
Races - Hispanic (% change since 2000)
Races - Native Hawaiian and Other Pacific Islander alone (%)
Races - Native Hawaiian and Other Pacific Islander alone (% change since 2000)
Races - Two or more races(%)
Races - Two or more races(% change since 2000)
Races - Other race alone (%)
Races - Other race alone (% change since 2000)
Racial diversity
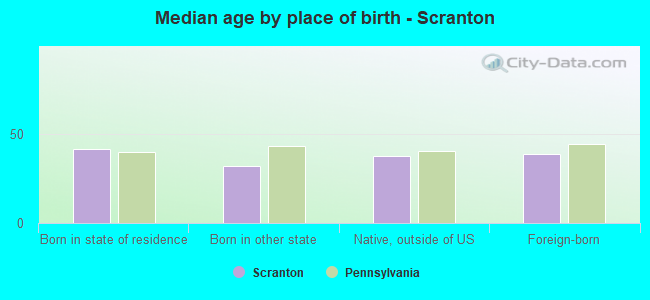
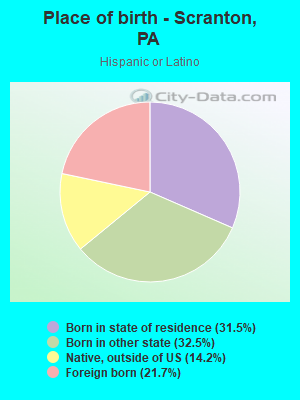
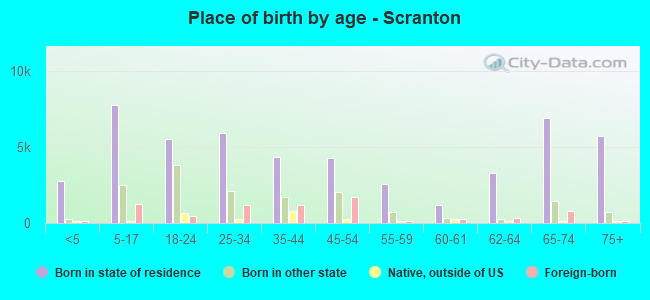
Place of birth - Born in state of residence (%)
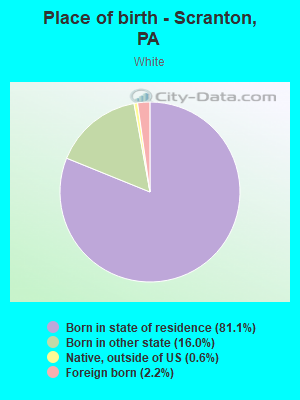
Place of birth - Born in state of residence (%) - White
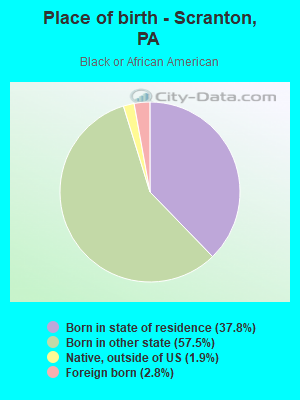
Place of birth - Born in state of residence (%) - Black or African American
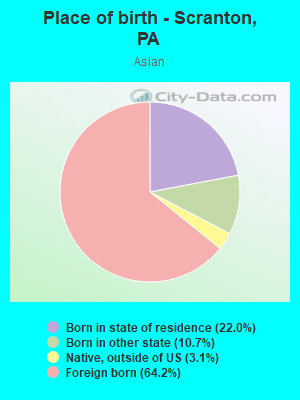
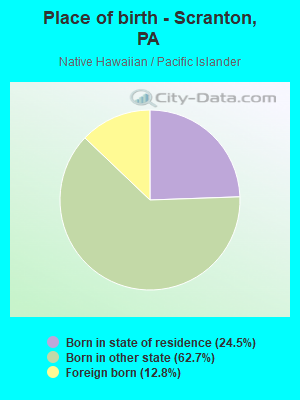
Place of birth - Born in state of residence (%) - Asian
Place of birth - Born in state of residence (%) - Hispanic or Latino
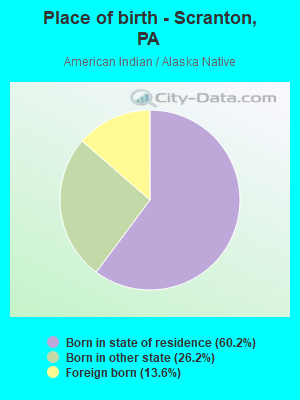
Place of birth - Born in state of residence (%) - American Indian and Alaska Native
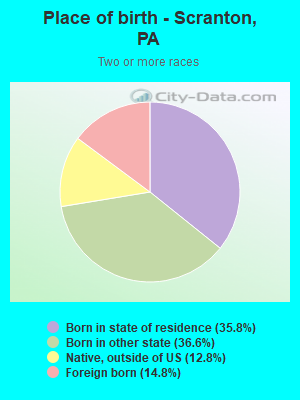
Place of birth - Born in state of residence (%) - Multirace
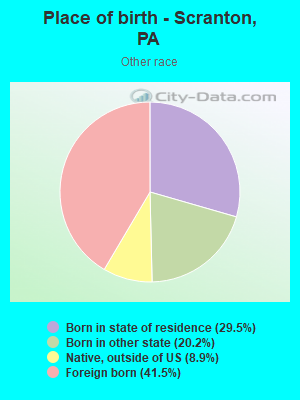
Place of birth - Born in state of residence (%) - Other Race
Place of birth - Born in other state (%)
Place of birth - Born in other state (%) - White
Place of birth - Born in other state (%) - Black or African American
Place of birth - Born in other state (%) - Asian
Place of birth - Born in other state (%) - Hispanic or Latino
Place of birth - Born in other state (%) - American Indian and Alaska Native
Place of birth - Born in other state (%) - Multirace
Place of birth - Born in other state (%) - Other Race
Place of birth - Native, outside of US (%)
Place of birth - Native, outside of US (%) - White
Place of birth - Native, outside of US (%) - Black or African American
Place of birth - Native, outside of US (%) - Asian
Place of birth - Native, outside of US (%) - Hispanic or Latino
Place of birth - Native, outside of US (%) - American Indian and Alaska Native
Place of birth - Native, outside of US (%) - Multirace
Place of birth - Native, outside of US (%) - Other Race
Place of birth - Foreign born (%)
Place of birth - Foreign born (%) - White
Place of birth - Foreign born (%) - Black or African American
Place of birth - Foreign born (%) - Asian
Place of birth - Foreign born (%) - Hispanic or Latino
Place of birth - Foreign born (%) - American Indian and Alaska Native
Place of birth - Foreign born (%) - Multirace
Place of birth - Foreign born (%) - Other Race
Residents speaking English at home (%)
Residents speaking English at home - Born in the United States (%)
Residents speaking English at home - Native, born elsewhere (%)
Residents speaking English at home - Foreign born (%)
Residents speaking Spanish at home (%)
Residents speaking Spanish at home - Born in the United States (%)
Residents speaking Spanish at home - Native, born elsewhere (%)
Residents speaking Spanish at home - Foreign born (%)
Residents speaking other language at home (%)
Residents speaking other language at home - Born in the United States (%)
Residents speaking other language at home - Native, born elsewhere (%)
Residents speaking other language at home - Foreign born (%)
Marital status - Never married (%)
Marital status - Now married (%)
Marital status - Separated (%)
Marital status - Widowed (%)
Marital status - Divorced (%)
Ancestries Reported - Arab (%)
Ancestries Reported - Czech (%)
Ancestries Reported - Danish (%)
Ancestries Reported - Dutch (%)
Ancestries Reported - English (%)
Ancestries Reported - French (%)
Ancestries Reported - French Canadian (%)
Ancestries Reported - German (%)
Ancestries Reported - Greek (%)
Ancestries Reported - Hungarian (%)
Ancestries Reported - Irish (%)
Ancestries Reported - Italian (%)
Ancestries Reported - Lithuanian (%)
Ancestries Reported - Norwegian (%)
Ancestries Reported - Polish (%)
Ancestries Reported - Portuguese (%)
Ancestries Reported - Russian (%)
Ancestries Reported - Scotch-Irish (%)
Ancestries Reported - Scottish (%)
Ancestries Reported - Slovak (%)
Ancestries Reported - Subsaharan African (%)
Ancestries Reported - Swedish (%)
Ancestries Reported - Swiss (%)
Ancestries Reported - Ukrainian (%)
Ancestries Reported - United States (%)
Ancestries Reported - Welsh (%)
Ancestries Reported - West Indian (%)
Ancestries Reported - Other (%)
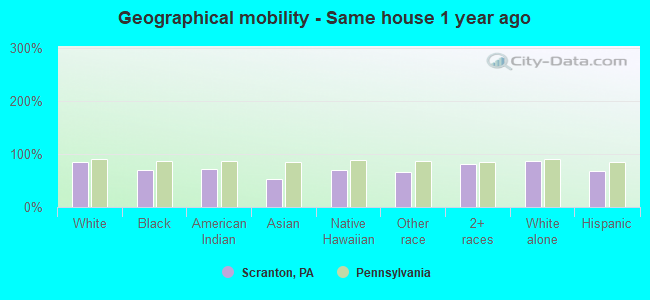
Geographical mobility - Same house 1 year ago (%)
Geographical mobility - Same house 1 year ago (%) - White
Geographical mobility - Same house 1 year ago (%) - Black or African American
Geographical mobility - Same house 1 year ago (%) - Asian
Geographical mobility - Same house 1 year ago (%) - Hispanic or Latino
Geographical mobility - Same house 1 year ago (%) - American Indian and Alaska Native
Geographical mobility - Same house 1 year ago (%) - Multirace
Geographical mobility - Same house 1 year ago (%) - Other Race
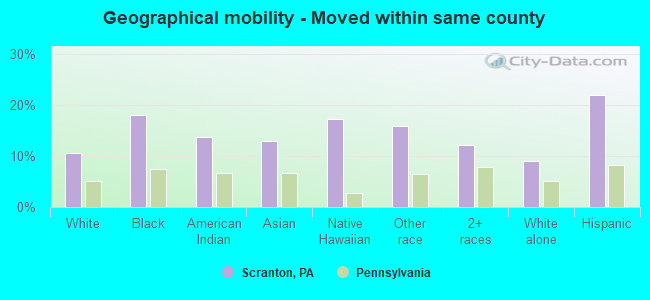
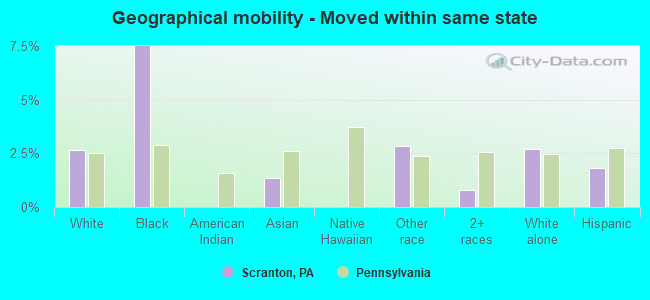
Geographical mobility - Moved within same county (%)
Geographical mobility - Moved within same county (%) - White
Geographical mobility - Moved within same county (%) - Black or African American
Geographical mobility - Moved within same county (%) - Asian
Geographical mobility - Moved within same county (%) - Hispanic or Latino
Geographical mobility - Moved within same county (%) - American Indian and Alaska Native
Geographical mobility - Moved within same county (%) - Multirace
Geographical mobility - Moved within same county (%) - Other Race
Geographical mobility - Moved from different county within same state (%)
Geographical mobility - Moved from different county within same state (%) - White
Geographical mobility - Moved from different county within same state (%) - Black or African American
Geographical mobility - Moved from different county within same state (%) - Asian
Geographical mobility - Moved from different county within same state (%) - Hispanic or Latino
Geographical mobility - Moved from different county within same state (%) - American Indian and Alaska Native
Geographical mobility - Moved from different county within same state (%) - Multirace
Geographical mobility - Moved from different county within same state (%) - Other Race
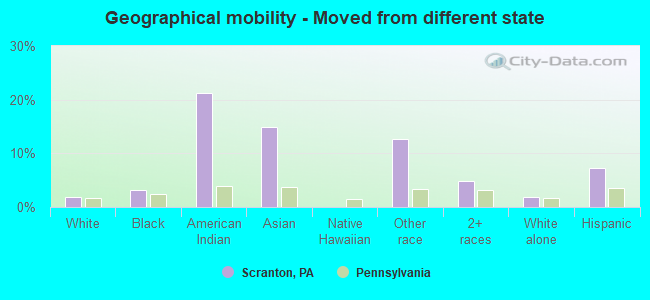
Geographical mobility - Moved from different state (%)
Geographical mobility - Moved from different state (%) - White
Geographical mobility - Moved from different state (%) - Black or African American
Geographical mobility - Moved from different state (%) - Asian
Geographical mobility - Moved from different state (%) - Hispanic or Latino
Geographical mobility - Moved from different state (%) - American Indian and Alaska Native
Geographical mobility - Moved from different state (%) - Multirace
Geographical mobility - Moved from different state (%) - Other Race
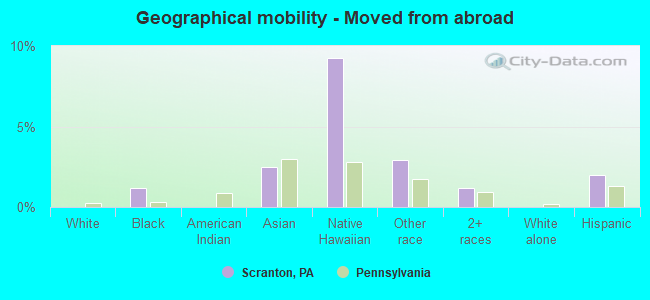
Geographical mobility - Moved from abroad (%)
Geographical mobility - Moved from abroad (%) - White
Geographical mobility - Moved from abroad (%) - Black or African American
Geographical mobility - Moved from abroad (%) - Asian
Geographical mobility - Moved from abroad (%) - Hispanic or Latino
Geographical mobility - Moved from abroad (%) - American Indian and Alaska Native
Geographical mobility - Moved from abroad (%) - Multirace
Geographical mobility - Moved from abroad (%) - Other Race
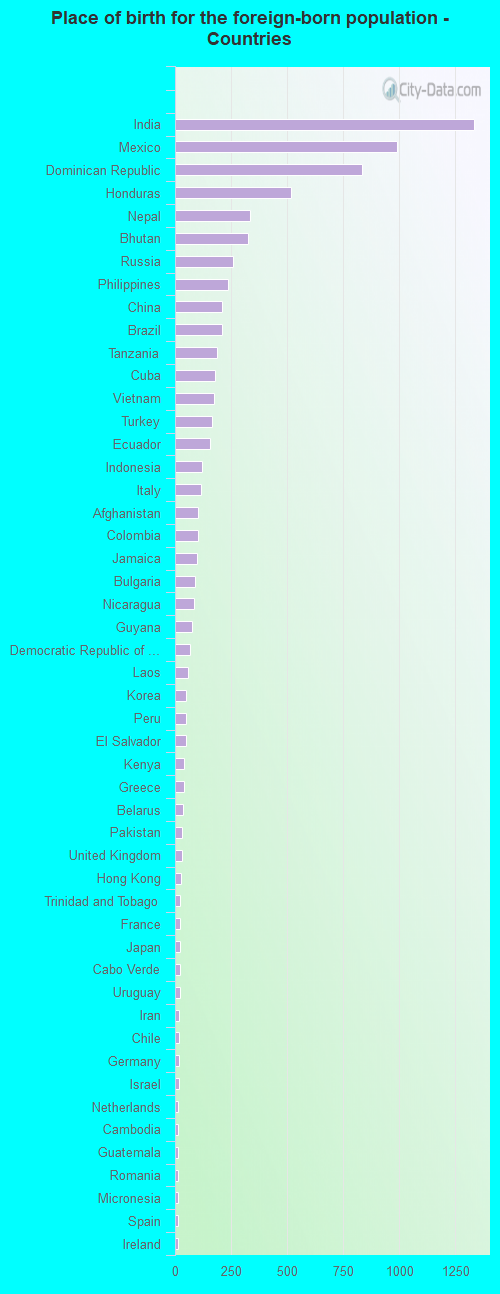
Place of birth for the foreign-born population - Ireland (%)
Place of birth for the foreign-born population - Denmark (%)
Place of birth for the foreign-born population - Norway (%)
Place of birth for the foreign-born population - Sweden (%)
Place of birth for the foreign-born population - United Kingdom (%)
Place of birth for the foreign-born population - England (%)
Place of birth for the foreign-born population - Scotland (%)
Place of birth for the foreign-born population - Other Northern Europe (%)
Place of birth for the foreign-born population - Austria (%)
Place of birth for the foreign-born population - Belgium (%)
Place of birth for the foreign-born population - France (%)
Place of birth for the foreign-born population - Germany (%)
Place of birth for the foreign-born population - Netherlands (%)
Place of birth for the foreign-born population - Switzerland (%)
Place of birth for the foreign-born population - Other Western Europe (%)
Place of birth for the foreign-born population - Greece (%)
Place of birth for the foreign-born population - Italy (%)
Place of birth for the foreign-born population - Portugal (%)
Place of birth for the foreign-born population - Spain (%)
Place of birth for the foreign-born population - Other Southern Europe (%)
Place of birth for the foreign-born population - Albania (%)
Place of birth for the foreign-born population - Belarus (%)
Place of birth for the foreign-born population - Bosnia and Herzegovina (%)
Place of birth for the foreign-born population - Bulgaria (%)
Place of birth for the foreign-born population - Croatia (%)
Place of birth for the foreign-born population - Czechoslovakia (%)
Place of birth for the foreign-born population - Hungary (%)
Place of birth for the foreign-born population - Latvia (%)
Place of birth for the foreign-born population - Lithuania (%)
Place of birth for the foreign-born population - North Macedonia (Macedonia) (%)
Place of birth for the foreign-born population - Moldova (%)
Place of birth for the foreign-born population - Poland (%)
Place of birth for the foreign-born population - Romania (%)
Place of birth for the foreign-born population - Russia (%)
Place of birth for the foreign-born population - Serbia (%)
Place of birth for the foreign-born population - Ukraine (%)
Place of birth for the foreign-born population - Other Eastern Europe (%)
Place of birth for the foreign-born population - China (%)
Place of birth for the foreign-born population - Hong Kong (%)
Place of birth for the foreign-born population - Taiwan (%)
Place of birth for the foreign-born population - Japan (%)
Place of birth for the foreign-born population - Korea (%)
Place of birth for the foreign-born population - Other Eastern Asia (%)
Place of birth for the foreign-born population - Afghanistan (%)
Place of birth for the foreign-born population - Bangladesh (%)
Place of birth for the foreign-born population - India (%)
Place of birth for the foreign-born population - Iran (%)
Place of birth for the foreign-born population - Kazakhstan (%)
Place of birth for the foreign-born population - Nepal (%)
Place of birth for the foreign-born population - Pakistan (%)
Place of birth for the foreign-born population - Sri Lanka (%)
Place of birth for the foreign-born population - Uzbekistan (%)
Place of birth for the foreign-born population - Other South Central Asia (%)
Place of birth for the foreign-born population - Burma (%)
Place of birth for the foreign-born population - Cambodia (%)
Place of birth for the foreign-born population - Indonesia (%)
Place of birth for the foreign-born population - Laos (%)
Place of birth for the foreign-born population - Malaysia (%)
Place of birth for the foreign-born population - Philippines (%)
Place of birth for the foreign-born population - Singapore (%)
Place of birth for the foreign-born population - Thailand (%)
Place of birth for the foreign-born population - Vietnam (%)
Place of birth for the foreign-born population - Other South Eastern Asia (%)
Place of birth for the foreign-born population - Armenia (%)
Place of birth for the foreign-born population - Iraq (%)
Place of birth for the foreign-born population - Israel (%)
Place of birth for the foreign-born population - Jordan (%)
Place of birth for the foreign-born population - Kuwait (%)
Place of birth for the foreign-born population - Lebanon (%)
Place of birth for the foreign-born population - Saudi Arabia (%)
Place of birth for the foreign-born population - Syria (%)
Place of birth for the foreign-born population - Turkey (%)
Place of birth for the foreign-born population - Yemen (%)
Place of birth for the foreign-born population - Other Western Asia (%)
Place of birth for the foreign-born population - Eritrea (%)
Place of birth for the foreign-born population - Ethiopia (%)
Place of birth for the foreign-born population - Kenya (%)
Place of birth for the foreign-born population - Somalia (%)
Place of birth for the foreign-born population - Uganda (%)
Place of birth for the foreign-born population - Zimbabwe (%)
Place of birth for the foreign-born population - Other Eastern Africa (%)
Place of birth for the foreign-born population - Cameroon (%)
Place of birth for the foreign-born population - Congo (%)
Place of birth for the foreign-born population - Democratic Republic of Congo (Zaire) (%)
Place of birth for the foreign-born population - Other Middle Africa (%)
Place of birth for the foreign-born population - Egypt (%)
Place of birth for the foreign-born population - Morocco (%)
Place of birth for the foreign-born population - Sudan (%)
Place of birth for the foreign-born population - Other Northern Africa (%)
Place of birth for the foreign-born population - South Africa (%)
Place of birth for the foreign-born population - Other Southern Africa (%)
Place of birth for the foreign-born population - Cabo Verde (%)
Place of birth for the foreign-born population - Ghana (%)
Place of birth for the foreign-born population - Liberia (%)
Place of birth for the foreign-born population - Nigeria (%)
Place of birth for the foreign-born population - Senegal (%)
Place of birth for the foreign-born population - Sierra Leone (%)
Place of birth for the foreign-born population - Other Western Africa (%)
Place of birth for the foreign-born population - Australia (%)
Place of birth for the foreign-born population - New Zealand (%)
Place of birth for the foreign-born population - Fiji (%)
Place of birth for the foreign-born population - Micronesia (%)
Place of birth for the foreign-born population - Bahamas (%)
Place of birth for the foreign-born population - Barbados (%)
Place of birth for the foreign-born population - Cuba (%)
Place of birth for the foreign-born population - Dominica (%)
Place of birth for the foreign-born population - Dominican Republic (%)
Place of birth for the foreign-born population - Grenada (%)
Place of birth for the foreign-born population - Haiti (%)
Place of birth for the foreign-born population - Jamaica (%)
Place of birth for the foreign-born population - St. Vincent and the Grenadines (%)
Place of birth for the foreign-born population - Trinidad and Tobago (%)
Place of birth for the foreign-born population - West Indies (%)
Place of birth for the foreign-born population - Other Caribbean (%)
Place of birth for the foreign-born population - Belize (%)
Place of birth for the foreign-born population - Costa Rica (%)
Place of birth for the foreign-born population - El Salvador (%)
Place of birth for the foreign-born population - Guatemala (%)
Place of birth for the foreign-born population - Honduras (%)
Place of birth for the foreign-born population - Mexico (%)
Place of birth for the foreign-born population - Nicaragua (%)
Place of birth for the foreign-born population - Panama (%)
Place of birth for the foreign-born population - Other Central America (%)
Place of birth for the foreign-born population - Argentina (%)
Place of birth for the foreign-born population - Bolivia (%)
Place of birth for the foreign-born population - Brazil (%)
Place of birth for the foreign-born population - Chile (%)
Place of birth for the foreign-born population - Colombia (%)
Place of birth for the foreign-born population - Ecuador (%)
Place of birth for the foreign-born population - Guyana (%)
Place of birth for the foreign-born population - Peru (%)
Place of birth for the foreign-born population - Uruguay (%)
Place of birth for the foreign-born population - Venezuela (%)
Place of birth for the foreign-born population - Other South America (%)
Place of birth for the foreign-born population - Canada (%)
Place of birth for the foreign-born population - Other Northern America (%)
Place of birth for the foreign-born population - Other (%)
Latest news about races in Scranton, PA collected exclusively by city-data.com from local newspapers, TV, and radio stations
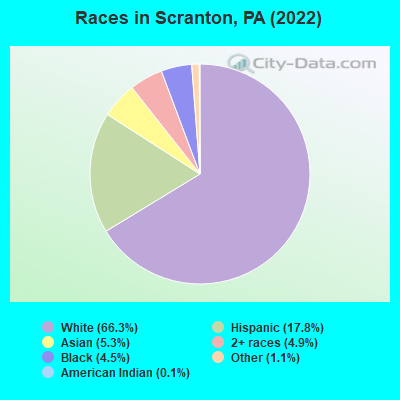
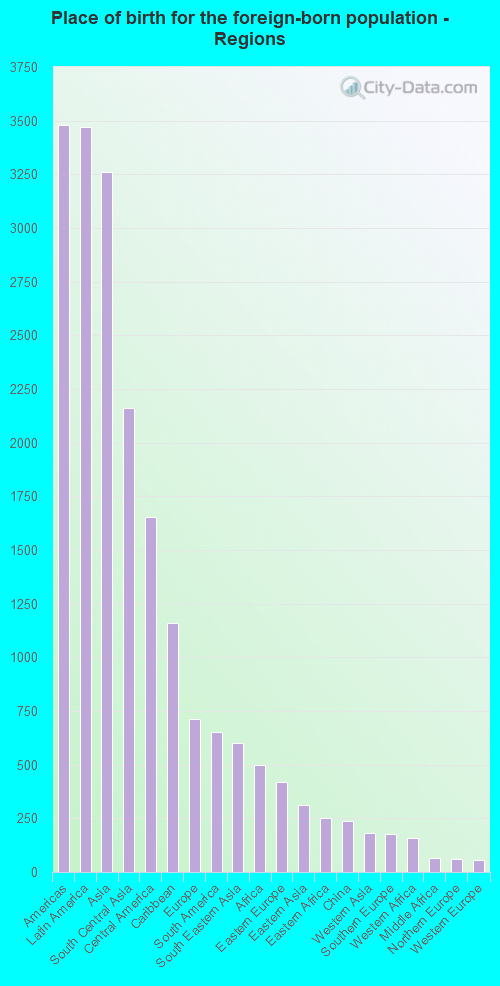
According to 2022 data, the most numerous races in Scranton, PA are White alone (50,265 residents), Black alone (3,396 residents), and Hispanic (13,505 residents). 82.0% of Scranton residents speak English at home. 10.5% of Scranton, PA residents are foreign-born (4.4% born in Latin America, 4.1% born in Asia), which is 33.1% greater than the foreign-born rate of 7.0% across the entire state of Pennsylvania.
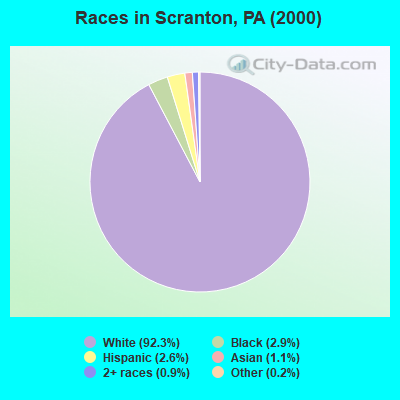
Race distribution in Scranton
2000 2022
10,322,455 84.1% White alone 1,202,437 9.8% Black alone 394,088 3.2% Hispanic 218,296 1.8% Asian alone 113,097 0.9% Two or more races 13,086 0.1% Other race alone 14,904 0.1% American Indian alone 2,691 0.02% Native Hawaiian and Other
9,487,228 73.1% White alone 1,311,581 10.1% Black alone 1,115,997 8.6% Hispanic 493,942 3.8% Two or more races 487,124 3.8% Asian alone 63,582 0.5% Other race alone 10,130 0.08% American Indian alone 2,424 0.02% Native Hawaiian and Other
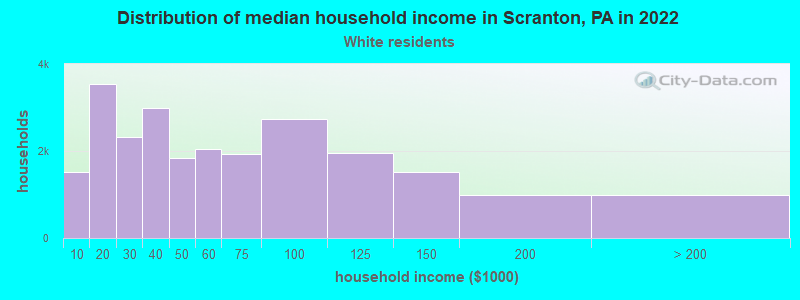
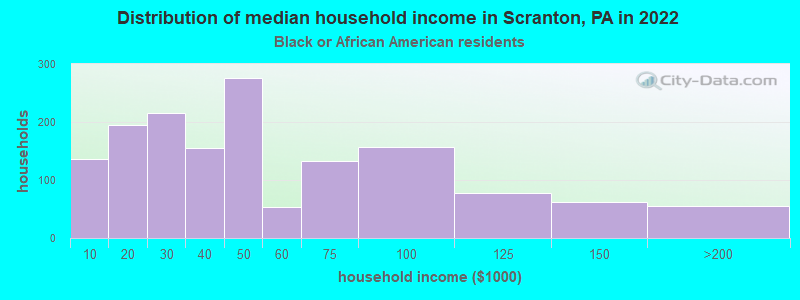
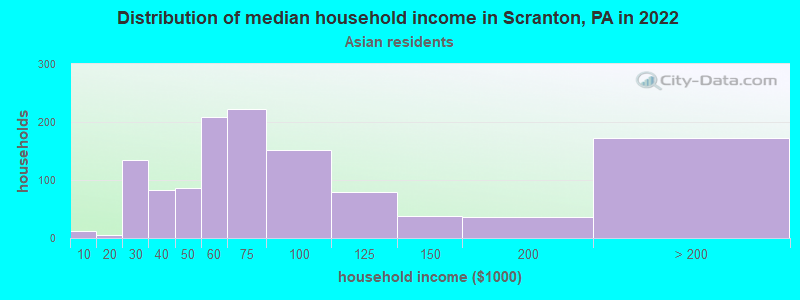
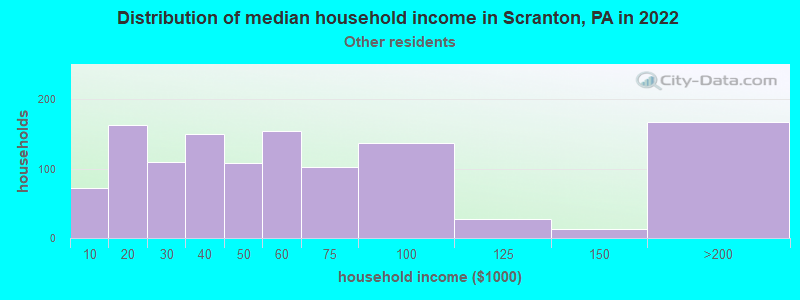
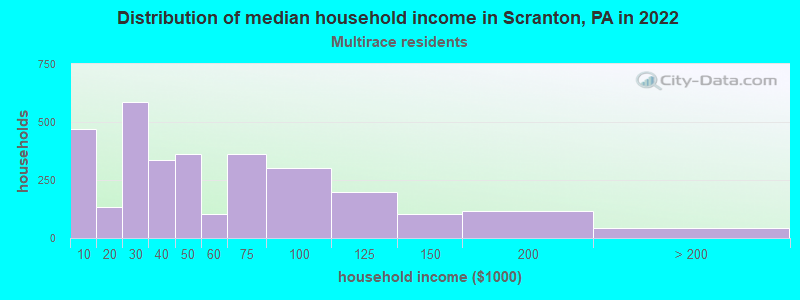
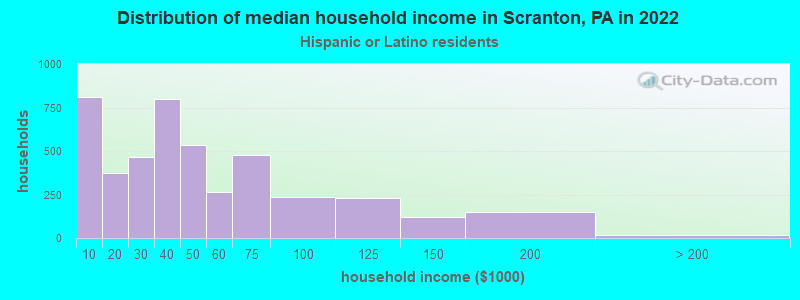
Income and house value in Scranton Median household income in 2022 $51,130 White non-Hispanic householders$21,387 Black householders$57,160 Asian householders$58,763 Some other race householders$31,755 Two or more races householders$40,120 Hispanic or Latino race householdersMedian 2022 house value $152,809 White Non-Hispanic householders$141,084 Black or African American householders$47,093 American Indian or Alaska Native householders $135,027 Asian householders$146,556 Some other race householders$167,269 Two or more races householders$153,981 Hispanic or Latino householders
Median age by race in Scranton
48.1 Median age for White residents43.3 51.3 24.8 Median age for Black or African American residents21.0 27.9 31.7 Median age for American Indian / Alaska Native residents-666,666,666.0 -666,666,666.0 30.4 Median age for Asian residents30.7 30.2 -666,666,666.0 Median age for Native Hawaiian / Pacific Islander residents-666,666,666.0 -666,666,666.0 38.2 Median age for Other race residents36.0 47.4 20.1 Median age for Two or more races residents25.9 19.2 50.5 Median age for White alone residents45.7 53.4 23.8 Median age for Hispanic or Latino residents27.9 20.3
Owner/renter occupied households by race in Scranton
House owners and renters - White residents 13,727 56.2% Owner occupied10,677 43.8% Renter occupiedHouse owners and renters - Black or African American residents 85 6.4% Owner occupied1,239 93.6% Renter occupiedHouse owners and renters - American Indian / Alaska Native residents 2 16.2% Owner occupied8 83.8% Renter occupiedHouse owners and renters - Asian residents 531 46.4% Owner occupied613 53.6% Renter occupiedHouse owners and renters - Native Hawaiian / Pacific Islander residents 37 100.0% Renter occupiedHouse owners and renters - Other race residents 810 43.8% Owner occupied1,040 56.2% Renter occupiedHouse owners and renters - Two or more races residents 767 23.4% Owner occupied2,509 76.6% Renter occupiedHouse owners and renters - White alone residents 13,640 56.6% Owner occupied10,468 43.4% Renter occupiedHouse owners and renters - Hispanic or Latino residents 1,058 25.2% Owner occupied3,143 74.8% Renter occupied
Language usage in Scranton
English speakers - Total 82.0% of residents of Scranton speak English at home.
10.7% of residents speak Spanish at home 5,353 68.6% Speak English very well2,449 31.4% Speak English less than very well7.3% of residents speak other language at home 2,401 45.3% Speak English very well2,904 54.7% Speak English less than very well
English speakers - Born in the United States 82.4% of residents of Scranton speak English at home.
13.8% of residents speak Spanish at home 1,987 92.4% Speak English very well164 7.6% Speak English less than very well3.9% of residents speak other language at home 371 61.3% Speak English very well234 38.7% Speak English less than very well
English speakers - Native, born elsewhere 16.9% of residents of Scranton speak English at home.
83.0% of residents speak Spanish at home 924 48.1% Speak English very well996 51.9% Speak English less than very well0.1% of residents speak other language at home 3 100.0% Speak English very well
English speakers - Foreign-born 6.2% of residents of Scranton speak English at home.
37.8% of residents speak Spanish at home 1,563 55.3% Speak English very well1,262 44.7% Speak English less than very well56.1% of residents speak other language at home 1,522 36.3% Speak English very well2,670 63.7% Speak English less than very well
White (Caucasian) - Speak only English Native:
97.5% (48,760)Foreign-born:
4.2% (49)
White (Caucasian) - Speak another language Native:
2.5% (1,233)Foreign-born:
95.8% (1,112)
Black or African American - Speak only English Native:
94.7% (3,702)Foreign-born:
38.3% (100)
Black or African American - Speak another language Native:
5.2% (203)Foreign-born:
59.8% (156)
American Indian / Alaska Native - Speak another language Native:
6.6% (4)Foreign-born:
100.0% (11)
Asian - Speak only English Native:
51.9% (461)Foreign-born:
9.6% (246)
Asian - Speak another language Native:
48.1% (427)Foreign-born:
90.4% (2,325)
Native Hawaiian / Pacific Islander - Speak another language Native:
28.4% (14)Foreign-born:
100.0% (10)
Other race - Speak only English Native:
51.3% (1,448)Foreign-born:
4.0% (81)
Other race - Speak another language Native:
48.7% (1,376)Foreign-born:
96.0% (1,965)
Two or more races - Speak only English Native:
66.0% (5,469)Foreign-born:
3.1% (48)
Two or more races - Speak another language Native:
34.0% (2,819)Foreign-born:
96.9% (1,515)
White alone - Speak only English Native:
98.6% (47,109)Foreign-born:
4.2% (49)
White alone - Speak another language Native:
1.4% (685)Foreign-born:
95.8% (1,112)
Hispanic or Latino - Speak only English Native:
50.2% (4,905)Foreign-born:
3.6% (106)
Hispanic or Latino - Speak another language Native:
49.8% (4,862)Foreign-born:
96.4% (2,825)
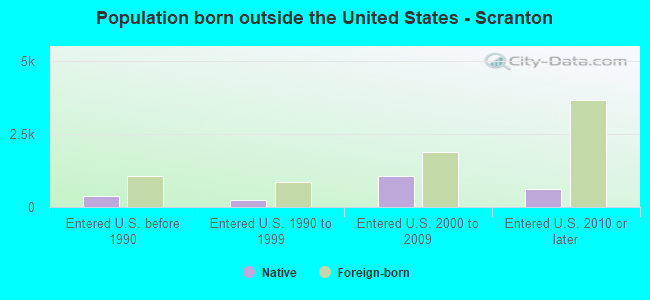
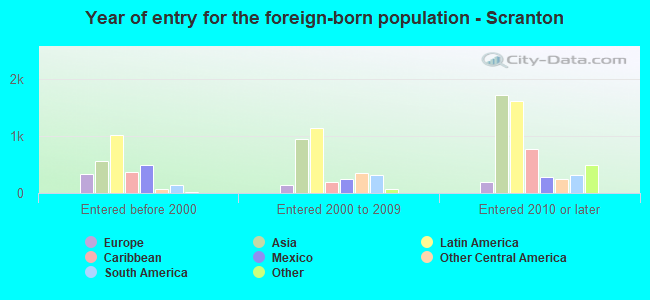
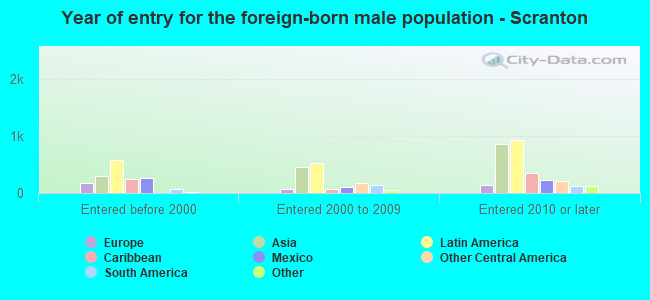
Foreign-born residents in Scranton 7,967 residents are foreign born (4.4% Latin America , 4.1% Asia ).
This city:
10.5%Pennsylvania:
7.3%
Marital status for residents in Scranton Marital status - White (Caucasian) population 15 years and over
Males 46.9% Never married35.2% Now married1.3% Separated5.4% Widowed11.2% DivorcedFemales 42.3% Never married26.0% Now married2.1% Separated14.8% Widowed14.8% DivorcedWomen who gave birth in the past 12 months Now married:
37.8% (74)Unmarried:
62.2% (122)
Women who did not give birth in the past 12 months Now married:
19.5% (2,287)Unmarried:
80.5% (9,447)
Marital status - Black or African American population 15 years and over
Males 63.1% Never married24.4% Now married1.6% Separated2.5% Widowed8.5% DivorcedFemales 51.2% Never married31.6% Now married8.1% Separated3.2% Widowed5.9% DivorcedWomen who gave birth in the past 12 months Now married:
17.6% (6)Unmarried:
82.4% (27)
Women who did not give birth in the past 12 months Now married:
36.2% (369)Unmarried:
63.8% (652)
Marital status - American Indian / Alaska Native population 15 years and over
Males 60.0% Never married25.0% Now married0.0% Separated0.0% Widowed15.0% DivorcedFemales 31.8% Never married54.5% Now married9.1% Separated0.0% Widowed4.5% DivorcedWomen who did not give birth in the past 12 months Now married:
58.8% (18)Unmarried:
41.2% (13)
Marital status - Asian population 15 years and over
Males 38.8% Never married58.1% Now married1.3% Separated1.1% Widowed0.7% DivorcedFemales 23.3% Never married64.0% Now married1.5% Separated6.9% Widowed4.3% DivorcedWomen who gave birth in the past 12 months Now married:
85.3% (60)Unmarried:
14.7% (10)
Women who did not give birth in the past 12 months Now married:
60.1% (493)Unmarried:
39.9% (327)
Marital status - Native Hawaiian / Pacific Islander population 15 years and over
Males 100.0% Never married0.0% Now married0.0% Separated0.0% Widowed0.0% DivorcedFemales 100.0% Never married0.0% Now married0.0% Separated0.0% Widowed0.0% DivorcedWomen who did not give birth in the past 12 months Now married:
0.0% (0)Unmarried:
100.0% (14)
Marital status - Other race population 15 years and over
Males 43.5% Never married44.7% Now married0.0% Separated5.0% Widowed6.8% DivorcedFemales 37.8% Never married35.9% Now married3.5% Separated12.7% Widowed10.1% DivorcedWomen who gave birth in the past 12 months Now married:
100.0% (56)Unmarried:
0.0% (0)
Women who did not give birth in the past 12 months Now married:
41.8% (362)Unmarried:
58.2% (503)
Marital status - Two or more races population 15 years and over
Males 66.5% Never married28.3% Now married0.2% Separated0.4% Widowed4.6% DivorcedFemales 61.4% Never married29.4% Now married1.3% Separated0.1% Widowed7.7% DivorcedWomen who gave birth in the past 12 months Now married:
9.3% (14)Unmarried:
90.7% (136)
Women who did not give birth in the past 12 months Now married:
28.6% (933)Unmarried:
71.4% (2,330)
Marital status - White alone, not Hispanic / Latino population 15 years and over
Males 46.7% Never married35.1% Now married1.3% Separated5.5% Widowed11.4% DivorcedFemales 41.2% Never married26.4% Now married1.9% Separated15.3% Widowed15.2% DivorcedWomen who gave birth in the past 12 months Now married:
37.8% (74)Unmarried:
62.2% (122)
Women who did not give birth in the past 12 months Now married:
19.4% (2,102)Unmarried:
80.6% (8,758)
Marital status - Hispanic or Latino population 15 years and over
Males 56.1% Never married40.1% Now married0.0% Separated0.9% Widowed2.9% DivorcedFemales 53.0% Never married34.7% Now married2.8% Separated2.6% Widowed6.9% DivorcedWomen who gave birth in the past 12 months Now married:
73.6% (101)Unmarried:
26.4% (36)
Women who did not give birth in the past 12 months Now married:
30.8% (1,194)Unmarried:
69.2% (2,687)
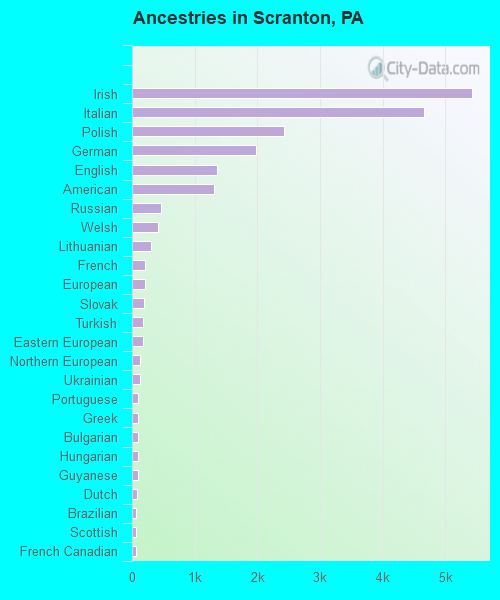
Ancestries in Scranton
5,428 15.5% Irish4,661 13.3% Italian2,422 6.9% Polish1,986 5.7% German1,363 3.9% English1,313 3.8% American464 1.3% Russian421 1.2% Welsh305 0.9% Lithuanian209 0.6% French204 0.6% European186 0.5% Slovak174 0.5% Turkish169 0.5% Eastern European128 0.4% Northern European126 0.4% Ukrainian103 0.3% Portuguese102 0.3% Greek98 0.3% Bulgarian90 0.3% Hungarian89 0.3% Guyanese77 0.2% Dutch71 0.2% Brazilian67 0.2% Scottish63 0.2% French Canadian61 0.2% Kenyan60 0.2% Pennsylvania German53 0.2% Jamaican46 0.1% Haitian40 0.1% Scotch-Irish39 0.1% Austrian37 0.1% Albanian36 0.1% Czech33 0.09% African31 0.09% Carpatho Rusyn30 0.09% Czechoslovakian27 0.08% Lebanese27 0.08% Iranian19 0.05% Afghan17 0.05% Cape Verdean16 0.05% Israeli15 0.04% British13 0.04% Sierra Leonean13 0.04% Swedish12 0.03% Romanian12 0.03% Arab11 0.03% Egyptian11 0.03% Norwegian11 0.03% Slavic10 0.03% Yugoslavian7 0.02% Slovene4 0.01% Nigerian4 0.01% British West Indian3 0.01% Croatian3 0.01% Armenian
Geographical mobility in Scranton Same house 1 year ago 44,474 84.9% White (Caucasian)2,604 70.2% Black or African American55 71.4% American Indian / Alaska Native1,885 52.8% Asian73 69.4% Native Hawaiian / Pacific Islander3,241 65.7% Other race8,539 81.0% Two or more races43,295 86.5% White alone, not Hispanic / Latino9,057 67.1% Hispanic or LatinoMoved within same county 5,487 10.5% White / Caucasian669 18.0% Black or African American11 13.7% American Indian / Alaska Native463 13.0% Asian18 17.2% Native Hawaiian / Pacific Islander786 15.9% Other race1,273 12.1% Two or more races4,478 8.9% White alone, not Hispanic / Latino2,949 21.8% Hispanic or LatinoMoved within same state 1,383 2.6% White / Caucasian280 7.5% Black or African American48 1.3% Asian140 2.8% Other race81 0.8% Two or more races1,356 2.7% White alone, not Hispanic / Latino248 1.8% Hispanic or LatinoMoved from different state 1,013 1.9% White / Caucasian115 3.1% Black or African American16 21.2% American Indian / Alaska Native535 15.0% Asian621 12.6% Other race520 4.9% Two or more races931 1.9% White alone, not Hispanic / Latino982 7.3% Hispanic or LatinoMoved from abroad 44 1.2% Black or African American88 2.5% Asian10 9.3% Native Hawaiian / Pacific Islander143 2.9% Other race126 1.2% Two or more races269 2.0% Hispanic or Latino
Children Nativity (place of birth) in Scranton
Children under 6 years - Living with two parents Both parents native 748 100.0% NativeBoth parents foreign-born 358 100.0% NativeOne native, one foreign-born parent 34 100.0% NativeChildren under 6 years - Living with one parent Native parent 1,882 100.0% NativeForeign-born parent 321 100.0% NativeChildren 6 to 17 years - Living with two parents Both parents native 3,515 100.0% NativeBoth parents foreign-born 841 65.5% Native443 34.5% Foreign-bornOne native, one foreign-born parent 120 100.0% NativeChildren 6 to 17 years - Living with one parent Native parent 3,818 91.8% Native339 8.2% Foreign-bornForeign-born parent 1,317 72.9% Native489 27.1% Foreign-born
Grandparents responsible for own grandchildren in Scranton
Grandparents (30 to 59 years) White / Caucasian 101 30.5% Responsible for grandchildren230 69.5% Not responsible for grandchildrenBlack or African American 32 85.8% Responsible for grandchildren5 14.2% Not responsible for grandchildrenAmerican Indian / Alaska Native 1 100.0% Not responsible for grandchildrenAsian 42 100.0% Not responsible for grandchildrenOther race 7 13.0% Responsible for grandchildren47 87.0% Not responsible for grandchildrenTwo or more races 28 100.0% Responsible for grandchildrenWhite alone, not Hispanic / Latino 101 37.8% Responsible for grandchildren166 62.2% Not responsible for grandchildrenHispanic or Latino 8 17.2% Responsible for grandchildren36 82.8% Not responsible for grandchildrenGrandparents (60 years and over) White / Caucasian 67 13.7% Responsible for grandchildren424 86.3% Not responsible for grandchildrenBlack or African American 6 12.3% Responsible for grandchildren44 87.7% Not responsible for grandchildrenAsian 7 11.3% Responsible for grandchildren54 88.7% Not responsible for grandchildrenOther race 14 100.0% Not responsible for grandchildrenTwo or more races 62 100.0% Not responsible for grandchildrenWhite alone, not Hispanic / Latino 67 13.3% Responsible for grandchildren434 86.7% Not responsible for grandchildrenHispanic or Latino 1 1.5% Responsible for grandchildren69 98.5% Not responsible for grandchildren