Races in Terryville, New York (NY) Detailed Stats
Data:
Races - White alone (%)
Races - White alone (% change since 2000)
Races - Black alone (%)
Races - Black alone (% change since 2000)
Races - American Indian alone (%)
Races - American Indian alone (% change since 2000)
Races - Asian alone (%)
Races - Asian alone (% change since 2000)
Races - Hispanic (%)
Races - Hispanic (% change since 2000)
Races - Native Hawaiian and Other Pacific Islander alone (%)
Races - Native Hawaiian and Other Pacific Islander alone (% change since 2000)
Races - Two or more races(%)
Races - Two or more races(% change since 2000)
Races - Other race alone (%)
Races - Other race alone (% change since 2000)
Racial diversity
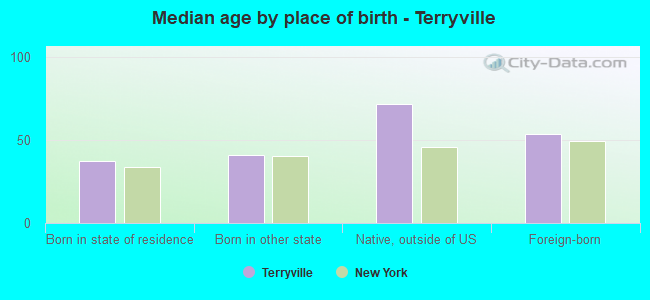
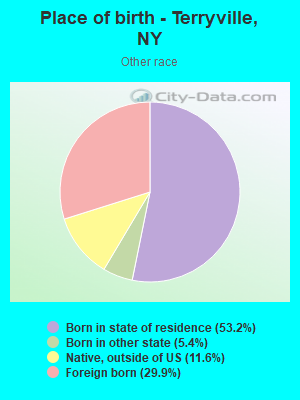
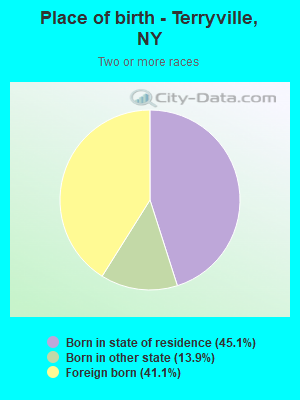
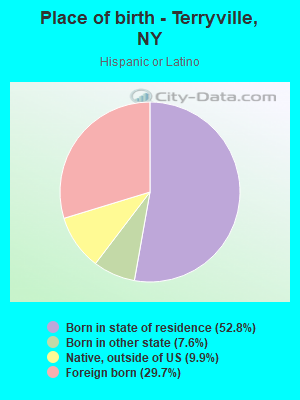
Place of birth - Born in state of residence (%)
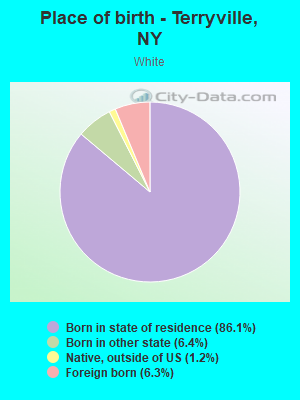
Place of birth - Born in state of residence (%) - White
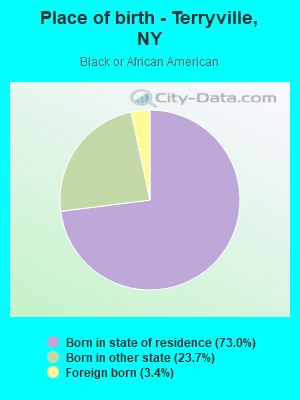
Place of birth - Born in state of residence (%) - Black or African American
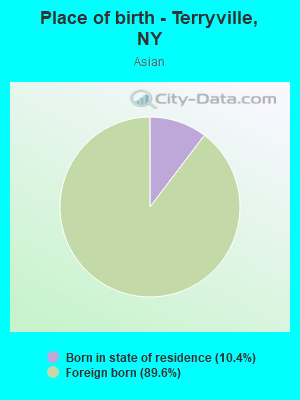
Place of birth - Born in state of residence (%) - Asian
Place of birth - Born in state of residence (%) - Hispanic or Latino
Place of birth - Born in state of residence (%) - American Indian and Alaska Native
Place of birth - Born in state of residence (%) - Multirace
Place of birth - Born in state of residence (%) - Other Race
Place of birth - Born in other state (%)
Place of birth - Born in other state (%) - White
Place of birth - Born in other state (%) - Black or African American
Place of birth - Born in other state (%) - Asian
Place of birth - Born in other state (%) - Hispanic or Latino
Place of birth - Born in other state (%) - American Indian and Alaska Native
Place of birth - Born in other state (%) - Multirace
Place of birth - Born in other state (%) - Other Race
Place of birth - Native, outside of US (%)
Place of birth - Native, outside of US (%) - White
Place of birth - Native, outside of US (%) - Black or African American
Place of birth - Native, outside of US (%) - Asian
Place of birth - Native, outside of US (%) - Hispanic or Latino
Place of birth - Native, outside of US (%) - American Indian and Alaska Native
Place of birth - Native, outside of US (%) - Multirace
Place of birth - Native, outside of US (%) - Other Race
Place of birth - Foreign born (%)
Place of birth - Foreign born (%) - White
Place of birth - Foreign born (%) - Black or African American
Place of birth - Foreign born (%) - Asian
Place of birth - Foreign born (%) - Hispanic or Latino
Place of birth - Foreign born (%) - American Indian and Alaska Native
Place of birth - Foreign born (%) - Multirace
Place of birth - Foreign born (%) - Other Race
Residents speaking English at home (%)
Residents speaking English at home - Born in the United States (%)
Residents speaking English at home - Native, born elsewhere (%)
Residents speaking English at home - Foreign born (%)
Residents speaking Spanish at home (%)
Residents speaking Spanish at home - Born in the United States (%)
Residents speaking Spanish at home - Native, born elsewhere (%)
Residents speaking Spanish at home - Foreign born (%)
Residents speaking other language at home (%)
Residents speaking other language at home - Born in the United States (%)
Residents speaking other language at home - Native, born elsewhere (%)
Residents speaking other language at home - Foreign born (%)
Marital status - Never married (%)
Marital status - Now married (%)
Marital status - Separated (%)
Marital status - Widowed (%)
Marital status - Divorced (%)
Ancestries Reported - Arab (%)
Ancestries Reported - Czech (%)
Ancestries Reported - Danish (%)
Ancestries Reported - Dutch (%)
Ancestries Reported - English (%)
Ancestries Reported - French (%)
Ancestries Reported - French Canadian (%)
Ancestries Reported - German (%)
Ancestries Reported - Greek (%)
Ancestries Reported - Hungarian (%)
Ancestries Reported - Irish (%)
Ancestries Reported - Italian (%)
Ancestries Reported - Lithuanian (%)
Ancestries Reported - Norwegian (%)
Ancestries Reported - Polish (%)
Ancestries Reported - Portuguese (%)
Ancestries Reported - Russian (%)
Ancestries Reported - Scotch-Irish (%)
Ancestries Reported - Scottish (%)
Ancestries Reported - Slovak (%)
Ancestries Reported - Subsaharan African (%)
Ancestries Reported - Swedish (%)
Ancestries Reported - Swiss (%)
Ancestries Reported - Ukrainian (%)
Ancestries Reported - United States (%)
Ancestries Reported - Welsh (%)
Ancestries Reported - West Indian (%)
Ancestries Reported - Other (%)
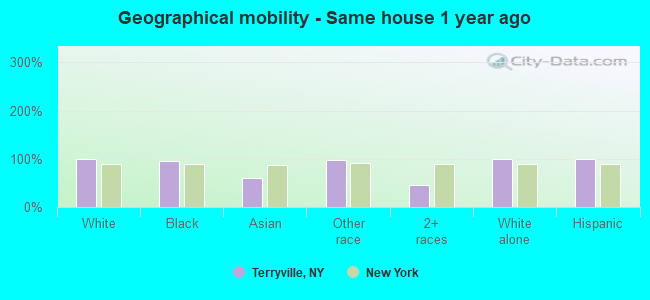
Geographical mobility - Same house 1 year ago (%)
Geographical mobility - Same house 1 year ago (%) - White
Geographical mobility - Same house 1 year ago (%) - Black or African American
Geographical mobility - Same house 1 year ago (%) - Asian
Geographical mobility - Same house 1 year ago (%) - Hispanic or Latino
Geographical mobility - Same house 1 year ago (%) - American Indian and Alaska Native
Geographical mobility - Same house 1 year ago (%) - Multirace
Geographical mobility - Same house 1 year ago (%) - Other Race
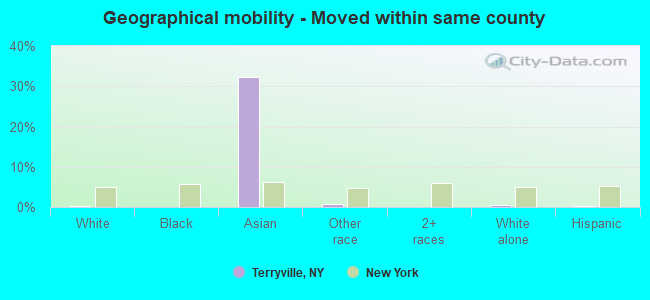
Geographical mobility - Moved within same county (%)
Geographical mobility - Moved within same county (%) - White
Geographical mobility - Moved within same county (%) - Black or African American
Geographical mobility - Moved within same county (%) - Asian
Geographical mobility - Moved within same county (%) - Hispanic or Latino
Geographical mobility - Moved within same county (%) - American Indian and Alaska Native
Geographical mobility - Moved within same county (%) - Multirace
Geographical mobility - Moved within same county (%) - Other Race
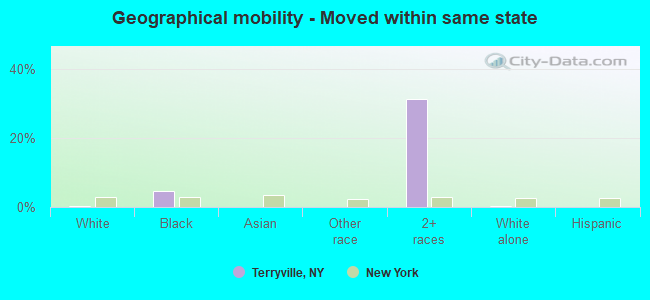
Geographical mobility - Moved from different county within same state (%)
Geographical mobility - Moved from different county within same state (%) - White
Geographical mobility - Moved from different county within same state (%) - Black or African American
Geographical mobility - Moved from different county within same state (%) - Asian
Geographical mobility - Moved from different county within same state (%) - Hispanic or Latino
Geographical mobility - Moved from different county within same state (%) - American Indian and Alaska Native
Geographical mobility - Moved from different county within same state (%) - Multirace
Geographical mobility - Moved from different county within same state (%) - Other Race
Geographical mobility - Moved from different state (%)
Geographical mobility - Moved from different state (%) - White
Geographical mobility - Moved from different state (%) - Black or African American
Geographical mobility - Moved from different state (%) - Asian
Geographical mobility - Moved from different state (%) - Hispanic or Latino
Geographical mobility - Moved from different state (%) - American Indian and Alaska Native
Geographical mobility - Moved from different state (%) - Multirace
Geographical mobility - Moved from different state (%) - Other Race
Geographical mobility - Moved from abroad (%)
Geographical mobility - Moved from abroad (%) - White
Geographical mobility - Moved from abroad (%) - Black or African American
Geographical mobility - Moved from abroad (%) - Asian
Geographical mobility - Moved from abroad (%) - Hispanic or Latino
Geographical mobility - Moved from abroad (%) - American Indian and Alaska Native
Geographical mobility - Moved from abroad (%) - Multirace
Geographical mobility - Moved from abroad (%) - Other Race
Place of birth for the foreign-born population - Ireland (%)
Place of birth for the foreign-born population - Denmark (%)
Place of birth for the foreign-born population - Norway (%)
Place of birth for the foreign-born population - Sweden (%)
Place of birth for the foreign-born population - United Kingdom (%)
Place of birth for the foreign-born population - England (%)
Place of birth for the foreign-born population - Scotland (%)
Place of birth for the foreign-born population - Other Northern Europe (%)
Place of birth for the foreign-born population - Austria (%)
Place of birth for the foreign-born population - Belgium (%)
Place of birth for the foreign-born population - France (%)
Place of birth for the foreign-born population - Germany (%)
Place of birth for the foreign-born population - Netherlands (%)
Place of birth for the foreign-born population - Switzerland (%)
Place of birth for the foreign-born population - Other Western Europe (%)
Place of birth for the foreign-born population - Greece (%)
Place of birth for the foreign-born population - Italy (%)
Place of birth for the foreign-born population - Portugal (%)
Place of birth for the foreign-born population - Spain (%)
Place of birth for the foreign-born population - Other Southern Europe (%)
Place of birth for the foreign-born population - Albania (%)
Place of birth for the foreign-born population - Belarus (%)
Place of birth for the foreign-born population - Bosnia and Herzegovina (%)
Place of birth for the foreign-born population - Bulgaria (%)
Place of birth for the foreign-born population - Croatia (%)
Place of birth for the foreign-born population - Czechoslovakia (%)
Place of birth for the foreign-born population - Hungary (%)
Place of birth for the foreign-born population - Latvia (%)
Place of birth for the foreign-born population - Lithuania (%)
Place of birth for the foreign-born population - North Macedonia (Macedonia) (%)
Place of birth for the foreign-born population - Moldova (%)
Place of birth for the foreign-born population - Poland (%)
Place of birth for the foreign-born population - Romania (%)
Place of birth for the foreign-born population - Russia (%)
Place of birth for the foreign-born population - Serbia (%)
Place of birth for the foreign-born population - Ukraine (%)
Place of birth for the foreign-born population - Other Eastern Europe (%)
Place of birth for the foreign-born population - China (%)
Place of birth for the foreign-born population - Hong Kong (%)
Place of birth for the foreign-born population - Taiwan (%)
Place of birth for the foreign-born population - Japan (%)
Place of birth for the foreign-born population - Korea (%)
Place of birth for the foreign-born population - Other Eastern Asia (%)
Place of birth for the foreign-born population - Afghanistan (%)
Place of birth for the foreign-born population - Bangladesh (%)
Place of birth for the foreign-born population - India (%)
Place of birth for the foreign-born population - Iran (%)
Place of birth for the foreign-born population - Kazakhstan (%)
Place of birth for the foreign-born population - Nepal (%)
Place of birth for the foreign-born population - Pakistan (%)
Place of birth for the foreign-born population - Sri Lanka (%)
Place of birth for the foreign-born population - Uzbekistan (%)
Place of birth for the foreign-born population - Other South Central Asia (%)
Place of birth for the foreign-born population - Burma (%)
Place of birth for the foreign-born population - Cambodia (%)
Place of birth for the foreign-born population - Indonesia (%)
Place of birth for the foreign-born population - Laos (%)
Place of birth for the foreign-born population - Malaysia (%)
Place of birth for the foreign-born population - Philippines (%)
Place of birth for the foreign-born population - Singapore (%)
Place of birth for the foreign-born population - Thailand (%)
Place of birth for the foreign-born population - Vietnam (%)
Place of birth for the foreign-born population - Other South Eastern Asia (%)
Place of birth for the foreign-born population - Armenia (%)
Place of birth for the foreign-born population - Iraq (%)
Place of birth for the foreign-born population - Israel (%)
Place of birth for the foreign-born population - Jordan (%)
Place of birth for the foreign-born population - Kuwait (%)
Place of birth for the foreign-born population - Lebanon (%)
Place of birth for the foreign-born population - Saudi Arabia (%)
Place of birth for the foreign-born population - Syria (%)
Place of birth for the foreign-born population - Turkey (%)
Place of birth for the foreign-born population - Yemen (%)
Place of birth for the foreign-born population - Other Western Asia (%)
Place of birth for the foreign-born population - Eritrea (%)
Place of birth for the foreign-born population - Ethiopia (%)
Place of birth for the foreign-born population - Kenya (%)
Place of birth for the foreign-born population - Somalia (%)
Place of birth for the foreign-born population - Uganda (%)
Place of birth for the foreign-born population - Zimbabwe (%)
Place of birth for the foreign-born population - Other Eastern Africa (%)
Place of birth for the foreign-born population - Cameroon (%)
Place of birth for the foreign-born population - Congo (%)
Place of birth for the foreign-born population - Democratic Republic of Congo (Zaire) (%)
Place of birth for the foreign-born population - Other Middle Africa (%)
Place of birth for the foreign-born population - Egypt (%)
Place of birth for the foreign-born population - Morocco (%)
Place of birth for the foreign-born population - Sudan (%)
Place of birth for the foreign-born population - Other Northern Africa (%)
Place of birth for the foreign-born population - South Africa (%)
Place of birth for the foreign-born population - Other Southern Africa (%)
Place of birth for the foreign-born population - Cabo Verde (%)
Place of birth for the foreign-born population - Ghana (%)
Place of birth for the foreign-born population - Liberia (%)
Place of birth for the foreign-born population - Nigeria (%)
Place of birth for the foreign-born population - Senegal (%)
Place of birth for the foreign-born population - Sierra Leone (%)
Place of birth for the foreign-born population - Other Western Africa (%)
Place of birth for the foreign-born population - Australia (%)
Place of birth for the foreign-born population - New Zealand (%)
Place of birth for the foreign-born population - Fiji (%)
Place of birth for the foreign-born population - Micronesia (%)
Place of birth for the foreign-born population - Bahamas (%)
Place of birth for the foreign-born population - Barbados (%)
Place of birth for the foreign-born population - Cuba (%)
Place of birth for the foreign-born population - Dominica (%)
Place of birth for the foreign-born population - Dominican Republic (%)
Place of birth for the foreign-born population - Grenada (%)
Place of birth for the foreign-born population - Haiti (%)
Place of birth for the foreign-born population - Jamaica (%)
Place of birth for the foreign-born population - St. Vincent and the Grenadines (%)
Place of birth for the foreign-born population - Trinidad and Tobago (%)
Place of birth for the foreign-born population - West Indies (%)
Place of birth for the foreign-born population - Other Caribbean (%)
Place of birth for the foreign-born population - Belize (%)
Place of birth for the foreign-born population - Costa Rica (%)
Place of birth for the foreign-born population - El Salvador (%)
Place of birth for the foreign-born population - Guatemala (%)
Place of birth for the foreign-born population - Honduras (%)
Place of birth for the foreign-born population - Mexico (%)
Place of birth for the foreign-born population - Nicaragua (%)
Place of birth for the foreign-born population - Panama (%)
Place of birth for the foreign-born population - Other Central America (%)
Place of birth for the foreign-born population - Argentina (%)
Place of birth for the foreign-born population - Bolivia (%)
Place of birth for the foreign-born population - Brazil (%)
Place of birth for the foreign-born population - Chile (%)
Place of birth for the foreign-born population - Colombia (%)
Place of birth for the foreign-born population - Ecuador (%)
Place of birth for the foreign-born population - Guyana (%)
Place of birth for the foreign-born population - Peru (%)
Place of birth for the foreign-born population - Uruguay (%)
Place of birth for the foreign-born population - Venezuela (%)
Place of birth for the foreign-born population - Other South America (%)
Place of birth for the foreign-born population - Canada (%)
Place of birth for the foreign-born population - Other Northern America (%)
Place of birth for the foreign-born population - Other (%)
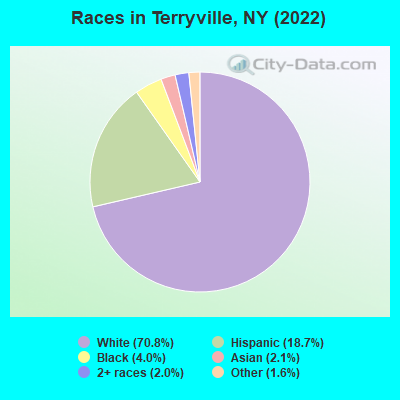
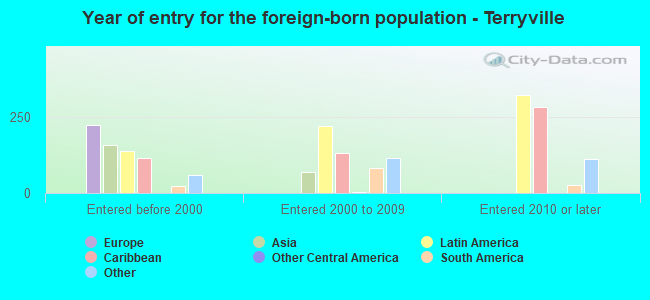
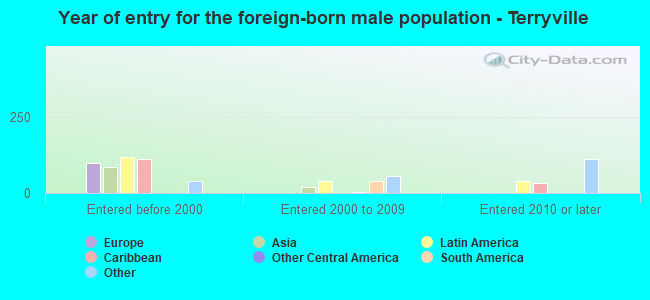
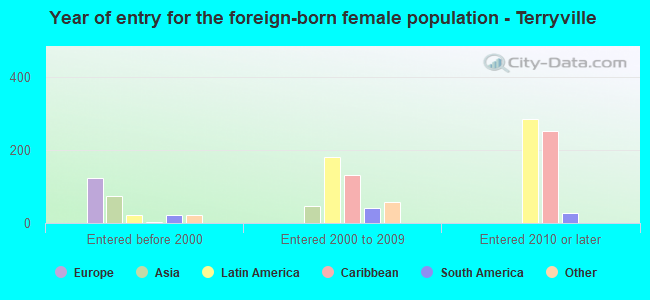
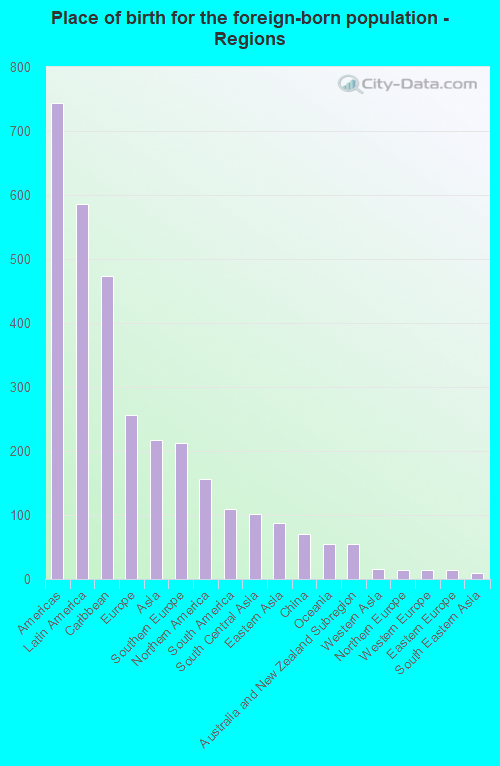
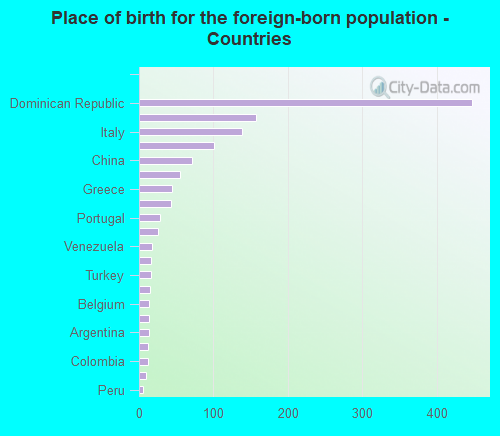
According to 2022 data, the most numerous races in Terryville, NY are White alone (7,714 residents), Hispanic (2,038 residents), and Black alone (434 residents). 83.3% of Terryville residents speak English at home. 11.7% of Terryville, NY residents are foreign-born (5.4% born in Latin America, 2.4% born in Europe, 2.0% born in Asia, 1.5% born in North America), which is 88.3% less than the foreign-born rate of 22.0% across the entire state of New York.
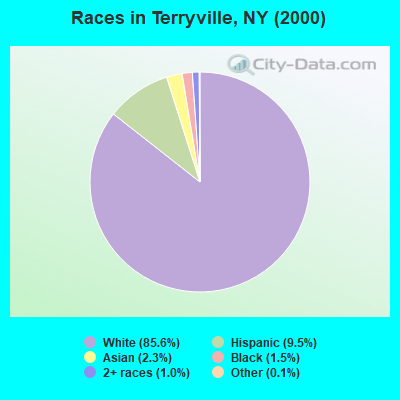
Race distribution in Terryville
2000 2022
11,760,981 62.0% White alone 2,867,583 15.1% Hispanic 2,812,623 14.8% Black alone 1,035,926 5.5% Asian alone 366,116 1.9% Two or more races 75,499 0.4% Other race alone 52,499 0.3% American Indian alone 5,230 0.03% Native Hawaiian and Other
10,408,933 52.9% White alone 3,867,299 19.7% Hispanic 2,633,840 13.4% Black alone 1,776,286 9.0% Asian alone 732,670 3.7% Two or more races 216,110 1.1% Other race alone 35,082 0.2% American Indian alone 6,931 0.04% Native Hawaiian and Other
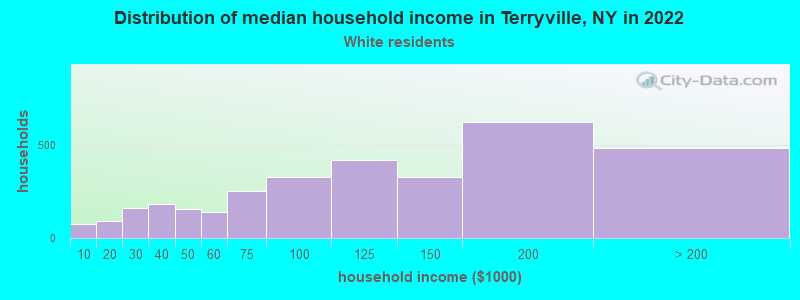
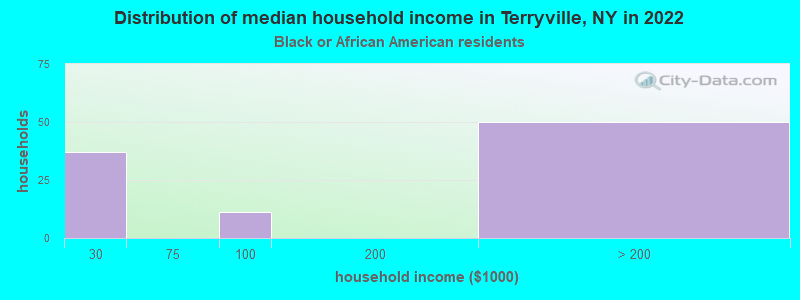
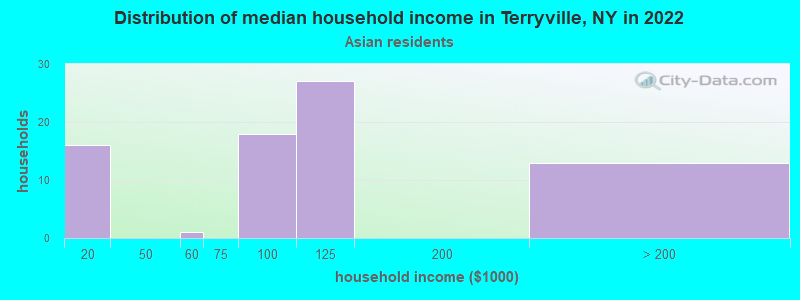
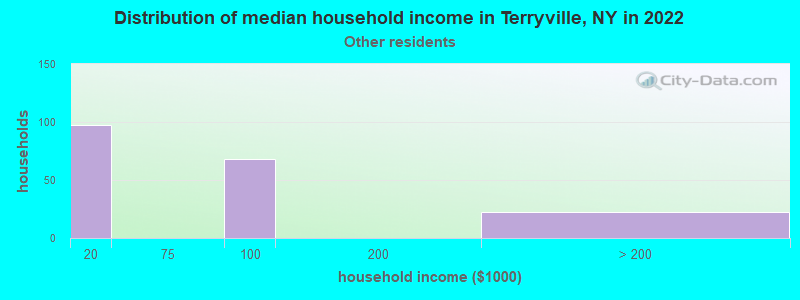
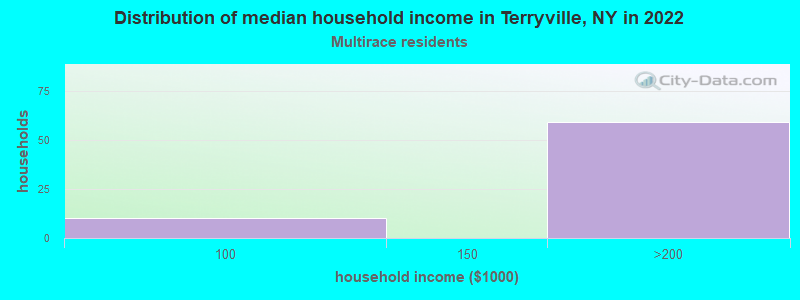
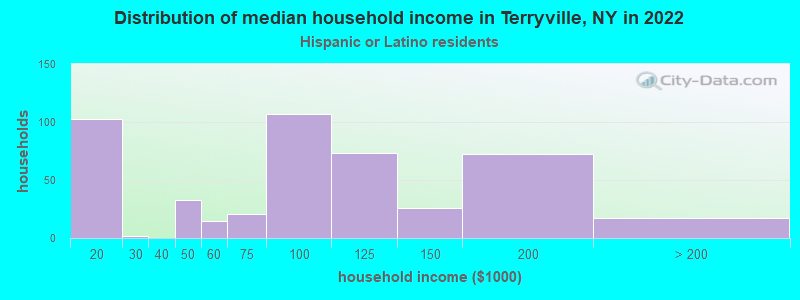
Income and house value in Terryville Median household income in 2022 $111,091 White non-Hispanic householders$80,313 Asian householders$150,279 Two or more races householders$81,617 Hispanic or Latino race householdersMedian 2022 house value $481,252 White Non-Hispanic householders$513,958 Black or African American householders $312,755 Asian householders$398,026 Some other race householders$536,736 Two or more races householders$495,853 Hispanic or Latino householders
Median age by race in Terryville
43.3 Median age for White residents42.6 44.2 26.9 Median age for Black or African American residents41.4 26.3 -748,832,865.7 Median age for American Indian / Alaska Native residents-807,017,543.1 -513,692,161.9 58.1 Median age for Asian residents57.0 58.8 -742,816,091.2 Median age for Native Hawaiian / Pacific Islander residents-831,187,409.8 -771,300,447.7 13.7 Median age for Other race residents12.3 30.8 31.9 Median age for Two or more races residents30.3 44.8 43.6 Median age for White alone residents41.9 47.1 28.6 Median age for Hispanic or Latino residents33.1 26.7
Owner/renter occupied households by race in Terryville
House owners and renters - White residents 2,553 79.5% Owner occupied659 20.5% Renter occupiedHouse owners and renters - Black or African American residents 100 100.0% Owner occupiedHouse owners and renters - Asian residents 72 82.9% Owner occupied15 17.1% Renter occupiedHouse owners and renters - Other race residents 42 16.1% Owner occupied219 83.9% Renter occupiedHouse owners and renters - Two or more races residents 65 100.0% Owner occupiedHouse owners and renters - White alone residents 2,433 78.8% Owner occupied656 21.2% Renter occupiedHouse owners and renters - Hispanic or Latino residents 237 51.4% Owner occupied224 48.6% Renter occupied
Language usage in Terryville
English speakers - Total 83.3% of residents of Terryville speak English at home.
8.8% of residents speak Spanish at home 486 52.7% Speak English very well436 47.3% Speak English less than very well7.0% of residents speak other language at home 348 47.5% Speak English very well384 52.5% Speak English less than very well
English speakers - Born in the United States 99.1% of residents of Terryville speak English at home.
0.5% of residents speak Spanish at home 4 100.0% Speak English very well0.9% of residents speak other language at home 7 100.0% Speak English very well
English speakers - Native, born elsewhere 64.8% of residents of Terryville speak English at home.
36.3% of residents speak Spanish at home 98 100.0% Speak English very well
English speakers - Foreign-born 19.6% of residents of Terryville speak English at home.
43.7% of residents speak Spanish at home 160 26.8% Speak English very well438 73.2% Speak English less than very well36.5% of residents speak other language at home 172 34.4% Speak English very well328 65.6% Speak English less than very well
White (Caucasian) - Speak only English Native:
96.9% (7,192)Foreign-born:
36.9% (189)
White (Caucasian) - Speak another language Native:
3.6% (268)Foreign-born:
65.3% (333)
Asian - Speak another language Native:
97.0% (22)Foreign-born:
100.0% (199)
Other race - Speak only English Native:
82.7% (735)Foreign-born:
0.7% (2)
Other race - Speak another language Native:
22.3% (198)Foreign-born:
100.0% (374)
Two or more races - Speak only English Native:
100.0% (128)Foreign-born:
77.9% (70)
White alone - Speak only English Native:
96.8% (6,841)Foreign-born:
43.7% (205)
White alone - Speak another language Native:
3.2% (223)Foreign-born:
56.4% (265)
Hispanic or Latino - Speak only English Native:
76.0% (908)Foreign-born:
0.4% (2)
Hispanic or Latino - Speak another language Native:
25.7% (307)Foreign-born:
100.0% (582)
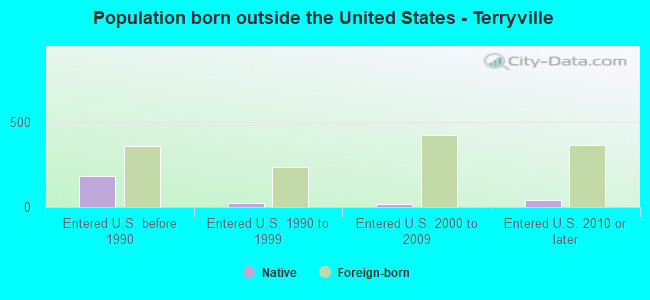
Foreign-born residents in Terryville 1,273 residents are foreign born (5.4% Latin America , 2.4% Europe , 2.0% Asia , 1.5% North America ).
This city:
11.7%New York:
22.6%
Marital status for residents in Terryville Marital status - White (Caucasian) population 15 years and over
Males 25.7% Never married64.3% Now married1.2% Separated0.8% Widowed7.9% DivorcedFemales 30.0% Never married46.9% Now married0.7% Separated11.0% Widowed11.4% DivorcedWomen who gave birth in the past 12 months Now married:
89.1% (42)Unmarried:
10.9% (5)
Women who did not give birth in the past 12 months Now married:
41.5% (752)Unmarried:
58.5% (1,058)
Marital status - Black or African American population 15 years and over
Males 44.3% Never married55.7% Now married0.0% Separated0.0% Widowed0.0% DivorcedFemales 45.3% Never married44.9% Now married0.0% Separated5.9% Widowed3.9% DivorcedWomen who did not give birth in the past 12 months Now married:
41.7% (82)Unmarried:
58.3% (115)
Marital status - Asian population 15 years and over
Males 30.3% Never married69.7% Now married0.0% Separated0.0% Widowed0.0% DivorcedFemales 26.5% Never married55.8% Now married0.0% Separated15.0% Widowed2.7% DivorcedWomen who did not give birth in the past 12 months Now married:
26.7% (12)Unmarried:
73.3% (34)
Marital status - Other race population 15 years and over
Males 4.3% Never married83.6% Now married0.0% Separated12.1% Widowed0.0% DivorcedFemales 16.8% Never married52.0% Now married0.0% Separated28.0% Widowed3.1% DivorcedWomen who gave birth in the past 12 months Now married:
100.0% (13)Unmarried:
0.0% (0)
Women who did not give birth in the past 12 months Now married:
54.6% (95)Unmarried:
45.4% (79)
Marital status - Two or more races population 15 years and over
Males 76.2% Never married23.8% Now married0.0% Separated0.0% Widowed0.0% DivorcedFemales 9.0% Never married79.1% Now married0.0% Separated0.0% Widowed11.9% DivorcedWomen who did not give birth in the past 12 months Now married:
79.1% (78)Unmarried:
20.9% (20)
Marital status - White alone, not Hispanic / Latino population 15 years and over
Males 25.3% Never married63.7% Now married1.4% Separated0.9% Widowed8.8% DivorcedFemales 28.0% Never married48.3% Now married0.8% Separated11.9% Widowed11.0% DivorcedWomen who gave birth in the past 12 months Now married:
89.1% (46)Unmarried:
10.9% (6)
Women who did not give birth in the past 12 months Now married:
44.3% (741)Unmarried:
55.7% (933)
Marital status - Hispanic or Latino population 15 years and over
Males 23.9% Never married73.1% Now married0.0% Separated2.9% Widowed0.0% DivorcedFemales 34.4% Never married41.2% Now married0.0% Separated13.6% Widowed10.9% DivorcedWomen who gave birth in the past 12 months Now married:
100.0% (9)Unmarried:
0.0% (0)
Women who did not give birth in the past 12 months Now married:
33.0% (148)Unmarried:
67.0% (299)
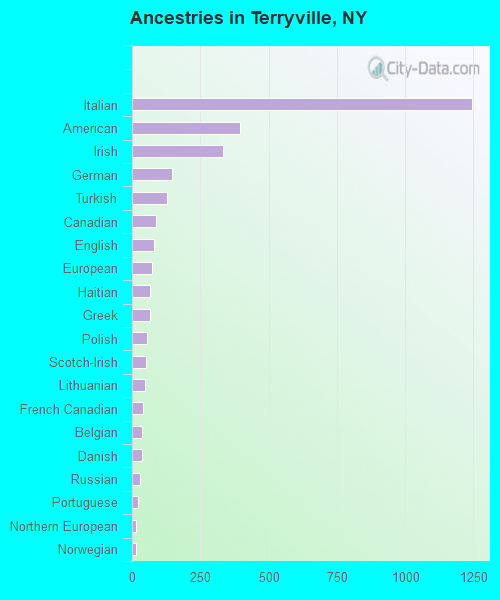
Ancestries in Terryville
1,245 24.9% Italian397 7.9% American334 6.7% Irish148 3.0% German129 2.6% Turkish87 1.7% Canadian81 1.6% English73 1.5% European67 1.3% Haitian66 1.3% Greek54 1.1% Polish51 1.0% Scotch-Irish46 0.9% Lithuanian42 0.8% French Canadian36 0.7% Belgian36 0.7% Danish31 0.6% Russian21 0.4% Portuguese16 0.3% Northern European14 0.3% Norwegian11 0.2% Welsh8 0.2% African7 0.1% British
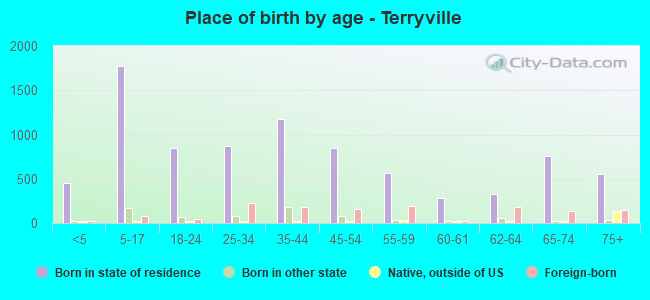
Children Nativity (place of birth) in Terryville
Children under 6 years - Living with two parents Both parents native 448 100.0% NativeOne native, one foreign-born parent 61 76.0% Native19 24.0% Foreign-bornChildren under 6 years - Living with one parent Foreign-born parent 62 100.0% NativeChildren 6 to 17 years - Living with two parents Both parents native 1,228 100.0% Native0 0.0% Foreign-bornBoth parents foreign-born 142 100.0% NativeOne native, one foreign-born parent 37 85.3% Native6 14.7% Foreign-bornChildren 6 to 17 years - Living with one parent Native parent 123 100.0% NativeForeign-born parent 192 65.7% Native100 34.3% Foreign-born
Grandparents responsible for own grandchildren in Terryville
Grandparents (30 to 59 years) White / Caucasian 38 100.0% Not responsible for grandchildrenOther race 78 100.0% Not responsible for grandchildrenWhite alone, not Hispanic / Latino 16 100.0% Not responsible for grandchildrenHispanic or Latino 114 100.0% Not responsible for grandchildrenGrandparents (60 years and over) White / Caucasian 33 39.4% Responsible for grandchildren50 60.6% Not responsible for grandchildrenOther race 149 100.0% Not responsible for grandchildrenWhite alone, not Hispanic / Latino 39 41.9% Responsible for grandchildren55 58.1% Not responsible for grandchildrenHispanic or Latino 113 100.0% Not responsible for grandchildren