Races in West Babylon, New York (NY) Detailed Stats
Data:
Races - White alone (%)
Races - White alone (% change since 2000)
Races - Black alone (%)
Races - Black alone (% change since 2000)
Races - American Indian alone (%)
Races - American Indian alone (% change since 2000)
Races - Asian alone (%)
Races - Asian alone (% change since 2000)
Races - Hispanic (%)
Races - Hispanic (% change since 2000)
Races - Native Hawaiian and Other Pacific Islander alone (%)
Races - Native Hawaiian and Other Pacific Islander alone (% change since 2000)
Races - Two or more races(%)
Races - Two or more races(% change since 2000)
Races - Other race alone (%)
Races - Other race alone (% change since 2000)
Racial diversity
Place of birth - Born in state of residence (%)
Place of birth - Born in state of residence (%) - White
Place of birth - Born in state of residence (%) - Black or African American
Place of birth - Born in state of residence (%) - Asian
Place of birth - Born in state of residence (%) - Hispanic or Latino
Place of birth - Born in state of residence (%) - American Indian and Alaska Native
Place of birth - Born in state of residence (%) - Multirace
Place of birth - Born in state of residence (%) - Other Race
Place of birth - Born in other state (%)
Place of birth - Born in other state (%) - White
Place of birth - Born in other state (%) - Black or African American
Place of birth - Born in other state (%) - Asian
Place of birth - Born in other state (%) - Hispanic or Latino
Place of birth - Born in other state (%) - American Indian and Alaska Native
Place of birth - Born in other state (%) - Multirace
Place of birth - Born in other state (%) - Other Race
Place of birth - Native, outside of US (%)
Place of birth - Native, outside of US (%) - White
Place of birth - Native, outside of US (%) - Black or African American
Place of birth - Native, outside of US (%) - Asian
Place of birth - Native, outside of US (%) - Hispanic or Latino
Place of birth - Native, outside of US (%) - American Indian and Alaska Native
Place of birth - Native, outside of US (%) - Multirace
Place of birth - Native, outside of US (%) - Other Race
Place of birth - Foreign born (%)
Place of birth - Foreign born (%) - White
Place of birth - Foreign born (%) - Black or African American
Place of birth - Foreign born (%) - Asian
Place of birth - Foreign born (%) - Hispanic or Latino
Place of birth - Foreign born (%) - American Indian and Alaska Native
Place of birth - Foreign born (%) - Multirace
Place of birth - Foreign born (%) - Other Race
Residents speaking English at home (%)
Residents speaking English at home - Born in the United States (%)
Residents speaking English at home - Native, born elsewhere (%)
Residents speaking English at home - Foreign born (%)
Residents speaking Spanish at home (%)
Residents speaking Spanish at home - Born in the United States (%)
Residents speaking Spanish at home - Native, born elsewhere (%)
Residents speaking Spanish at home - Foreign born (%)
Residents speaking other language at home (%)
Residents speaking other language at home - Born in the United States (%)
Residents speaking other language at home - Native, born elsewhere (%)
Residents speaking other language at home - Foreign born (%)
Marital status - Never married (%)
Marital status - Now married (%)
Marital status - Separated (%)
Marital status - Widowed (%)
Marital status - Divorced (%)
Ancestries Reported - Arab (%)
Ancestries Reported - Czech (%)
Ancestries Reported - Danish (%)
Ancestries Reported - Dutch (%)
Ancestries Reported - English (%)
Ancestries Reported - French (%)
Ancestries Reported - French Canadian (%)
Ancestries Reported - German (%)
Ancestries Reported - Greek (%)
Ancestries Reported - Hungarian (%)
Ancestries Reported - Irish (%)
Ancestries Reported - Italian (%)
Ancestries Reported - Lithuanian (%)
Ancestries Reported - Norwegian (%)
Ancestries Reported - Polish (%)
Ancestries Reported - Portuguese (%)
Ancestries Reported - Russian (%)
Ancestries Reported - Scotch-Irish (%)
Ancestries Reported - Scottish (%)
Ancestries Reported - Slovak (%)
Ancestries Reported - Subsaharan African (%)
Ancestries Reported - Swedish (%)
Ancestries Reported - Swiss (%)
Ancestries Reported - Ukrainian (%)
Ancestries Reported - United States (%)
Ancestries Reported - Welsh (%)
Ancestries Reported - West Indian (%)
Ancestries Reported - Other (%)
Geographical mobility - Same house 1 year ago (%)
Geographical mobility - Same house 1 year ago (%) - White
Geographical mobility - Same house 1 year ago (%) - Black or African American
Geographical mobility - Same house 1 year ago (%) - Asian
Geographical mobility - Same house 1 year ago (%) - Hispanic or Latino
Geographical mobility - Same house 1 year ago (%) - American Indian and Alaska Native
Geographical mobility - Same house 1 year ago (%) - Multirace
Geographical mobility - Same house 1 year ago (%) - Other Race
Geographical mobility - Moved within same county (%)
Geographical mobility - Moved within same county (%) - White
Geographical mobility - Moved within same county (%) - Black or African American
Geographical mobility - Moved within same county (%) - Asian
Geographical mobility - Moved within same county (%) - Hispanic or Latino
Geographical mobility - Moved within same county (%) - American Indian and Alaska Native
Geographical mobility - Moved within same county (%) - Multirace
Geographical mobility - Moved within same county (%) - Other Race
Geographical mobility - Moved from different county within same state (%)
Geographical mobility - Moved from different county within same state (%) - White
Geographical mobility - Moved from different county within same state (%) - Black or African American
Geographical mobility - Moved from different county within same state (%) - Asian
Geographical mobility - Moved from different county within same state (%) - Hispanic or Latino
Geographical mobility - Moved from different county within same state (%) - American Indian and Alaska Native
Geographical mobility - Moved from different county within same state (%) - Multirace
Geographical mobility - Moved from different county within same state (%) - Other Race
Geographical mobility - Moved from different state (%)
Geographical mobility - Moved from different state (%) - White
Geographical mobility - Moved from different state (%) - Black or African American
Geographical mobility - Moved from different state (%) - Asian
Geographical mobility - Moved from different state (%) - Hispanic or Latino
Geographical mobility - Moved from different state (%) - American Indian and Alaska Native
Geographical mobility - Moved from different state (%) - Multirace
Geographical mobility - Moved from different state (%) - Other Race
Geographical mobility - Moved from abroad (%)
Geographical mobility - Moved from abroad (%) - White
Geographical mobility - Moved from abroad (%) - Black or African American
Geographical mobility - Moved from abroad (%) - Asian
Geographical mobility - Moved from abroad (%) - Hispanic or Latino
Geographical mobility - Moved from abroad (%) - American Indian and Alaska Native
Geographical mobility - Moved from abroad (%) - Multirace
Geographical mobility - Moved from abroad (%) - Other Race
Place of birth for the foreign-born population - Ireland (%)
Place of birth for the foreign-born population - Denmark (%)
Place of birth for the foreign-born population - Norway (%)
Place of birth for the foreign-born population - Sweden (%)
Place of birth for the foreign-born population - United Kingdom (%)
Place of birth for the foreign-born population - England (%)
Place of birth for the foreign-born population - Scotland (%)
Place of birth for the foreign-born population - Other Northern Europe (%)
Place of birth for the foreign-born population - Austria (%)
Place of birth for the foreign-born population - Belgium (%)
Place of birth for the foreign-born population - France (%)
Place of birth for the foreign-born population - Germany (%)
Place of birth for the foreign-born population - Netherlands (%)
Place of birth for the foreign-born population - Switzerland (%)
Place of birth for the foreign-born population - Other Western Europe (%)
Place of birth for the foreign-born population - Greece (%)
Place of birth for the foreign-born population - Italy (%)
Place of birth for the foreign-born population - Portugal (%)
Place of birth for the foreign-born population - Spain (%)
Place of birth for the foreign-born population - Other Southern Europe (%)
Place of birth for the foreign-born population - Albania (%)
Place of birth for the foreign-born population - Belarus (%)
Place of birth for the foreign-born population - Bosnia and Herzegovina (%)
Place of birth for the foreign-born population - Bulgaria (%)
Place of birth for the foreign-born population - Croatia (%)
Place of birth for the foreign-born population - Czechoslovakia (%)
Place of birth for the foreign-born population - Hungary (%)
Place of birth for the foreign-born population - Latvia (%)
Place of birth for the foreign-born population - Lithuania (%)
Place of birth for the foreign-born population - North Macedonia (Macedonia) (%)
Place of birth for the foreign-born population - Moldova (%)
Place of birth for the foreign-born population - Poland (%)
Place of birth for the foreign-born population - Romania (%)
Place of birth for the foreign-born population - Russia (%)
Place of birth for the foreign-born population - Serbia (%)
Place of birth for the foreign-born population - Ukraine (%)
Place of birth for the foreign-born population - Other Eastern Europe (%)
Place of birth for the foreign-born population - China (%)
Place of birth for the foreign-born population - Hong Kong (%)
Place of birth for the foreign-born population - Taiwan (%)
Place of birth for the foreign-born population - Japan (%)
Place of birth for the foreign-born population - Korea (%)
Place of birth for the foreign-born population - Other Eastern Asia (%)
Place of birth for the foreign-born population - Afghanistan (%)
Place of birth for the foreign-born population - Bangladesh (%)
Place of birth for the foreign-born population - India (%)
Place of birth for the foreign-born population - Iran (%)
Place of birth for the foreign-born population - Kazakhstan (%)
Place of birth for the foreign-born population - Nepal (%)
Place of birth for the foreign-born population - Pakistan (%)
Place of birth for the foreign-born population - Sri Lanka (%)
Place of birth for the foreign-born population - Uzbekistan (%)
Place of birth for the foreign-born population - Other South Central Asia (%)
Place of birth for the foreign-born population - Burma (%)
Place of birth for the foreign-born population - Cambodia (%)
Place of birth for the foreign-born population - Indonesia (%)
Place of birth for the foreign-born population - Laos (%)
Place of birth for the foreign-born population - Malaysia (%)
Place of birth for the foreign-born population - Philippines (%)
Place of birth for the foreign-born population - Singapore (%)
Place of birth for the foreign-born population - Thailand (%)
Place of birth for the foreign-born population - Vietnam (%)
Place of birth for the foreign-born population - Other South Eastern Asia (%)
Place of birth for the foreign-born population - Armenia (%)
Place of birth for the foreign-born population - Iraq (%)
Place of birth for the foreign-born population - Israel (%)
Place of birth for the foreign-born population - Jordan (%)
Place of birth for the foreign-born population - Kuwait (%)
Place of birth for the foreign-born population - Lebanon (%)
Place of birth for the foreign-born population - Saudi Arabia (%)
Place of birth for the foreign-born population - Syria (%)
Place of birth for the foreign-born population - Turkey (%)
Place of birth for the foreign-born population - Yemen (%)
Place of birth for the foreign-born population - Other Western Asia (%)
Place of birth for the foreign-born population - Eritrea (%)
Place of birth for the foreign-born population - Ethiopia (%)
Place of birth for the foreign-born population - Kenya (%)
Place of birth for the foreign-born population - Somalia (%)
Place of birth for the foreign-born population - Uganda (%)
Place of birth for the foreign-born population - Zimbabwe (%)
Place of birth for the foreign-born population - Other Eastern Africa (%)
Place of birth for the foreign-born population - Cameroon (%)
Place of birth for the foreign-born population - Congo (%)
Place of birth for the foreign-born population - Democratic Republic of Congo (Zaire) (%)
Place of birth for the foreign-born population - Other Middle Africa (%)
Place of birth for the foreign-born population - Egypt (%)
Place of birth for the foreign-born population - Morocco (%)
Place of birth for the foreign-born population - Sudan (%)
Place of birth for the foreign-born population - Other Northern Africa (%)
Place of birth for the foreign-born population - South Africa (%)
Place of birth for the foreign-born population - Other Southern Africa (%)
Place of birth for the foreign-born population - Cabo Verde (%)
Place of birth for the foreign-born population - Ghana (%)
Place of birth for the foreign-born population - Liberia (%)
Place of birth for the foreign-born population - Nigeria (%)
Place of birth for the foreign-born population - Senegal (%)
Place of birth for the foreign-born population - Sierra Leone (%)
Place of birth for the foreign-born population - Other Western Africa (%)
Place of birth for the foreign-born population - Australia (%)
Place of birth for the foreign-born population - New Zealand (%)
Place of birth for the foreign-born population - Fiji (%)
Place of birth for the foreign-born population - Micronesia (%)
Place of birth for the foreign-born population - Bahamas (%)
Place of birth for the foreign-born population - Barbados (%)
Place of birth for the foreign-born population - Cuba (%)
Place of birth for the foreign-born population - Dominica (%)
Place of birth for the foreign-born population - Dominican Republic (%)
Place of birth for the foreign-born population - Grenada (%)
Place of birth for the foreign-born population - Haiti (%)
Place of birth for the foreign-born population - Jamaica (%)
Place of birth for the foreign-born population - St. Vincent and the Grenadines (%)
Place of birth for the foreign-born population - Trinidad and Tobago (%)
Place of birth for the foreign-born population - West Indies (%)
Place of birth for the foreign-born population - Other Caribbean (%)
Place of birth for the foreign-born population - Belize (%)
Place of birth for the foreign-born population - Costa Rica (%)
Place of birth for the foreign-born population - El Salvador (%)
Place of birth for the foreign-born population - Guatemala (%)
Place of birth for the foreign-born population - Honduras (%)
Place of birth for the foreign-born population - Mexico (%)
Place of birth for the foreign-born population - Nicaragua (%)
Place of birth for the foreign-born population - Panama (%)
Place of birth for the foreign-born population - Other Central America (%)
Place of birth for the foreign-born population - Argentina (%)
Place of birth for the foreign-born population - Bolivia (%)
Place of birth for the foreign-born population - Brazil (%)
Place of birth for the foreign-born population - Chile (%)
Place of birth for the foreign-born population - Colombia (%)
Place of birth for the foreign-born population - Ecuador (%)
Place of birth for the foreign-born population - Guyana (%)
Place of birth for the foreign-born population - Peru (%)
Place of birth for the foreign-born population - Uruguay (%)
Place of birth for the foreign-born population - Venezuela (%)
Place of birth for the foreign-born population - Other South America (%)
Place of birth for the foreign-born population - Canada (%)
Place of birth for the foreign-born population - Other Northern America (%)
Place of birth for the foreign-born population - Other (%)
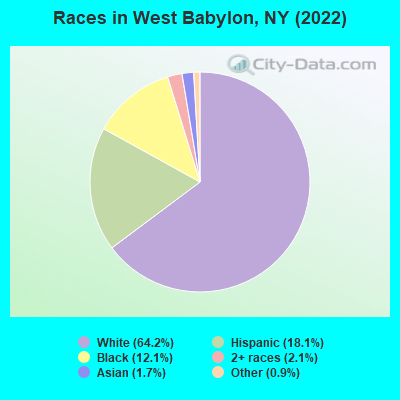
According to 2022 data, the most numerous races in West Babylon, NY are White alone (27,477 residents), Hispanic (7,729 residents), and Black alone (5,196 residents). 78.5% of West Babylon residents speak English at home. 14.7% of West Babylon, NY residents are foreign-born (10.1% born in Latin America, 2.5% born in Europe, 2.0% born in Asia), which is 50.0% less than the foreign-born rate of 22.0% across the entire state of New York.
Race distribution in West Babylon
2000 2022
11,760,981 62.0% White alone 2,867,583 15.1% Hispanic 2,812,623 14.8% Black alone 1,035,926 5.5% Asian alone 366,116 1.9% Two or more races 75,499 0.4% Other race alone 52,499 0.3% American Indian alone 5,230 0.03% Native Hawaiian and Other
10,408,933 52.9% White alone 3,867,299 19.7% Hispanic 2,633,840 13.4% Black alone 1,776,286 9.0% Asian alone 732,670 3.7% Two or more races 216,110 1.1% Other race alone 35,082 0.2% American Indian alone 6,931 0.04% Native Hawaiian and Other
Income and house value in West Babylon Median household income in 2022 $118,080 White non-Hispanic householders$126,018 Black householders$71,260 American Indian and Alaska Native householders$104,696 Asian householders$150,555 Some other race householders$79,852 Two or more races householders$130,187 Hispanic or Latino race householdersMedian 2022 house value $499,353 White Non-Hispanic householders$469,107 Black or African American householders$538,672 American Indian or Alaska Native householders $511,451 Asian householders$527,179 Some other race householders$444,911 Two or more races householders$535,648 Hispanic or Latino householders
Median age by race in West Babylon
48.4 Median age for White residents45.9 51.0 38.8 Median age for Black or African American residents35.9 41.9 56.4 Median age for American Indian / Alaska Native residents54.8 39.0 43.4 Median age for Asian residents40.1 45.3 -742,816,091.2 Median age for Native Hawaiian / Pacific Islander residents-831,187,409.8 -771,300,447.7 32.3 Median age for Other race residents34.2 29.5 34.7 Median age for Two or more races residents32.8 37.9 48.5 Median age for White alone residents46.4 50.9 34.2 Median age for Hispanic or Latino residents35.8 33.2
Owner/renter occupied households by race in West Babylon
House owners and renters - White residents 8,092 78.1% Owner occupied2,272 21.9% Renter occupiedHouse owners and renters - Black or African American residents 1,061 79.9% Owner occupied267 20.1% Renter occupiedHouse owners and renters - American Indian / Alaska Native residents 50 100.0% Owner occupiedHouse owners and renters - Asian residents 173 71.1% Owner occupied70 28.9% Renter occupiedHouse owners and renters - Other race residents 650 73.3% Owner occupied237 26.7% Renter occupiedHouse owners and renters - Two or more races residents 669 68.7% Owner occupied304 31.3% Renter occupiedHouse owners and renters - White alone residents 7,919 77.5% Owner occupied2,297 22.5% Renter occupiedHouse owners and renters - Hispanic or Latino residents 1,298 69.6% Owner occupied567 30.4% Renter occupied
Language usage in West Babylon
English speakers - Total 78.5% of residents of West Babylon speak English at home.
10.5% of residents speak Spanish at home 2,621 60.8% Speak English very well1,688 39.2% Speak English less than very well10.6% of residents speak other language at home 2,720 62.7% Speak English very well1,618 37.3% Speak English less than very well
English speakers - Born in the United States 95.2% of residents of West Babylon speak English at home.
3.4% of residents speak Spanish at home 74 100.0% Speak English very well1.6% of residents speak other language at home 36 100.0% Speak English very well
English speakers - Native, born elsewhere 49.2% of residents of West Babylon speak English at home.
32.0% of residents speak Spanish at home 213 57.7% Speak English very well156 42.3% Speak English less than very well11.5% of residents speak other language at home 133 100.0% Speak English less than very well
English speakers - Foreign-born 25.7% of residents of West Babylon speak English at home.
37.4% of residents speak Spanish at home 1,217 47.7% Speak English very well1,333 52.3% Speak English less than very well34.6% of residents speak other language at home 1,145 48.6% Speak English very well1,211 51.4% Speak English less than very well
White (Caucasian) - Speak only English Native:
95.0% (24,474)Foreign-born:
20.5% (276)
White (Caucasian) - Speak another language Native:
5.1% (1,306)Foreign-born:
76.7% (1,032)
Black or African American - Speak only English Native:
88.5% (2,906)Foreign-born:
69.4% (1,306)
Black or African American - Speak another language Native:
11.5% (378)Foreign-born:
33.6% (632)
American Indian / Alaska Native - Speak another language Native:
11.3% (8)Foreign-born:
100.0% (23)
Asian - Speak only English Native:
48.1% (130)Foreign-born:
9.7% (42)
Asian - Speak another language Native:
51.4% (139)Foreign-born:
91.5% (397)
Other race - Speak only English Native:
53.0% (1,266)Foreign-born:
11.3% (249)
Other race - Speak another language Native:
48.6% (1,162)Foreign-born:
87.8% (1,930)
Two or more races - Speak only English Native:
76.1% (1,535)Foreign-born:
10.3% (111)
Two or more races - Speak another language Native:
24.2% (489)Foreign-born:
89.9% (967)
White alone - Speak only English Native:
94.2% (23,790)Foreign-born:
19.4% (276)
White alone - Speak another language Native:
5.9% (1,500)Foreign-born:
80.5% (1,143)
Hispanic or Latino - Speak only English Native:
63.6% (2,673)Foreign-born:
5.8% (165)
Hispanic or Latino - Speak another language Native:
37.3% (1,567)Foreign-born:
94.3% (2,667)
Foreign-born residents in West Babylon 6,279 residents are foreign born (10.1% Latin America , 2.5% Europe , 2.0% Asia ).
This city:
14.7%New York:
22.6%
Marital status for residents in West Babylon Marital status - White (Caucasian) population 15 years and over
Males 39.4% Never married45.0% Now married1.9% Separated4.5% Widowed9.1% DivorcedFemales 30.5% Never married44.0% Now married1.2% Separated12.2% Widowed12.2% DivorcedWomen who gave birth in the past 12 months Now married:
65.3% (222)Unmarried:
34.7% (118)
Women who did not give birth in the past 12 months Now married:
37.7% (1,904)Unmarried:
62.3% (3,148)
Marital status - Black or African American population 15 years and over
Males 43.7% Never married49.1% Now married1.6% Separated0.0% Widowed5.6% DivorcedFemales 43.3% Never married39.3% Now married2.8% Separated7.7% Widowed6.8% DivorcedWomen who gave birth in the past 12 months Now married:
100.0% (56)Unmarried:
0.0% (0)
Women who did not give birth in the past 12 months Now married:
29.2% (399)Unmarried:
70.8% (967)
Marital status - American Indian / Alaska Native population 15 years and over
Males 25.0% Never married40.6% Now married0.0% Separated0.0% Widowed34.4% DivorcedFemales 11.8% Never married0.0% Now married0.0% Separated88.2% Widowed0.0% DivorcedWomen who did not give birth in the past 12 months Now married:
0.0% (0)Unmarried:
100.0% (37)
Marital status - Asian population 15 years and over
Males 39.7% Never married47.5% Now married0.0% Separated0.0% Widowed12.8% DivorcedFemales 14.1% Never married66.1% Now married0.0% Separated13.0% Widowed6.9% DivorcedWomen who gave birth in the past 12 months Now married:
100.0% (15)Unmarried:
0.0% (0)
Women who did not give birth in the past 12 months Now married:
66.4% (97)Unmarried:
33.6% (49)
Marital status - Other race population 15 years and over
Males 39.2% Never married44.0% Now married3.9% Separated0.4% Widowed12.6% DivorcedFemales 35.6% Never married39.2% Now married4.5% Separated12.0% Widowed8.5% DivorcedWomen who gave birth in the past 12 months Now married:
100.0% (124)Unmarried:
0.0% (0)
Women who did not give birth in the past 12 months Now married:
33.7% (424)Unmarried:
66.3% (834)
Marital status - Two or more races population 15 years and over
Males 29.1% Never married61.2% Now married3.5% Separated0.0% Widowed6.1% DivorcedFemales 25.9% Never married45.0% Now married6.3% Separated3.3% Widowed19.5% DivorcedWomen who gave birth in the past 12 months Now married:
100.0% (60)Unmarried:
0.0% (0)
Women who did not give birth in the past 12 months Now married:
41.8% (285)Unmarried:
58.2% (398)
Marital status - White alone, not Hispanic / Latino population 15 years and over
Males 39.7% Never married44.6% Now married1.6% Separated4.7% Widowed9.5% DivorcedFemales 30.0% Never married44.1% Now married0.7% Separated12.4% Widowed12.8% DivorcedWomen who gave birth in the past 12 months Now married:
59.5% (182)Unmarried:
40.5% (124)
Women who did not give birth in the past 12 months Now married:
37.5% (1,869)Unmarried:
62.5% (3,120)
Marital status - Hispanic or Latino population 15 years and over
Males 35.6% Never married50.4% Now married5.1% Separated0.6% Widowed8.3% DivorcedFemales 31.2% Never married42.0% Now married6.4% Separated9.7% Widowed10.8% DivorcedWomen who gave birth in the past 12 months Now married:
97.8% (182)Unmarried:
2.2% (4)
Women who did not give birth in the past 12 months Now married:
38.9% (666)Unmarried:
61.1% (1,048)
Ancestries in West Babylon
4,838 27.0% Italian2,137 11.9% Irish810 4.5% Jamaican714 4.0% Polish614 3.4% German594 3.3% Haitian564 3.2% American458 2.6% Turkish229 1.3% Trinidadian and Tobagonian223 1.2% English168 0.9% European124 0.7% Russian106 0.6% Eastern European99 0.6% Guyanese96 0.5% Norwegian67 0.4% Greek56 0.3% Finnish53 0.3% Brazilian47 0.3% Slovene45 0.3% Dutch42 0.2% Austrian42 0.2% Czechoslovakian42 0.2% Ukrainian41 0.2% Ghanaian34 0.2% Scotch-Irish33 0.2% Slovak27 0.2% African27 0.2% Swiss27 0.2% French25 0.1% Scottish24 0.1% French Canadian22 0.1% Scandinavian16 0.09% Lithuanian16 0.09% Swedish12 0.07% Portuguese12 0.07% Bahamian11 0.06% Ugandan8 0.04% Romanian8 0.04% Hungarian7 0.04% Belizean5 0.03% Australian5 0.03% Czech3 0.02% Armenian
Geographical mobility in West Babylon Same house 1 year ago 26,040 94.1% White (Caucasian)4,980 91.7% Black or African American85 97.2% American Indian / Alaska Native699 94.3% Asian3,852 82.2% Other race2,911 85.9% Two or more races25,581 93.7% White alone, not Hispanic / Latino6,500 87.2% Hispanic or LatinoMoved within same county 1,152 4.2% White / Caucasian240 4.4% Black or African American441 9.4% Other race365 10.8% Two or more races1,252 4.6% White alone, not Hispanic / Latino545 7.3% Hispanic or LatinoMoved within same state 320 1.2% White / Caucasian133 2.4% Black or African American5 5.7% American Indian / Alaska Native40 5.4% Asian499 10.7% Other race76 2.2% Two or more races276 1.0% White alone, not Hispanic / Latino477 6.4% Hispanic or LatinoMoved from different state 151 0.5% White / Caucasian33 0.6% Black or African American9 1.3% Asian159 0.6% White alone, not Hispanic / LatinoMoved from abroad 10 0.0% White13 0.0% White alone, not Hispanic / Latino
Children Nativity (place of birth) in West Babylon
Children under 6 years - Living with two parents Both parents native 922 100.0% NativeBoth parents foreign-born 140 100.0% NativeOne native, one foreign-born parent 289 100.0% NativeChildren under 6 years - Living with one parent Native parent 515 100.0% NativeForeign-born parent 250 100.0% NativeChildren 6 to 17 years - Living with two parents Both parents native 1,752 99.7% Native6 0.3% Foreign-bornBoth parents foreign-born 520 78.2% Native145 21.8% Foreign-bornOne native, one foreign-born parent 808 97.3% Native23 2.7% Foreign-bornChildren 6 to 17 years - Living with one parent Native parent 1,354 100.0% NativeForeign-born parent 350 60.6% Native227 39.4% Foreign-born
Grandparents responsible for own grandchildren in West Babylon
Grandparents (30 to 59 years) White / Caucasian 70 25.2% Responsible for grandchildren208 74.8% Not responsible for grandchildrenBlack or African American 47 48.8% Responsible for grandchildren49 51.2% Not responsible for grandchildrenTwo or more races 123 100.0% Not responsible for grandchildrenWhite alone, not Hispanic / Latino 40 16.0% Responsible for grandchildren209 84.0% Not responsible for grandchildrenHispanic or Latino 33 31.2% Responsible for grandchildren73 68.8% Not responsible for grandchildrenGrandparents (60 years and over) White / Caucasian 56 15.9% Responsible for grandchildren293 84.1% Not responsible for grandchildrenBlack or African American 88 100.0% Not responsible for grandchildrenTwo or more races 29 38.9% Responsible for grandchildren46 61.1% Not responsible for grandchildrenWhite alone, not Hispanic / Latino 67 18.0% Responsible for grandchildren305 82.0% Not responsible for grandchildrenHispanic or Latino 10 17.9% Responsible for grandchildren45 82.1% Not responsible for grandchildren