Races in Whitehall, West Virginia (WV) Detailed Stats
Ancestries, Foreign-born residents, place of birth

Recent posts about races in Whitehall, West Virginia on our local forum with over 2,400,000 registered users:
 | Moving to Clarksburg? (41 replies) |
| Suncrest Town Center (12 replies) |
| Considering a job in Fairmont, WV on Technology Drive (12 replies) |
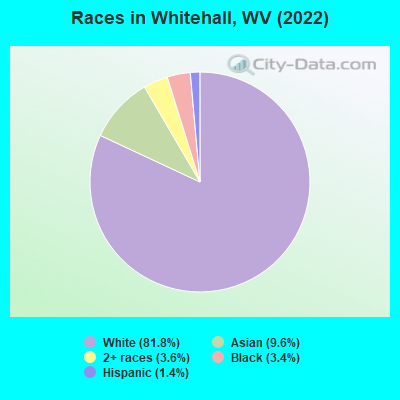
According to 2022 data, the most numerous races in Whitehall, WV are White alone (829 residents), Two or more races (36 residents), and Black alone (34 residents). 98.8% of Whitehall residents speak English at home. 2.5% of Whitehall, WV residents are foreign-born (1.3% born in Asia, 1.0% born in Latin America), which is 59.4% greater than the foreign-born rate of 1.0% across the entire state of West Virginia.
Race distribution in Whitehall

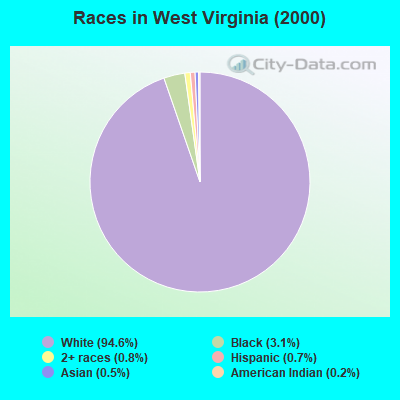
2000
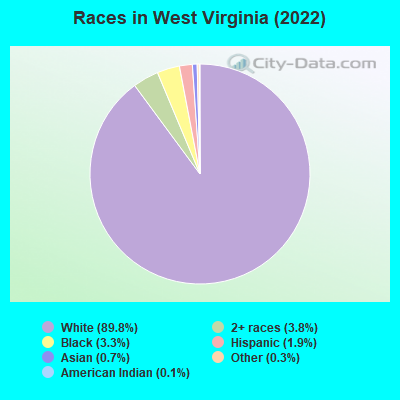
2022

- 1,709,96694.6%White alone
- 56,8253.1%Black alone
- 14,9830.8%Two or more races
- 12,2790.7%Hispanic
- 9,3560.5%Asian alone
- 3,4560.2%American Indian alone
- 1,1440.06%Other race alone
- 3350.02%Native Hawaiian and Other
Pacific Islander alone
-
- 1,594,12889.8%White alone
- 66,9323.8%Two or more races
- 59,3903.3%Black alone
- 34,3431.9%Hispanic
- 13,1340.7%Asian alone
- 5,2380.3%Other race alone
- 1,8800.1%American Indian alone
- 1110.01%Native Hawaiian and Other
Pacific Islander alone
Income and house value in Whitehall
- Median household income in 2022
- $69,187White non-Hispanic householders
- Median 2022 house value
- $241,498White Non-Hispanic householders
- $355,525Two or more races householders
Household income for White non-Hispanic householders

Household income for Black householders

Household income for Asian householders

Household income for Two or more races householders

Median age by race in Whitehall
- 36.3Median age for White residents
- 31.8Males
- 36.5Females
- 22.8Median age for Black or African American residents
- 24.8Males
- 3.1Females
- -580,534,021.8Median age for American Indian / Alaska Native residents
- -513,227,512.7Males
- -723,367,696.9Females
- 33.4Median age for Asian residents
- 20.1Males
- 80.4Females
- -827,078,733.5Median age for Native Hawaiian / Pacific Islander residents
- -668,724,279.2Males
- -670,599,802.7Females
- -746,478,872.5Median age for Other race residents
- -764,285,713.5Males
- -712,172,923.1Females
- 28.7Median age for Two or more races residents
- 27.4Males
- -902,606,309.1Females
- 36.1Median age for White alone residents
- 31.2Males
- 36.4Females
- -690,140,844.4Median age for Hispanic or Latino residents
- -724,310,776.2Males
- -675,585,283.6Females
Owner/renter occupied households by race in Whitehall
- House owners and renters - White residents
- 19253.4%Owner occupied
- 16846.6%Renter occupied
- House owners and renters - Black or African American residents
- 7100.0%Owner occupied
- House owners and renters - Asian residents
- 13100.0%Owner occupied
- House owners and renters - Two or more races residents
- 514.8%Owner occupied
- 2685.2%Renter occupied
- House owners and renters - White alone residents
- 19353.5%Owner occupied
- 16846.5%Renter occupied
Language usage in Whitehall
- English speakers - Total
- 98.8% of residents of Whitehall speak English at home.
- 0.9% of residents speak other language at home
- 9100.0%Speak English very well
- English speakers - Born in the United States
- 95.7% of residents of Whitehall speak English at home.
- 3.2% of residents speak other language at home
- 8100.0%Speak English very well
- English speakers - Native, born elsewhere
- 96.6% of residents of Whitehall speak English at home.
All residents speak only English at home
Black or African American - Speak only English
| Native: | 100.0% (12) |
| Foreign-born: | 88.1% (12) |
Asian - Speak only English
| Native: | 97.5% (80) |
| Foreign-born: | 100.0% (14) |
Foreign-born residents in Whitehall
25 residents are foreign born (1.3% Asia, 1.0% Latin America).
| This city: | 2.5% |
| West Virginia: | 1.6% |


Marital status for residents in Whitehall
Marital status - White (Caucasian) population 15 years and over
- Males
- 30.7%Never married
- 51.0%Now married
- 3.8%Separated
- 0.0%Widowed
- 14.5%Divorced
- Females
- 27.6%Never married
- 44.0%Now married
- 2.6%Separated
- 8.9%Widowed
- 17.0%Divorced
Women who gave birth in the past 12 months
| Now married: | 46.7% (14) |
| Unmarried: | 53.3% (16) |
Women who did not give birth in the past 12 months
| Now married: | 44.8% (87) |
| Unmarried: | 55.2% (108) |
Marital status - Black or African American population 15 years and over
- Males
- 18.7%Never married
- 81.2%Now married
- 0.0%Separated
- 0.0%Widowed
- 0.0%Divorced
- Females
- 0.0%Never married
- 100.0%Now married
- 0.0%Separated
- 0.0%Widowed
- 0.0%Divorced
Women who did not give birth in the past 12 months
| Now married: | 100.0% (6) |
| Unmarried: | 0.0% (0) |
Marital status - Asian population 15 years and over
- Males
- 48.8%Never married
- 27.9%Now married
- 0.0%Separated
- 0.0%Widowed
- 23.3%Divorced
- Females
- 0.0%Never married
- 33.3%Now married
- 0.0%Separated
- 0.0%Widowed
- 66.7%Divorced
Women who did not give birth in the past 12 months
| Now married: | 100.0% (5) |
| Unmarried: | 0.0% (0) |
Marital status - Two or more races population 15 years and over
- Males
- 90.0%Never married
- 0.0%Now married
- 0.0%Separated
- 10.0%Widowed
- 0.0%Divorced
- Females
- 0.0%Never married
- 0.0%Now married
- 0.0%Separated
- 0.0%Widowed
- 100.0%Divorced
Marital status - White alone, not Hispanic / Latino population 15 years and over
- Males
- 31.7%Never married
- 52.7%Now married
- 4.0%Separated
- 0.0%Widowed
- 11.6%Divorced
- Females
- 27.6%Never married
- 44.0%Now married
- 2.6%Separated
- 8.9%Widowed
- 17.0%Divorced
Women who gave birth in the past 12 months
| Now married: | 46.7% (14) |
| Unmarried: | 53.3% (16) |
Women who did not give birth in the past 12 months
| Now married: | 44.8% (88) |
| Unmarried: | 55.2% (108) |
Marital status - Hispanic or Latino population 15 years and over
- Males
- 0.0%Never married
- 0.0%Now married
- 0.0%Separated
- 0.0%Widowed
- 100.0%Divorced
- Females
- 0.0%Never married
- 0.0%Now married
- 0.0%Separated
- 0.0%Widowed
- 100.0%Divorced
Ancestries in Whitehall

- 6715.4%English
- 6515.0%Irish
- 5011.5%Italian
- 4911.3%American
- 255.8%German
- 92.1%Polish
- 92.1%British West Indian
- 61.4%Jamaican
- 30.7%British
- 20.5%Hungarian
- 10.2%European

Geographical mobility in Whitehall

- Same house 1 year ago
- 71087.0%White (Caucasian)
- 617.6%Black or African American
- 9394.5%Asian
- 818.8%Two or more races
- 70186.8%White alone, not Hispanic / Latino
- 1282.7%Hispanic or Latino

-
- Moved within same county
- 789.6%White / Caucasian
- 2356.3%Two or more races
- 799.7%White alone, not Hispanic / Latino

-
- Moved within same state
- 222.7%White / Caucasian
- 44.5%Asian
- 48.4%Two or more races
- 222.7%White alone, not Hispanic / Latino
- 320.1%Hispanic or Latino

-
- Moved from different state
- 1954.8%Black or African American

-
- Moved from abroad
- 1336.7%Black or African American

Children Nativity (place of birth) in Whitehall
Place of birth for residents in Whitehall
![Place of birth for the foreign-born population - Regions]()
- 14Asia
- 14South Eastern Asia
- 11Americas
- 11Latin America
- 11Caribbean

Zip codes: 26554.