Races in Woodward, Oklahoma (OK) Detailed Stats
Data:
Races - White alone (%)
Races - White alone (% change since 2000)
Races - Black alone (%)
Races - Black alone (% change since 2000)
Races - American Indian alone (%)
Races - American Indian alone (% change since 2000)
Races - Asian alone (%)
Races - Asian alone (% change since 2000)
Races - Hispanic (%)
Races - Hispanic (% change since 2000)
Races - Native Hawaiian and Other Pacific Islander alone (%)
Races - Native Hawaiian and Other Pacific Islander alone (% change since 2000)
Races - Two or more races(%)
Races - Two or more races(% change since 2000)
Races - Other race alone (%)
Races - Other race alone (% change since 2000)
Racial diversity
Place of birth - Born in state of residence (%)
Place of birth - Born in state of residence (%) - White
Place of birth - Born in state of residence (%) - Black or African American
Place of birth - Born in state of residence (%) - Asian
Place of birth - Born in state of residence (%) - Hispanic or Latino
Place of birth - Born in state of residence (%) - American Indian and Alaska Native
Place of birth - Born in state of residence (%) - Multirace
Place of birth - Born in state of residence (%) - Other Race
Place of birth - Born in other state (%)
Place of birth - Born in other state (%) - White
Place of birth - Born in other state (%) - Black or African American
Place of birth - Born in other state (%) - Asian
Place of birth - Born in other state (%) - Hispanic or Latino
Place of birth - Born in other state (%) - American Indian and Alaska Native
Place of birth - Born in other state (%) - Multirace
Place of birth - Born in other state (%) - Other Race
Place of birth - Native, outside of US (%)
Place of birth - Native, outside of US (%) - White
Place of birth - Native, outside of US (%) - Black or African American
Place of birth - Native, outside of US (%) - Asian
Place of birth - Native, outside of US (%) - Hispanic or Latino
Place of birth - Native, outside of US (%) - American Indian and Alaska Native
Place of birth - Native, outside of US (%) - Multirace
Place of birth - Native, outside of US (%) - Other Race
Place of birth - Foreign born (%)
Place of birth - Foreign born (%) - White
Place of birth - Foreign born (%) - Black or African American
Place of birth - Foreign born (%) - Asian
Place of birth - Foreign born (%) - Hispanic or Latino
Place of birth - Foreign born (%) - American Indian and Alaska Native
Place of birth - Foreign born (%) - Multirace
Place of birth - Foreign born (%) - Other Race
Residents speaking English at home (%)
Residents speaking English at home - Born in the United States (%)
Residents speaking English at home - Native, born elsewhere (%)
Residents speaking English at home - Foreign born (%)
Residents speaking Spanish at home (%)
Residents speaking Spanish at home - Born in the United States (%)
Residents speaking Spanish at home - Native, born elsewhere (%)
Residents speaking Spanish at home - Foreign born (%)
Residents speaking other language at home (%)
Residents speaking other language at home - Born in the United States (%)
Residents speaking other language at home - Native, born elsewhere (%)
Residents speaking other language at home - Foreign born (%)
Marital status - Never married (%)
Marital status - Now married (%)
Marital status - Separated (%)
Marital status - Widowed (%)
Marital status - Divorced (%)
Ancestries Reported - Arab (%)
Ancestries Reported - Czech (%)
Ancestries Reported - Danish (%)
Ancestries Reported - Dutch (%)
Ancestries Reported - English (%)
Ancestries Reported - French (%)
Ancestries Reported - French Canadian (%)
Ancestries Reported - German (%)
Ancestries Reported - Greek (%)
Ancestries Reported - Hungarian (%)
Ancestries Reported - Irish (%)
Ancestries Reported - Italian (%)
Ancestries Reported - Lithuanian (%)
Ancestries Reported - Norwegian (%)
Ancestries Reported - Polish (%)
Ancestries Reported - Portuguese (%)
Ancestries Reported - Russian (%)
Ancestries Reported - Scotch-Irish (%)
Ancestries Reported - Scottish (%)
Ancestries Reported - Slovak (%)
Ancestries Reported - Subsaharan African (%)
Ancestries Reported - Swedish (%)
Ancestries Reported - Swiss (%)
Ancestries Reported - Ukrainian (%)
Ancestries Reported - United States (%)
Ancestries Reported - Welsh (%)
Ancestries Reported - West Indian (%)
Ancestries Reported - Other (%)
Geographical mobility - Same house 1 year ago (%)
Geographical mobility - Same house 1 year ago (%) - White
Geographical mobility - Same house 1 year ago (%) - Black or African American
Geographical mobility - Same house 1 year ago (%) - Asian
Geographical mobility - Same house 1 year ago (%) - Hispanic or Latino
Geographical mobility - Same house 1 year ago (%) - American Indian and Alaska Native
Geographical mobility - Same house 1 year ago (%) - Multirace
Geographical mobility - Same house 1 year ago (%) - Other Race
Geographical mobility - Moved within same county (%)
Geographical mobility - Moved within same county (%) - White
Geographical mobility - Moved within same county (%) - Black or African American
Geographical mobility - Moved within same county (%) - Asian
Geographical mobility - Moved within same county (%) - Hispanic or Latino
Geographical mobility - Moved within same county (%) - American Indian and Alaska Native
Geographical mobility - Moved within same county (%) - Multirace
Geographical mobility - Moved within same county (%) - Other Race
Geographical mobility - Moved from different county within same state (%)
Geographical mobility - Moved from different county within same state (%) - White
Geographical mobility - Moved from different county within same state (%) - Black or African American
Geographical mobility - Moved from different county within same state (%) - Asian
Geographical mobility - Moved from different county within same state (%) - Hispanic or Latino
Geographical mobility - Moved from different county within same state (%) - American Indian and Alaska Native
Geographical mobility - Moved from different county within same state (%) - Multirace
Geographical mobility - Moved from different county within same state (%) - Other Race
Geographical mobility - Moved from different state (%)
Geographical mobility - Moved from different state (%) - White
Geographical mobility - Moved from different state (%) - Black or African American
Geographical mobility - Moved from different state (%) - Asian
Geographical mobility - Moved from different state (%) - Hispanic or Latino
Geographical mobility - Moved from different state (%) - American Indian and Alaska Native
Geographical mobility - Moved from different state (%) - Multirace
Geographical mobility - Moved from different state (%) - Other Race
Geographical mobility - Moved from abroad (%)
Geographical mobility - Moved from abroad (%) - White
Geographical mobility - Moved from abroad (%) - Black or African American
Geographical mobility - Moved from abroad (%) - Asian
Geographical mobility - Moved from abroad (%) - Hispanic or Latino
Geographical mobility - Moved from abroad (%) - American Indian and Alaska Native
Geographical mobility - Moved from abroad (%) - Multirace
Geographical mobility - Moved from abroad (%) - Other Race
Place of birth for the foreign-born population - Ireland (%)
Place of birth for the foreign-born population - Denmark (%)
Place of birth for the foreign-born population - Norway (%)
Place of birth for the foreign-born population - Sweden (%)
Place of birth for the foreign-born population - United Kingdom (%)
Place of birth for the foreign-born population - England (%)
Place of birth for the foreign-born population - Scotland (%)
Place of birth for the foreign-born population - Other Northern Europe (%)
Place of birth for the foreign-born population - Austria (%)
Place of birth for the foreign-born population - Belgium (%)
Place of birth for the foreign-born population - France (%)
Place of birth for the foreign-born population - Germany (%)
Place of birth for the foreign-born population - Netherlands (%)
Place of birth for the foreign-born population - Switzerland (%)
Place of birth for the foreign-born population - Other Western Europe (%)
Place of birth for the foreign-born population - Greece (%)
Place of birth for the foreign-born population - Italy (%)
Place of birth for the foreign-born population - Portugal (%)
Place of birth for the foreign-born population - Spain (%)
Place of birth for the foreign-born population - Other Southern Europe (%)
Place of birth for the foreign-born population - Albania (%)
Place of birth for the foreign-born population - Belarus (%)
Place of birth for the foreign-born population - Bosnia and Herzegovina (%)
Place of birth for the foreign-born population - Bulgaria (%)
Place of birth for the foreign-born population - Croatia (%)
Place of birth for the foreign-born population - Czechoslovakia (%)
Place of birth for the foreign-born population - Hungary (%)
Place of birth for the foreign-born population - Latvia (%)
Place of birth for the foreign-born population - Lithuania (%)
Place of birth for the foreign-born population - North Macedonia (Macedonia) (%)
Place of birth for the foreign-born population - Moldova (%)
Place of birth for the foreign-born population - Poland (%)
Place of birth for the foreign-born population - Romania (%)
Place of birth for the foreign-born population - Russia (%)
Place of birth for the foreign-born population - Serbia (%)
Place of birth for the foreign-born population - Ukraine (%)
Place of birth for the foreign-born population - Other Eastern Europe (%)
Place of birth for the foreign-born population - China (%)
Place of birth for the foreign-born population - Hong Kong (%)
Place of birth for the foreign-born population - Taiwan (%)
Place of birth for the foreign-born population - Japan (%)
Place of birth for the foreign-born population - Korea (%)
Place of birth for the foreign-born population - Other Eastern Asia (%)
Place of birth for the foreign-born population - Afghanistan (%)
Place of birth for the foreign-born population - Bangladesh (%)
Place of birth for the foreign-born population - India (%)
Place of birth for the foreign-born population - Iran (%)
Place of birth for the foreign-born population - Kazakhstan (%)
Place of birth for the foreign-born population - Nepal (%)
Place of birth for the foreign-born population - Pakistan (%)
Place of birth for the foreign-born population - Sri Lanka (%)
Place of birth for the foreign-born population - Uzbekistan (%)
Place of birth for the foreign-born population - Other South Central Asia (%)
Place of birth for the foreign-born population - Burma (%)
Place of birth for the foreign-born population - Cambodia (%)
Place of birth for the foreign-born population - Indonesia (%)
Place of birth for the foreign-born population - Laos (%)
Place of birth for the foreign-born population - Malaysia (%)
Place of birth for the foreign-born population - Philippines (%)
Place of birth for the foreign-born population - Singapore (%)
Place of birth for the foreign-born population - Thailand (%)
Place of birth for the foreign-born population - Vietnam (%)
Place of birth for the foreign-born population - Other South Eastern Asia (%)
Place of birth for the foreign-born population - Armenia (%)
Place of birth for the foreign-born population - Iraq (%)
Place of birth for the foreign-born population - Israel (%)
Place of birth for the foreign-born population - Jordan (%)
Place of birth for the foreign-born population - Kuwait (%)
Place of birth for the foreign-born population - Lebanon (%)
Place of birth for the foreign-born population - Saudi Arabia (%)
Place of birth for the foreign-born population - Syria (%)
Place of birth for the foreign-born population - Turkey (%)
Place of birth for the foreign-born population - Yemen (%)
Place of birth for the foreign-born population - Other Western Asia (%)
Place of birth for the foreign-born population - Eritrea (%)
Place of birth for the foreign-born population - Ethiopia (%)
Place of birth for the foreign-born population - Kenya (%)
Place of birth for the foreign-born population - Somalia (%)
Place of birth for the foreign-born population - Uganda (%)
Place of birth for the foreign-born population - Zimbabwe (%)
Place of birth for the foreign-born population - Other Eastern Africa (%)
Place of birth for the foreign-born population - Cameroon (%)
Place of birth for the foreign-born population - Congo (%)
Place of birth for the foreign-born population - Democratic Republic of Congo (Zaire) (%)
Place of birth for the foreign-born population - Other Middle Africa (%)
Place of birth for the foreign-born population - Egypt (%)
Place of birth for the foreign-born population - Morocco (%)
Place of birth for the foreign-born population - Sudan (%)
Place of birth for the foreign-born population - Other Northern Africa (%)
Place of birth for the foreign-born population - South Africa (%)
Place of birth for the foreign-born population - Other Southern Africa (%)
Place of birth for the foreign-born population - Cabo Verde (%)
Place of birth for the foreign-born population - Ghana (%)
Place of birth for the foreign-born population - Liberia (%)
Place of birth for the foreign-born population - Nigeria (%)
Place of birth for the foreign-born population - Senegal (%)
Place of birth for the foreign-born population - Sierra Leone (%)
Place of birth for the foreign-born population - Other Western Africa (%)
Place of birth for the foreign-born population - Australia (%)
Place of birth for the foreign-born population - New Zealand (%)
Place of birth for the foreign-born population - Fiji (%)
Place of birth for the foreign-born population - Micronesia (%)
Place of birth for the foreign-born population - Bahamas (%)
Place of birth for the foreign-born population - Barbados (%)
Place of birth for the foreign-born population - Cuba (%)
Place of birth for the foreign-born population - Dominica (%)
Place of birth for the foreign-born population - Dominican Republic (%)
Place of birth for the foreign-born population - Grenada (%)
Place of birth for the foreign-born population - Haiti (%)
Place of birth for the foreign-born population - Jamaica (%)
Place of birth for the foreign-born population - St. Vincent and the Grenadines (%)
Place of birth for the foreign-born population - Trinidad and Tobago (%)
Place of birth for the foreign-born population - West Indies (%)
Place of birth for the foreign-born population - Other Caribbean (%)
Place of birth for the foreign-born population - Belize (%)
Place of birth for the foreign-born population - Costa Rica (%)
Place of birth for the foreign-born population - El Salvador (%)
Place of birth for the foreign-born population - Guatemala (%)
Place of birth for the foreign-born population - Honduras (%)
Place of birth for the foreign-born population - Mexico (%)
Place of birth for the foreign-born population - Nicaragua (%)
Place of birth for the foreign-born population - Panama (%)
Place of birth for the foreign-born population - Other Central America (%)
Place of birth for the foreign-born population - Argentina (%)
Place of birth for the foreign-born population - Bolivia (%)
Place of birth for the foreign-born population - Brazil (%)
Place of birth for the foreign-born population - Chile (%)
Place of birth for the foreign-born population - Colombia (%)
Place of birth for the foreign-born population - Ecuador (%)
Place of birth for the foreign-born population - Guyana (%)
Place of birth for the foreign-born population - Peru (%)
Place of birth for the foreign-born population - Uruguay (%)
Place of birth for the foreign-born population - Venezuela (%)
Place of birth for the foreign-born population - Other South America (%)
Place of birth for the foreign-born population - Canada (%)
Place of birth for the foreign-born population - Other Northern America (%)
Place of birth for the foreign-born population - Other (%)
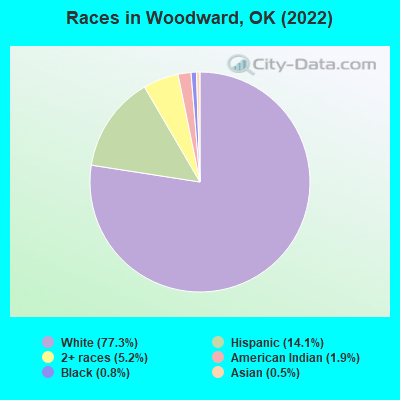
According to 2022 data, the most numerous races in Woodward, OK are White alone (9,446 residents), Hispanic (1,724 residents), and Two or more races (636 residents). 90.4% of Woodward residents speak English at home. 4.5% of Woodward, OK residents are foreign-born (4.0% born in Latin America, 0.5% born in Asia), which is 34.3% less than the foreign-born rate of 6.0% across the entire state of Oklahoma.
Race distribution in Woodward
2000 2022
2,556,368 74.1% White alone 266,158 7.7% American Indian alone 257,981 7.5% Black alone 179,304 5.2% Hispanic 140,249 4.1% Two or more races 46,172 1.3% Asian alone 2,322 0.07% Other race alone 2,100 0.06% Native Hawaiian and Other
2,517,403 62.6% White alone 486,692 12.1% Hispanic 364,453 9.1% Two or more races 273,650 6.8% American Indian alone 268,543 6.7% Black alone 92,672 2.3% Asian alone 10,786 0.3% Other race alone 5,601 0.1% Native Hawaiian and Other
Income and house value in Woodward Median household income in 2022 $53,831 White non-Hispanic householders$84,295 American Indian and Alaska Native householders$25,354 Two or more races householders$26,512 Hispanic or Latino race householdersMedian 2022 house value $174,607 White Non-Hispanic householders$159,068 American Indian or Alaska Native householders $63,570 Asian householders$110,754 Some other race householders$120,925 Two or more races householders$123,185 Hispanic or Latino householders
Median age by race in Woodward
36.5 Median age for White residents36.4 36.3 35.1 Median age for Black or African American residents35.4 -696,165,191.0 32.9 Median age for American Indian / Alaska Native residents25.5 44.6 79.9 Median age for Asian residents60.9 -666,666,666.0 -725,225,224.5 Median age for Native Hawaiian / Pacific Islander residents-675,324,674.6 -767,251,461.2 33.7 Median age for Other race residents17.8 38.8 21.8 Median age for Two or more races residents21.4 22.4 37.9 Median age for White alone residents36.9 38.4 25.0 Median age for Hispanic or Latino residents18.1 29.9
Owner/renter occupied households by race in Woodward
House owners and renters - White residents 3,032 63.7% Owner occupied1,727 36.3% Renter occupiedHouse owners and renters - American Indian / Alaska Native residents 59 62.4% Owner occupied36 37.6% Renter occupiedHouse owners and renters - Asian residents 58 100.0% Owner occupiedHouse owners and renters - Other race residents 26 27.1% Owner occupied70 72.9% Renter occupiedHouse owners and renters - Two or more races residents 140 51.9% Owner occupied130 48.1% Renter occupiedHouse owners and renters - White alone residents 2,911 63.6% Owner occupied1,670 36.4% Renter occupiedHouse owners and renters - Hispanic or Latino residents 230 46.2% Owner occupied267 53.8% Renter occupied
Language usage in Woodward
English speakers - Total 90.4% of residents of Woodward speak English at home.
9.2% of residents speak Spanish at home 612 59.0% Speak English very well425 41.0% Speak English less than very well0.5% of residents speak other language at home 12 21.4% Speak English very well44 78.6% Speak English less than very well
English speakers - Born in the United States 92.8% of residents of Woodward speak English at home.
7.1% of residents speak Spanish at home 266 100.0% Speak English very well
English speakers - Native, born elsewhere 97.3% of residents of Woodward speak English at home.
English speakers - Foreign-born 5.3% of residents of Woodward speak English at home.
87.5% of residents speak Spanish at home 138 28.9% Speak English very well339 71.1% Speak English less than very well8.3% of residents speak other language at home 45 100.0% Speak English less than very well
White (Caucasian) - Speak only English Native:
97.1% (8,840)Foreign-born:
3.7% (6)
White (Caucasian) - Speak another language Native:
2.7% (247)Foreign-born:
81.7% (139)
Asian - Speak only English Native:
99.7% (3)Foreign-born:
15.5% (8)
Other race - Speak another language Native:
81.3% (185)Foreign-born:
100.0% (168)
Two or more races - Speak only English Native:
95.8% (863)Foreign-born:
26.3% (20)
White alone - Speak only English Native:
99.3% (8,750)Foreign-born:
100.0% (7)
Hispanic or Latino - Speak only English Native:
47.8% (456)Foreign-born:
3.4% (17)
Hispanic or Latino - Speak another language Native:
52.0% (496)Foreign-born:
96.3% (487)
Foreign-born residents in Woodward 546 residents are foreign born (4.0% Latin America , 0.5% Asia ).
This city:
4.5%Oklahoma:
6.1%
Marital status for residents in Woodward Marital status - White (Caucasian) population 15 years and over
Males 29.2% Never married48.4% Now married0.5% Separated5.7% Widowed16.2% DivorcedFemales 25.2% Never married42.2% Now married1.4% Separated13.6% Widowed17.6% DivorcedWomen who gave birth in the past 12 months Now married:
73.4% (221)Unmarried:
26.6% (80)
Women who did not give birth in the past 12 months Now married:
40.2% (821)Unmarried:
59.8% (1,219)
Marital status - Black or African American population 15 years and over
Males 84.9% Never married0.0% Now married0.0% Separated0.0% Widowed15.1% DivorcedFemales 100.0% Never married0.0% Now married0.0% Separated0.0% Widowed0.0% DivorcedWomen who did not give birth in the past 12 months Now married:
0.0% (0)Unmarried:
100.0% (4)
Marital status - American Indian / Alaska Native population 15 years and over
Males 77.1% Never married17.7% Now married0.0% Separated0.0% Widowed5.2% DivorcedFemales 10.4% Never married72.6% Now married0.0% Separated0.9% Widowed16.0% DivorcedWomen who did not give birth in the past 12 months Now married:
84.1% (59)Unmarried:
15.9% (11)
Marital status - Asian population 15 years and over
Males 25.0% Never married75.0% Now married0.0% Separated0.0% Widowed0.0% DivorcedFemales 0.0% Never married0.0% Now married0.0% Separated0.0% Widowed100.0% DivorcedMarital status - Other race population 15 years and over
Males 88.2% Never married6.5% Now married0.0% Separated5.4% Widowed0.0% DivorcedFemales 44.9% Never married20.5% Now married22.2% Separated0.0% Widowed12.5% DivorcedWomen who did not give birth in the past 12 months Now married:
42.6% (87)Unmarried:
57.4% (117)
Marital status - Two or more races population 15 years and over
Males 60.4% Never married22.4% Now married7.3% Separated1.9% Widowed8.0% DivorcedFemales 50.3% Never married25.2% Now married0.0% Separated0.0% Widowed24.5% DivorcedWomen who did not give birth in the past 12 months Now married:
9.6% (15)Unmarried:
90.4% (139)
Marital status - White alone, not Hispanic / Latino population 15 years and over
Males 28.8% Never married48.6% Now married0.5% Separated6.1% Widowed16.0% DivorcedFemales 24.2% Never married43.0% Now married0.1% Separated14.8% Widowed17.9% DivorcedWomen who gave birth in the past 12 months Now married:
57.7% (113)Unmarried:
42.3% (83)
Women who did not give birth in the past 12 months Now married:
42.3% (807)Unmarried:
57.7% (1,100)
Marital status - Hispanic or Latino population 15 years and over
Males 58.8% Never married25.6% Now married0.0% Separated1.0% Widowed14.5% DivorcedFemales 42.8% Never married24.8% Now married16.0% Separated0.0% Widowed16.4% DivorcedWomen who gave birth in the past 12 months Now married:
100.0% (127)Unmarried:
0.0% (0)
Women who did not give birth in the past 12 months Now married:
25.8% (128)Unmarried:
74.2% (368)
Ancestries in Woodward
1,140 20.8% American912 16.7% English481 8.8% German193 3.5% European138 2.5% Italian126 2.3% Irish57 1.0% Czech47 0.9% French40 0.7% Scotch-Irish33 0.6% Welsh29 0.5% Czechoslovakian27 0.5% Scottish12 0.2% Polish9 0.2% Swedish4 0.07% Dutch4 0.07% Norwegian
Children Nativity (place of birth) in Woodward
Children under 6 years - Living with two parents Both parents native 350 100.0% NativeOne native, one foreign-born parent 49 100.0% NativeChildren under 6 years - Living with one parent Native parent 512 100.0% NativeForeign-born parent 28 100.0% NativeChildren 6 to 17 years - Living with two parents Both parents native 999 100.0% NativeBoth parents foreign-born 68 100.0% NativeOne native, one foreign-born parent 186 100.0% NativeChildren 6 to 17 years - Living with one parent Native parent 346 100.0% NativeForeign-born parent 234 49.9% Native235 50.1% Foreign-born
Place of birth for residents in Woodward 484 Americas484 Latin America484 Central America54 Asia54 Eastern Asia54 China6 Europe6 Northern Europe
Grandparents responsible for own grandchildren in Woodward
Grandparents (30 to 59 years) White / Caucasian 46 100.0% Responsible for grandchildrenAmerican Indian / Alaska Native 17 100.0% Responsible for grandchildrenOther race 73 100.0% Responsible for grandchildrenWhite alone, not Hispanic / Latino 48 100.0% Responsible for grandchildrenHispanic or Latino 76 100.0% Responsible for grandchildrenGrandparents (60 years and over) White / Caucasian 60 87.0% Responsible for grandchildren9 13.0% Not responsible for grandchildrenWhite alone, not Hispanic / Latino 60 86.5% Responsible for grandchildren9 13.5% Not responsible for grandchildren