Work and Jobs in Hurst, Texas (TX) Detailed Stats
Occupations, Industries, Unemployment, Workers, Commute
Settings
X


Recent posts about work in Hurst, Texas on our local forum with over 2,400,000 registered users:
 | Judge Hidalgo announces $2.6 million program to fight crime in unincorporated areas of Harris County (81 replies) |
| Is Hurst a good place to grow family? (6 replies) |
| Southlake subdivisions (27 replies) |
| I'm an idiot. Thought that a 3.5% down payment was all I needed. (79 replies) |
| Relocating, job in Hurst, TX (19 replies) |
| Jobs in DFW (8 replies) |
Latest news about work in Hurst, TX collected exclusively by city-data.com from local newspapers, TV, and radio stations
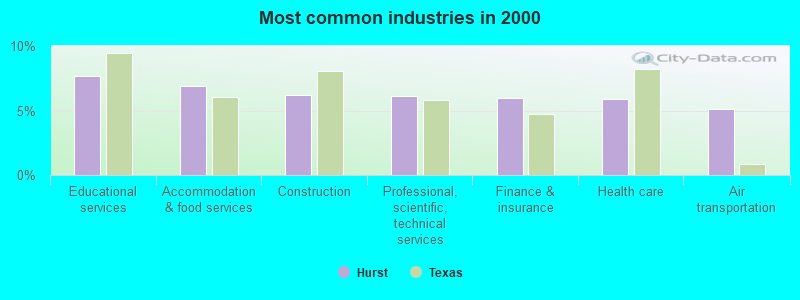
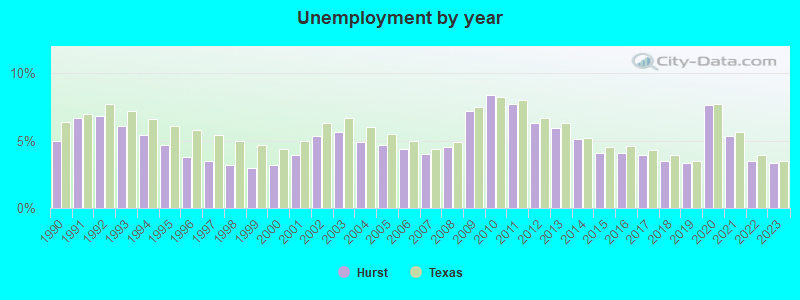
The unemployment rate in 2023 in Hurst, TX was 3.3%, which was 6.1% less than the unemployment rate of 3.5% across the entire state of Texas. Compared to the unemployment rate of 5.9% in 2013, this represents a decrease of 78.8%. The most common industries in Hurst are: Educational services (7.7% of civilian employees), Accommodation & food services (6.9% of civilian employees), Construction (6.2% of civilian employees). 82.6% of workers work in Tarrant County and 12.1% of all workers work at home. 74.2% of workers are employees of private companies, which is 6.2% greater than the rate of 69.6% across the entire state of Texas.
Whole page based on the data from 2000 / 2022 when the population of Hurst, Texas was 36,273 / 40,825
Whole page based on the data from 2000 / 2022 when the population of Hurst, Texas was 36,273 / 40,825
Most common industries
Most common industries | |||
|---|---|---|---|
Industry | All | Males | Females |
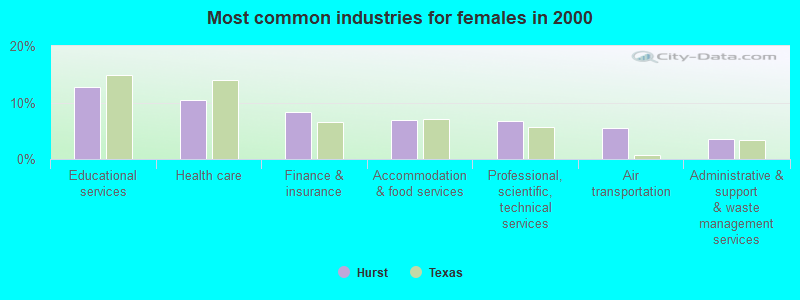
| Educational services | 7.7% (1,450) | 3.3% (334) | 12.7% (1,116) |
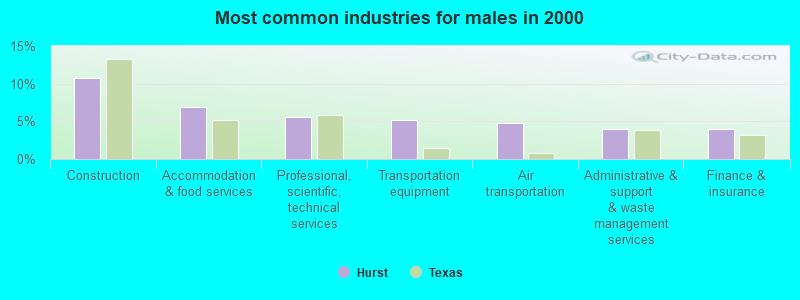
| Accommodation and food services | 6.9% (1,293) | 6.8% (689) | 6.9% (604) |
| Construction | 6.2% (1,166) | 10.8% (1,084) | 0.9% (82) |
| Professional, scientific, and technical services | 6.1% (1,155) | 5.6% (559) | 6.8% (596) |
| Finance and insurance | 6.0% (1,131) | 3.9% (394) | 8.4% (737) |
| Health care | 5.9% (1,117) | 2.0% (205) | 10.4% (912) |
| Air transportation | 5.1% (970) | 4.8% (487) | 5.5% (483) |
| Administrative and support and waste management services | 3.8% (708) | 3.9% (396) | 3.6% (312) |
| Transportation equipment | 3.4% (637) | 5.2% (526) | 1.3% (111) |
| Real estate and rental and leasing | 3.0% (572) | 2.9% (292) | 3.2% (280) |
| Broadcasting and telecommunications | 2.8% (530) | 3.2% (320) | 2.4% (210) |
| Public administration | 2.7% (502) | 2.9% (294) | 2.4% (208) |
| Department and other general merchandise stores | 2.2% (415) | 1.2% (123) | 3.3% (292) |
| Food and beverage stores | 2.0% (383) | 2.1% (214) | 1.9% (169) |
| Other transportation, and support activities, and couriers | 2.0% (376) | 3.1% (310) | 0.8% (66) |
| Arts, entertainment, and recreation | 2.0% (371) | 1.9% (192) | 2.0% (179) |
| Repair and maintenance | 1.8% (335) | 2.6% (266) | 0.8% (69) |
| Religious, grantmaking, civic, professional, and similar organizations | 1.7% (317) | 1.2% (122) | 2.2% (195) |
| Computer and electronic products | 1.6% (309) | 1.9% (187) | 1.4% (122) |
| Social assistance | 1.5% (279) | 0.3% (34) | 2.8% (245) |
| Publishing, and motion picture and sound recording industries | 1.4% (266) | 1.6% (161) | 1.2% (105) |
| Truck transportation | 1.4% (265) | 2.3% (230) | 0.4% (35) |
| Radio, TV, and computer stores | 1.4% (264) | 1.7% (169) | 1.1% (95) |
| Personal and laundry services | 1.3% (253) | 0.4% (44) | 2.4% (209) |
| Motor vehicle and parts dealers | 1.3% (236) | 2.2% (217) | 0.2% (19) |
| Miscellaneous manufacturing | 1.0% (193) | 1.3% (128) | 0.7% (65) |
| Metal and metal products | 0.9% (175) | 1.6% (163) | 0.1% (12) |
| Printing and related support activities | 0.9% (169) | 1.1% (106) | 0.7% (63) |
| Machinery | 0.9% (168) | 1.0% (100) | 0.8% (68) |
| U. S. Postal service | 0.7% (135) | 0.8% (82) | 0.6% (53) |
| Building material and garden equipment and supplies dealers | 0.7% (131) | 1.1% (108) | 0.3% (23) |
| Sporting goods, camera, and hobby and toy stores | 0.7% (129) | 0.2% (19) | 1.3% (110) |
| Data processing, libraries, and other information services | 0.6% (120) | 0.7% (66) | 0.6% (54) |
| Clothing and accessories, including shoe, stores | 0.6% (119) | 0.4% (44) | 0.9% (75) |
| Plastics and rubber products | 0.6% (110) | 0.8% (84) | 0.3% (26) |
| Professional and commercial equipment and supplies merchant wholesalers | 0.6% (109) | 0.7% (70) | 0.4% (39) |
| Groceries and related products merchant wholesalers | 0.6% (106) | 0.6% (64) | 0.5% (42) |
| Food | 0.5% (91) | 0.7% (68) | 0.3% (23) |
| Furniture and home furnishings, and household appliance stores | 0.5% (89) | 0.4% (43) | 0.5% (46) |
| Utilities | 0.5% (89) | 0.7% (66) | 0.3% (23) |
| Other direct selling establishments | 0.5% (88) | 0.4% (38) | 0.6% (50) |
| Rail transportation | 0.4% (83) | 0.7% (70) | 0.1% (13) |
| Mining, quarrying, and oil and gas extraction | 0.4% (80) | 0.6% (65) | 0.2% (15) |
| Electrical and electronic goods merchant wholesalers | 0.4% (71) | 0.6% (62) | 0.1% (9) |
| Chemicals | 0.4% (70) | 0.5% (47) | 0.3% (23) |
| Drugs, sundries, and chemical and allied products merchant wholesalers | 0.4% (68) | 0.3% (30) | 0.4% (38) |
| Machinery, equipment, and supplies merchant wholesalers | 0.4% (68) | 0.6% (57) | 0.1% (11) |
| Used merchandise, gift, novelty, and souvenir, and other miscellaneous stores | 0.4% (66) | 0.2% (16) | 0.6% (50) |
| Gasoline stations | 0.4% (66) | 0.4% (37) | 0.3% (29) |
| Electronic shopping and mail-order houses | 0.3% (59) | 0.4% (39) | 0.2% (20) |
| Petroleum and petroleum products merchant wholesalers | 0.3% (55) | 0.2% (24) | 0.4% (31) |
| Health and personal care, except drug, stores | 0.3% (55) | 0.1% (7) | 0.5% (48) |
| Hardware, plumbing and heating equipment, and supplies merchant wholesalers | 0.3% (54) | 0.4% (39) | 0.2% (15) |
| Electrical equipment, appliances, and components | 0.3% (52) | 0.5% (52) | 0.0% (0) |
| Retail florists | 0.3% (51) | 0.2% (25) | 0.3% (26) |
| Paper | 0.3% (51) | 0.5% (46) | 0.1% (5) |
| Private households | 0.3% (50) | 0.0% (0) | 0.6% (50) |
| Motor vehicles, parts and supplies merchant wholesalers | 0.3% (49) | 0.5% (49) | 0.0% (0) |
| Beverage and tobacco products | 0.3% (48) | 0.4% (45) | 0.0% (3) |
| Miscellaneous durable goods merchant wholesalers | 0.2% (45) | 0.3% (35) | 0.1% (10) |
| Miscellaneous nondurable goods merchant wholesalers | 0.2% (41) | 0.2% (20) | 0.2% (21) |
| Nonmetallic mineral products | 0.2% (41) | 0.4% (41) | 0.0% (0) |
| Pharmacies and drug stores | 0.2% (34) | 0.2% (17) | 0.2% (17) |
| Furniture and related product manufacturing | 0.1% (28) | 0.3% (28) | 0.0% (0) |
| Lumber and other construction materials merchant wholesalers | 0.1% (27) | 0.2% (20) | 0.1% (7) |
| Agriculture, forestry, fishing and hunting | 0.1% (26) | 0.3% (26) | 0.0% (0) |
| Warehousing and storage | 0.1% (21) | 0.1% (7) | 0.2% (14) |
| Vending machine operators | 0.1% (21) | 0.2% (16) | 0.1% (5) |
| Office supplies and stationery stores | 0.1% (19) | 0.1% (7) | 0.1% (12) |
| Jewelry, luggage, and leather goods stores | 0.1% (19) | 0.0% (0) | 0.2% (19) |
Unemployment in Hurst
- Unemployment by race in 2022
- Unemployment rate for White non-Hispanic residents
- 2.9%Males
- 2.2%Females
- Unemployment rate for Black residents
- 6.6%Males
- Unemployment rate for Asian residents
- 1.9%Females
- Unemployment rate for other race residents
- 13.3%Males
- Unemployment rate for two or more race residents
- 0.9%Females
- Unemployment rate for Hispanic or Latino residents
- 3.8%Males
- 0.5%Females
- Unemployment by race in 2000
- Unemployment rate for White non-Hispanic residents
- 3.7%Males
- 3.4%Females
- Unemployment rate for Black residents
- 12.4%Males
- 11.9%Females
- Unemployment rate for American Indian and Alaska Native residents
- 10.0%Females
- Unemployment rate for other race residents
- 2.2%Males
- 6.8%Females
- Unemployment rate for two or more race residents
- 7.1%Females
- Unemployment rate for Hispanic or Latino residents
- 3.8%Males
- 5.3%Females
Unemployment in 2023:
| Hurst: | 3.3% |
| Texas: | 3.5% |
Unemployment in 2022:
| Hurst: | 3.5% |
| Texas: | 3.9% |
Unemployment in 2021:
| Hurst: | 5.3% |
| Texas: | 5.6% |
Unemployment in 2020:
| Hurst: | 7.6% |
| Texas: | 7.7% |
Unemployment in 2019:
| Hurst: | 3.3% |
| Texas: | 3.5% |
Unemployment in 2018:
| Hurst: | 3.5% |
| Texas: | 3.9% |
Unemployment in 2017:
| Hurst: | 3.9% |
| Texas: | 4.3% |
Unemployment in 2016:
| Hurst: | 4.1% |
| Texas: | 4.6% |
Unemployment in 2015:
| Hurst: | 4.1% |
| Texas: | 4.5% |
Unemployment in 2014:
| Hurst: | 5.1% |
| Texas: | 5.2% |
Unemployment in 2013:
| Hurst: | 5.9% |
| Texas: | 6.3% |
Unemployment in 2012:
| Hurst: | 6.3% |
| Texas: | 6.7% |
Unemployment in 2011:
| Hurst: | 7.7% |
| Texas: | 8.0% |
Unemployment in 2010:
| Hurst: | 8.4% |
| Texas: | 8.2% |
Unemployment in 2009:
| Hurst: | 7.2% |
| Texas: | 7.5% |
Unemployment in 2008:
| Hurst: | 4.5% |
| Texas: | 4.9% |
Unemployment in 2007:
| Hurst: | 4.0% |
| Texas: | 4.4% |
Unemployment in 2006:
| Hurst: | 4.4% |
| Texas: | 5.0% |
Unemployment in 2005:
| Hurst: | 4.7% |
| Texas: | 5.5% |
Unemployment in 2004:
| Hurst: | 4.9% |
| Texas: | 6.0% |
Unemployment in 2003:
| Hurst: | 5.6% |
| Texas: | 6.7% |
Unemployment in 2002:
| Hurst: | 5.3% |
| Texas: | 6.3% |
Unemployment in 2001:
| Hurst: | 3.9% |
| Texas: | 5.0% |
Unemployment in 2000:
| Hurst: | 3.2% |
| Texas: | 4.4% |
Unemployment in 1999:
| Hurst: | 3.0% |
| Texas: | 4.7% |
Unemployment in 1998:
| Hurst: | 3.2% |
| Texas: | 5.0% |
Unemployment in 1997:
| Hurst: | 3.5% |
| Texas: | 5.4% |
Unemployment in 1996:
| Hurst: | 3.8% |
| Texas: | 5.8% |
Unemployment in 1995:
| Hurst: | 4.7% |
| Texas: | 6.1% |
Unemployment in 1994:
| Hurst: | 5.4% |
| Texas: | 6.6% |
Unemployment in 1993:
| Hurst: | 6.1% |
| Texas: | 7.2% |
Unemployment in 1992:
| Hurst: | 6.8% |
| Texas: | 7.7% |
Unemployment in 1991:
| Hurst: | 6.7% |
| Texas: | 7.0% |
Unemployment in 1990:
| Hurst: | 5.0% |
| Texas: | 6.4% |
Time leaving home to go to work
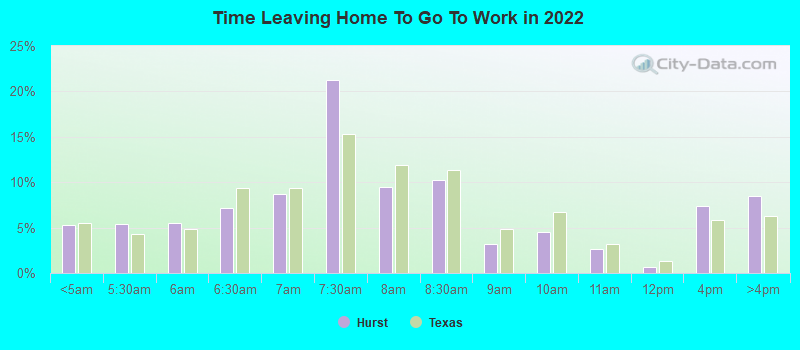
12:00 a.m. to 4:59 a.m.:
| Hurst: | 5.2% (916) |
| Texas: | 5.5% (678,264) |
5:00 a.m. to 5:29 a.m.:
| Hurst: | 5.4% (943) |
| Texas: | 4.3% (525,841) |
5:30 a.m. to 5:59 a.m.:
| Hurst: | 5.5% (965) |
| Texas: | 4.9% (603,953) |
6:00 a.m. to 6:29 a.m.:
| Hurst: | 7.2% (1,253) |
| Texas: | 9.4% (1,155,020) |
6:30 a.m. to 6:59 a.m.:
| Hurst: | 8.7% (1,514) |
| Texas: | 9.3% (1,152,822) |
7:00 a.m. to 7:29 a.m.:
| Hurst: | 21.3% (3,716) |
| Texas: | 15.3% (1,885,477) |
7:30 a.m. to 7:59 a.m.:
| Hurst: | 9.5% (1,654) |
| Texas: | 11.9% (1,469,628) |
8:00 a.m. to 8:29 a.m.:
| Hurst: | 10.3% (1,790) |
| Texas: | 11.3% (1,400,175) |
8:30 a.m. to 8:59 a.m.:
| Hurst: | 3.2% (559) |
| Texas: | 4.9% (599,574) |
9:00 a.m. to 9:59 a.m.:
| Hurst: | 4.5% (790) |
| Texas: | 6.7% (829,367) |
10:00 a.m. to 10:59 a.m.:
| Hurst: | 2.7% (464) |
| Texas: | 3.2% (390,354) |
11:00 a.m. to 11:59 a.m.:
| Hurst: | 0.7% (121) |
| Texas: | 1.3% (162,330) |
12:00 p.m. to 3:59 p.m.:
| Hurst: | 7.4% (1,286) |
| Texas: | 5.8% (720,594) |
4:00 p.m. to 11:59 p.m.:
| Hurst: | 8.4% (1,471) |
| Texas: | 6.3% (777,072) |

<5am:
| Hurst: | 3.3% (612) |
| Texas: | 3.1% (281,361) |
5:30am:
| Hurst: | 2.5% (461) |
| Texas: | 2.9% (262,060) |
6am:
| Hurst: | 4.0% (740) |
| Texas: | 4.4% (403,423) |
6:30am:
| Hurst: | 8.4% (1,547) |
| Texas: | 8.8% (808,876) |
7am:
| Hurst: | 10.3% (1,906) |
| Texas: | 10.7% (976,557) |
7:30am:
| Hurst: | 15.9% (2,948) |
| Texas: | 16.4% (1,500,904) |
8am:
| Hurst: | 15.8% (2,927) |
| Texas: | 16.8% (1,536,308) |
8:30am:
| Hurst: | 11.1% (2,054) |
| Texas: | 10.0% (913,601) |
9am:
| Hurst: | 4.7% (871) |
| Texas: | 4.4% (398,656) |
10am:
| Hurst: | 4.4% (820) |
| Texas: | 5.2% (472,592) |
11am:
| Hurst: | 2.8% (521) |
| Texas: | 2.2% (197,844) |
12pm:
| Hurst: | 0.9% (170) |
| Texas: | 0.9% (86,997) |
4pm:
| Hurst: | 6.2% (1,152) |
| Texas: | 5.5% (503,565) |
>4pm:
| Hurst: | 7.1% (1,316) |
| Texas: | 6.1% (563,107) |

12:00 a.m. to 4:59 a.m. - Males:
| Hurst: | 6.4% (586) |
| Texas: | 7.0% (477,284) |
5:00 a.m. to 5:29 a.m. - Males:
| Hurst: | 5.5% (499) |
| Texas: | 5.8% (394,876) |
5:30 a.m. to 5:59 a.m. - Males:
| Hurst: | 5.2% (475) |
| Texas: | 5.9% (402,788) |
6:00 a.m. to 6:29 a.m. - Males:
| Hurst: | 9.4% (859) |
| Texas: | 10.9% (751,118) |
6:30 a.m. to 6:59 a.m. - Males:
| Hurst: | 11.8% (1,071) |
| Texas: | 9.5% (652,306) |
7:00 a.m. to 7:29 a.m. - Males:
| Hurst: | 18.5% (1,688) |
| Texas: | 14.1% (970,598) |
7:30 a.m. to 7:59 a.m. - Males:
| Hurst: | 8.2% (744) |
| Texas: | 10.2% (696,429) |
8:00 a.m. to 8:29 a.m. - Males:
| Hurst: | 8.9% (806) |
| Texas: | 10.6% (729,041) |
8:30 a.m. to 8:59 a.m. - Males:
| Hurst: | 3.6% (324) |
| Texas: | 4.1% (281,762) |
9:00 a.m. to 9:59 a.m. - Males:
| Hurst: | 3.5% (315) |
| Texas: | 5.8% (401,071) |
10:00 a.m. to 10:59 a.m. - Males:
| Hurst: | 1.1% (97) |
| Texas: | 2.7% (186,469) |
11:00 a.m. to 11:59 a.m. - Males:
| Hurst: | 0.4% (35) |
| Texas: | 1.2% (82,242) |
12:00 p.m. to 3:59 p.m. - Males:
| Hurst: | 8.7% (788) |
| Texas: | 5.8% (397,795) |
4:00 p.m. to 11:59 p.m. - Males:
| Hurst: | 9.5% (865) |
| Texas: | 6.4% (435,950) |

12:00 a.m. to 4:59 a.m. - Females:
| Hurst: | 3.9% (329) |
| Texas: | 3.7% (200,980) |
5:00 a.m. to 5:29 a.m. - Females:
| Hurst: | 5.4% (454) |
| Texas: | 2.4% (130,965) |
5:30 a.m. to 5:59 a.m. - Females:
| Hurst: | 5.4% (455) |
| Texas: | 3.7% (201,165) |
6:00 a.m. to 6:29 a.m. - Females:
| Hurst: | 4.7% (392) |
| Texas: | 7.4% (403,902) |
6:30 a.m. to 6:59 a.m. - Females:
| Hurst: | 5.6% (466) |
| Texas: | 9.1% (500,516) |
7:00 a.m. to 7:29 a.m. - Females:
| Hurst: | 24.4% (2,041) |
| Texas: | 16.7% (914,879) |
7:30 a.m. to 7:59 a.m. - Females:
| Hurst: | 10.9% (912) |
| Texas: | 14.1% (773,199) |
8:00 a.m. to 8:29 a.m. - Females:
| Hurst: | 11.8% (986) |
| Texas: | 12.2% (671,134) |
8:30 a.m. to 8:59 a.m. - Females:
| Hurst: | 2.7% (223) |
| Texas: | 5.8% (317,812) |
9:00 a.m. to 9:59 a.m. - Females:
| Hurst: | 5.8% (482) |
| Texas: | 7.8% (428,296) |
10:00 a.m. to 10:59 a.m. - Females:
| Hurst: | 4.4% (367) |
| Texas: | 3.7% (203,885) |
11:00 a.m. to 11:59 a.m. - Females:
| Hurst: | 1.1% (93) |
| Texas: | 1.5% (80,088) |
12:00 p.m. to 3:59 p.m. - Females:
| Hurst: | 6.0% (500) |
| Texas: | 5.9% (322,799) |
4:00 p.m. to 11:59 p.m. - Females:
| Hurst: | 7.2% (606) |
| Texas: | 6.2% (341,122) |
Travel time to work
Percentage of workers working in this county: 82.6%
Number of people working at home: 2,519 (12.1% of all workers)
Daytime population change due to commuting: -3,289 (-9.1%)
Workers who live and work in this city: 2,875 (15.5%)
Number of people working at home: 2,519 (12.1% of all workers)
Daytime population change due to commuting: -3,289 (-9.1%)
Workers who live and work in this city: 2,875 (15.5%)

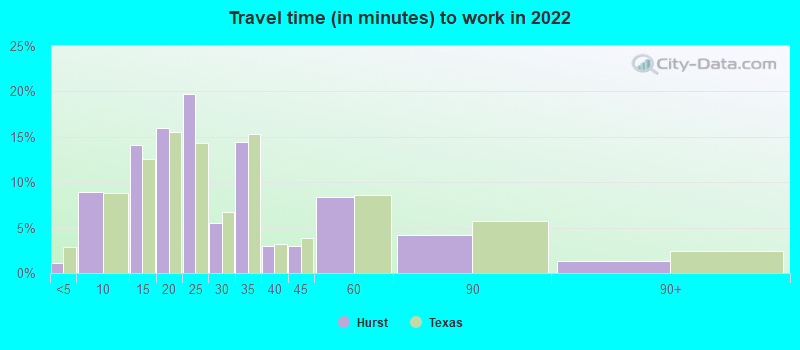

Less than 5 minutes:
| Hurst: | 1.1% (182) |
| Texas: | 2.8% (350,462) |
5 to 9 minutes:
| Hurst: | 8.9% (1,479) |
| Texas: | 8.8% (1,087,762) |
10 to 14 minutes:
| Hurst: | 14.1% (2,350) |
| Texas: | 12.6% (1,550,271) |
15 to 19 minutes:
| Hurst: | 15.9% (2,652) |
| Texas: | 15.6% (1,918,353) |
20 to 24 minutes:
| Hurst: | 19.7% (3,281) |
| Texas: | 14.4% (1,772,079) |
25 to 29 minutes:
| Hurst: | 5.5% (923) |
| Texas: | 6.7% (827,833) |
30 to 34 minutes:
| Hurst: | 14.5% (2,408) |
| Texas: | 15.3% (1,887,878) |
35 to 39 minutes:
| Hurst: | 3.0% (498) |
| Texas: | 3.2% (394,170) |
40 to 44 minutes:
| Hurst: | 3.0% (502) |
| Texas: | 3.9% (476,118) |
45 to 59 minutes:
| Hurst: | 8.4% (1,391) |
| Texas: | 8.6% (1,058,376) |
60 to 89 minutes:
| Hurst: | 4.2% (696) |
| Texas: | 5.7% (706,002) |
90 or more minutes:
| Hurst: | 1.3% (216) |
| Texas: | 2.4% (299,884) |


Less than 5 minutes:
| Hurst: | 2.2% (411) |
| Texas: | 3.0% (277,642) |
5 to 9 minutes:
| Hurst: | 9.4% (1,737) |
| Texas: | 10.3% (942,891) |
10 to 14 minutes:
| Hurst: | 12.4% (2,293) |
| Texas: | 14.4% (1,317,555) |
15 to 19 minutes:
| Hurst: | 14.0% (2,597) |
| Texas: | 16.0% (1,467,945) |
20 to 24 minutes:
| Hurst: | 17.6% (3,261) |
| Texas: | 13.9% (1,276,781) |
25 to 29 minutes:
| Hurst: | 7.6% (1,408) |
| Texas: | 5.3% (482,838) |
30 to 34 minutes:
| Hurst: | 15.5% (2,874) |
| Texas: | 14.3% (1,309,699) |
35 to 39 minutes:
| Hurst: | 2.2% (408) |
| Texas: | 2.4% (219,873) |
40 to 44 minutes:
| Hurst: | 2.4% (442) |
| Texas: | 3.1% (280,916) |
45 to 59 minutes:
| Hurst: | 7.8% (1,453) |
| Texas: | 7.6% (692,006) |
60 to 89 minutes:
| Hurst: | 4.1% (764) |
| Texas: | 4.6% (418,905) |
90 or more minutes:
| Hurst: | 2.1% (397) |
| Texas: | 2.4% (218,800) |

Less than 5 minutes - Males:
| Hurst: | 1.4% (113) |
| Texas: | 2.7% (181,937) |
5 to 9 minutes - Males:
| Hurst: | 6.0% (475) |
| Texas: | 7.6% (522,166) |
10 to 14 minutes - Males:
| Hurst: | 11.3% (898) |
| Texas: | 11.5% (785,572) |
15 to 19 minutes - Males:
| Hurst: | 15.5% (1,224) |
| Texas: | 14.6% (1,001,179) |
20 to 24 minutes - Males:
| Hurst: | 21.7% (1,716) |
| Texas: | 13.9% (950,043) |
25 to 29 minutes - Males:
| Hurst: | 6.0% (473) |
| Texas: | 6.7% (457,259) |
30 to 34 minutes - Males:
| Hurst: | 16.6% (1,312) |
| Texas: | 16.2% (1,110,357) |
35 to 39 minutes - Males:
| Hurst: | 1.9% (147) |
| Texas: | 3.3% (223,512) |
40 to 44 minutes - Males:
| Hurst: | 2.7% (211) |
| Texas: | 4.2% (289,434) |
45 to 59 minutes - Males:
| Hurst: | 8.8% (698) |
| Texas: | 9.3% (639,122) |
60 to 89 minutes - Males:
| Hurst: | 6.2% (491) |
| Texas: | 6.8% (467,154) |
90 or more minutes - Males:
| Hurst: | 1.7% (134) |
| Texas: | 3.1% (211,313) |

Less than 5 minutes - Females:
| Hurst: | 0.8% (72) |
| Texas: | 3.1% (168,525) |
5 to 9 minutes - Females:
| Hurst: | 11.8% (1,039) |
| Texas: | 10.3% (565,596) |
10 to 14 minutes - Females:
| Hurst: | 16.8% (1,476) |
| Texas: | 13.9% (764,699) |
15 to 19 minutes - Females:
| Hurst: | 16.3% (1,434) |
| Texas: | 16.7% (917,174) |
20 to 24 minutes - Females:
| Hurst: | 17.8% (1,565) |
| Texas: | 15.0% (822,036) |
25 to 29 minutes - Females:
| Hurst: | 5.1% (450) |
| Texas: | 6.7% (370,574) |
30 to 34 minutes - Females:
| Hurst: | 12.5% (1,101) |
| Texas: | 14.2% (777,521) |
35 to 39 minutes - Females:
| Hurst: | 4.1% (356) |
| Texas: | 3.1% (170,658) |
40 to 44 minutes - Females:
| Hurst: | 3.4% (298) |
| Texas: | 3.4% (186,684) |
45 to 59 minutes - Females:
| Hurst: | 8.0% (705) |
| Texas: | 7.6% (419,254) |
60 to 89 minutes - Females:
| Hurst: | 2.3% (205) |
| Texas: | 4.4% (238,848) |
90 or more minutes - Females:
| Hurst: | 0.9% (81) |
| Texas: | 1.6% (88,571) |
Means of transportation to work
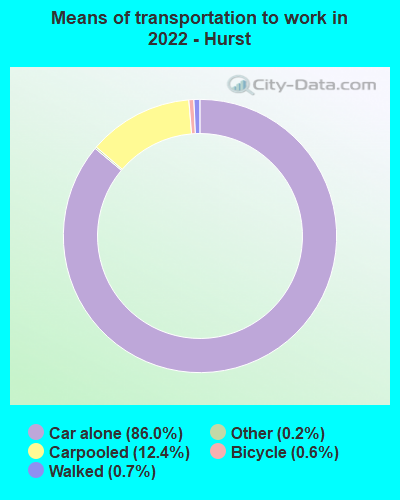

Drove car alone:
| Hurst: | 86.0% (14,997) |
| Texas: | 83.3% (4,557,023) |
Carpooled:
| Hurst: | 12.4% (2,156) |
| Texas: | 11.7% (674,818) |
Bus:
| Hurst: | 0.1% (17) |
| Texas: | 0.9% (50,435) |
Bicycle:
| Hurst: | 0.6% (112) |
| Texas: | 0.2% (7,954) |
Walked:
| Hurst: | 0.7% (126) |
| Texas: | 1.7% (99,911) |
Other means:
| Hurst: | 0.2% (37) |
| Texas: | 2.0% (95,481) |


Drove car alone:
| Hurst: | 83.2% (15,399) |
| Texas: | 77.7% (7,115,590) |
Carpooled:
| Hurst: | 10.7% (1,980) |
| Texas: | 14.5% (1,326,012) |
Streetcar or trolley car:
| Hurst: | 0.1% (15) |
| Texas: | 0.0% (1,669) |
Subway or elevated:
| Hurst: | 0.2% (29) |
| Texas: | 0.0% (2,371) |
Taxicab:
| Hurst: | 0.2% (35) |
| Texas: | 0.1% (6,102) |
Motorcycle:
| Hurst: | 0.4% (70) |
| Texas: | 0.1% (12,068) |
Bicycle:
| Hurst: | 0.3% (60) |
| Texas: | 0.2% (21,551) |
Walked:
| Hurst: | 1.6% (292) |
| Texas: | 1.9% (173,670) |
Other means:
| Hurst: | 0.9% (165) |
| Texas: | 0.9% (86,692) |


Drove car alone - Males:
| Hurst: | 86.4% (7,140) |
| Texas: | 83.6% (4,557,023) |
Carpooled - Males:
| Hurst: | 12.0% (995) |
| Texas: | 11.2% (674,818) |
Bus - Males:
| Hurst: | 0.2% (16) |
| Texas: | 0.8% (50,435) |
Bicycle - Males:
| Hurst: | 0.5% (44) |
| Texas: | 0.3% (7,954) |
Walked - Males:
| Hurst: | 0.8% (63) |
| Texas: | 1.7% (99,911) |
Other means - Males:
| Hurst: | 0.1% (8) |
| Texas: | 2.2% (95,481) |


Drove car alone - Females:
| Hurst: | 85.6% (7,905) |
| Texas: | 83.0% (4,557,023) |
Carpooled - Females:
| Hurst: | 12.7% (1,169) |
| Texas: | 12.3% (674,818) |
Bicycle - Females:
| Hurst: | 0.7% (68) |
| Texas: | 0.1% (7,954) |
Walked - Females:
| Hurst: | 0.7% (64) |
| Texas: | 1.8% (99,911) |
Other means - Females:
| Hurst: | 0.3% (30) |
| Texas: | 1.7% (95,481) |
Private vehicle occupancy

Drove alone:
| Hurst: | 91.6% (15,522) |
| Texas: | 87.6% (10,283,021) |
In 2 person carpool:
| Hurst: | 6.1% (1,031) |
| Texas: | 9.0% (1,052,595) |
In 3 person carpool:
| Hurst: | 2.0% (338) |
| Texas: | 2.1% (244,139) |
In 4 person carpool:
| Hurst: | 0.2% (29) |
| Texas: | 0.8% (92,732) |

Drove alone:
| Hurst: | 88.6% (15,399) |
| Texas: | 84.3% (7,115,590) |
In 2 person carpool:
| Hurst: | 9.2% (1,601) |
| Texas: | 11.6% (982,994) |
In 3 person carpool:
| Hurst: | 1.4% (237) |
| Texas: | 2.4% (201,602) |
In 4 person carpool:
| Hurst: | 0.4% (75) |
| Texas: | 1.0% (83,518) |
In 5-6 person carpool:
| Hurst: | 0.2% (30) |
| Texas: | 0.5% (40,662) |
In 7+ person carpool:
| Hurst: | 0.2% (37) |
| Texas: | 0.2% (17,236) |
Class of workers
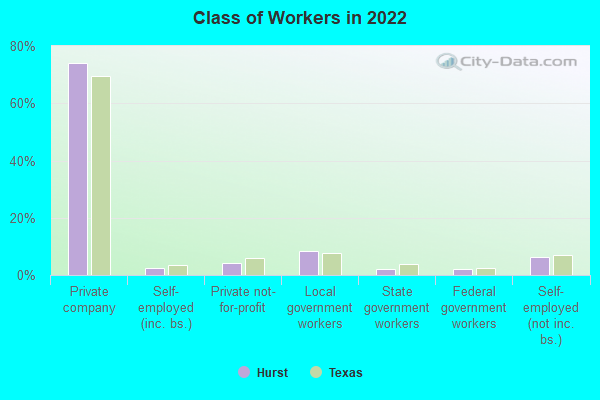
Employee of private company:
| Hurst: | 74.2% (15,717) |
| Texas: | 69.6% (10,139,666) |
Self-employed in own incorporated business:
| Hurst: | 2.6% (556) |
| Texas: | 3.5% (516,446) |
Private not-for-profit wage and salary workers:
| Hurst: | 4.1% (876) |
| Texas: | 6.0% (870,454) |
Local government workers:
| Hurst: | 8.5% (1,811) |
| Texas: | 7.6% (1,109,799) |
State government workers:
| Hurst: | 2.0% (434) |
| Texas: | 3.8% (558,618) |
Federal government workers:
| Hurst: | 2.2% (474) |
| Texas: | 2.5% (357,298) |
Self-employed workers in own not incorporated business:
| Hurst: | 6.3% (1,327) |
| Texas: | 6.8% (998,270) |

Employee of private company:
| Hurst: | 75.7% (14,256) |
| Texas: | 69.6% (6,425,274) |
Self-employed in own incorporated business:
| Hurst: | 2.3% (440) |
| Texas: | 2.7% (250,864) |
Private not-for-profit wage and salary workers:
| Hurst: | 6.5% (1,218) |
| Texas: | 5.7% (526,631) |
Local government workers:
| Hurst: | 5.2% (988) |
| Texas: | 6.6% (608,479) |
State government workers:
| Hurst: | 2.4% (456) |
| Texas: | 5.4% (501,082) |
Federal government workers:
| Hurst: | 2.1% (396) |
| Texas: | 2.6% (237,177) |
Self-employed workers in own not incorporated business:
| Hurst: | 5.5% (1,040) |
| Texas: | 7.1% (653,527) |
Unpaid family workers:
| Hurst: | 0.2% (43) |
| Texas: | 0.3% (31,338) |

Employee of private company - Males:
| Hurst: | 75.5% (8,357) |
| Texas: | 73.1% (5,788,450) |
Self-employed in own incorporated business - Males:
| Hurst: | 3.3% (368) |
| Texas: | 4.2% (332,655) |
Private not-for-profit wage and salary workers - Males:
| Hurst: | 2.2% (244) |
| Texas: | 4.1% (323,476) |
Local government workers - Males:
| Hurst: | 6.5% (717) |
| Texas: | 5.1% (405,467) |
State government workers - Males:
| Hurst: | 1.3% (146) |
| Texas: | 3.0% (236,706) |
Federal government workers - Males:
| Hurst: | 2.3% (257) |
| Texas: | 2.7% (211,629) |
Self-employed workers in own not incorporated business - Males:
| Hurst: | 8.9% (982) |
| Texas: | 7.7% (609,246) |

Employee of private company - Females:
| Hurst: | 72.7% (7,360) |
| Texas: | 65.4% (4,351,216) |
Self-employed in own incorporated business - Females:
| Hurst: | 1.9% (188) |
| Texas: | 2.8% (183,791) |
Private not-for-profit wage and salary workers - Females:
| Hurst: | 6.2% (632) |
| Texas: | 8.2% (546,978) |
Local government workers - Females:
| Hurst: | 10.8% (1,094) |
| Texas: | 10.6% (704,332) |
State government workers - Females:
| Hurst: | 2.8% (288) |
| Texas: | 4.8% (321,912) |
Federal government workers - Females:
| Hurst: | 2.1% (217) |
| Texas: | 2.2% (145,669) |
Self-employed workers in own not incorporated business - Females:
| Hurst: | 3.4% (346) |
| Texas: | 5.8% (389,024) |