Work and Jobs in Sylvania, Pennsylvania (PA) Detailed Stats
Occupations, Industries, Unemployment, Workers, Commute
Settings
X


Recent posts about work in Sylvania, Pennsylvania on our local forum with over 2,400,000 registered users:
 | DuBois and Treasure Lake (32 replies) |
| The Heights (48 replies) |
| Why is the rent in undesirable neighborhoods and subburbs so high? (140 replies) |
| Fantasy Light Rail Map (135 replies) |
| Any "Mayberry" Towns in Pa.? (31 replies) |
| Emporium, PA photo tour (18 replies) |
Latest news about work in Sylvania, PA collected exclusively by city-data.com from local newspapers, TV, and radio stations
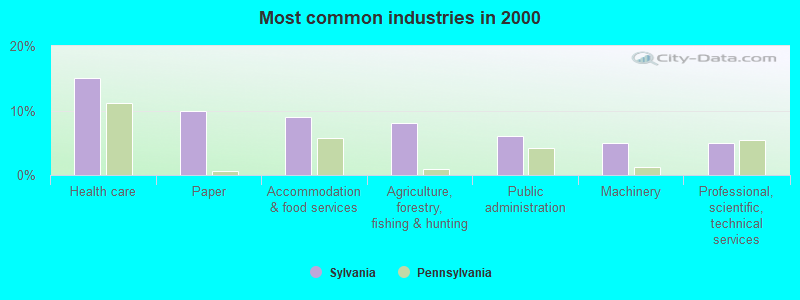
The most common industries in Sylvania are: Health care (15.0% of civilian employees), Paper (10.0% of civilian employees), Accommodation & food services (9.0% of civilian employees). 75.9% of workers work in Bradford County. 64.4% of workers are employees of private companies, which is 5.2% less than the rate of 67.7% across the entire state of Pennsylvania.
Whole page based on the data from 2000 / 2022 when the population of Sylvania, Pennsylvania was 200 / 246
Whole page based on the data from 2000 / 2022 when the population of Sylvania, Pennsylvania was 200 / 246
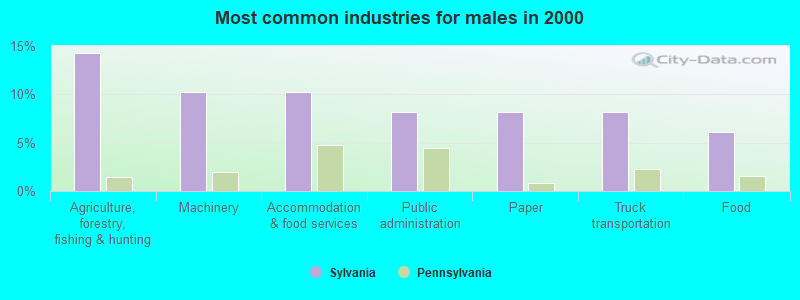
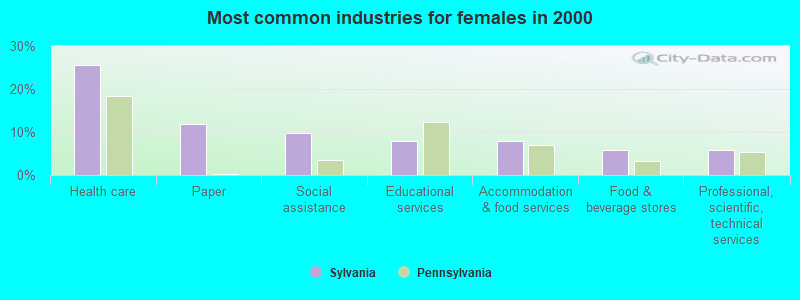
Most common industries
Most common industries | |||
|---|---|---|---|
Industry | All | Males | Females |
| Health care | 15.0% (15) | 4.1% (2) | 25.5% (13) |
| Paper | 10.0% (10) | 8.2% (4) | 11.8% (6) |
| Accommodation and food services | 9.0% (9) | 10.2% (5) | 7.8% (4) |
| Agriculture, forestry, fishing and hunting | 8.0% (8) | 14.3% (7) | 2.0% (1) |
| Public administration | 6.0% (6) | 8.2% (4) | 3.9% (2) |
| Machinery | 5.0% (5) | 10.2% (5) | 0.0% (0) |
| Professional, scientific, and technical services | 5.0% (5) | 4.1% (2) | 5.9% (3) |
| Social assistance | 5.0% (5) | 0.0% (0) | 9.8% (5) |
| Wood products | 4.0% (4) | 4.1% (2) | 3.9% (2) |
| Truck transportation | 4.0% (4) | 8.2% (4) | 0.0% (0) |
| Educational services | 4.0% (4) | 0.0% (0) | 7.8% (4) |
| Food | 3.0% (3) | 6.1% (3) | 0.0% (0) |
| Food and beverage stores | 3.0% (3) | 0.0% (0) | 5.9% (3) |
| Machinery, equipment, and supplies merchant wholesalers | 2.0% (2) | 4.1% (2) | 0.0% (0) |
| Construction | 2.0% (2) | 4.1% (2) | 0.0% (0) |
| Miscellaneous manufacturing | 2.0% (2) | 0.0% (0) | 3.9% (2) |
| Metal and metal products | 2.0% (2) | 4.1% (2) | 0.0% (0) |
| Motor vehicle and parts dealers | 2.0% (2) | 4.1% (2) | 0.0% (0) |
| Radio, TV, and computer stores | 2.0% (2) | 0.0% (0) | 3.9% (2) |
| Administrative and support and waste management services | 2.0% (2) | 0.0% (0) | 3.9% (2) |
| Religious, grantmaking, civic, professional, and similar organizations | 2.0% (2) | 4.1% (2) | 0.0% (0) |
| Private households | 2.0% (2) | 0.0% (0) | 3.9% (2) |
| Recyclable material merchant wholesalers | 1.0% (1) | 2.0% (1) | 0.0% (0) |
Unemployment in Sylvania
- Unemployment by race in 2022
- Unemployment rate for White non-Hispanic residents
- 2.2%Males
- 1.4%Females
- Unemployment by race in 2000
- Unemployment rate for White non-Hispanic residents
- 7.5%Males
- 10.5%Females
Time leaving home to go to work

12:00 a.m. to 4:59 a.m.:
| Sylvania: | 6.0% (5) |
| Pennsylvania: | 5.2% (278,903) |
5:00 a.m. to 5:29 a.m.:
| Sylvania: | 3.5% (3) |
| Pennsylvania: | 3.9% (210,362) |
6:00 a.m. to 6:29 a.m.:
| Sylvania: | 5.7% (5) |
| Pennsylvania: | 9.0% (480,402) |
6:30 a.m. to 6:59 a.m.:
| Sylvania: | 11.3% (10) |
| Pennsylvania: | 10.0% (532,059) |
7:00 a.m. to 7:29 a.m.:
| Sylvania: | 22.6% (19) |
| Pennsylvania: | 13.6% (726,980) |
7:30 a.m. to 7:59 a.m.:
| Sylvania: | 11.3% (10) |
| Pennsylvania: | 11.5% (611,627) |
8:00 a.m. to 8:29 a.m.:
| Sylvania: | 28.1% (24) |
| Pennsylvania: | 11.0% (585,665) |
8:30 a.m. to 8:59 a.m.:
| Sylvania: | 1.1% (1) |
| Pennsylvania: | 5.7% (302,857) |
11:00 a.m. to 11:59 a.m.:
| Sylvania: | 2.3% (2) |
| Pennsylvania: | 1.4% (75,840) |
12:00 p.m. to 3:59 p.m.:
| Sylvania: | 2.3% (2) |
| Pennsylvania: | 7.6% (407,255) |
4:00 p.m. to 11:59 p.m.:
| Sylvania: | 5.7% (5) |
| Pennsylvania: | 6.9% (369,524) |

<5am:
| Sylvania: | 4.0% (4) |
| Pennsylvania: | 3.1% (172,304) |
6am:
| Sylvania: | 6.0% (6) |
| Pennsylvania: | 4.4% (245,004) |
6:30am:
| Sylvania: | 13.0% (13) |
| Pennsylvania: | 8.6% (478,636) |
7am:
| Sylvania: | 15.0% (15) |
| Pennsylvania: | 10.8% (599,808) |
7:30am:
| Sylvania: | 11.0% (11) |
| Pennsylvania: | 13.7% (759,372) |
8am:
| Sylvania: | 24.0% (24) |
| Pennsylvania: | 14.9% (826,968) |
8:30am:
| Sylvania: | 1.0% (1) |
| Pennsylvania: | 10.6% (588,440) |
9am:
| Sylvania: | 1.0% (1) |
| Pennsylvania: | 5.5% (304,765) |
10am:
| Sylvania: | 3.0% (3) |
| Pennsylvania: | 5.1% (280,812) |
4pm:
| Sylvania: | 9.0% (9) |
| Pennsylvania: | 7.3% (404,775) |
>4pm:
| Sylvania: | 8.0% (8) |
| Pennsylvania: | 7.3% (408,070) |

5:00 a.m. to 5:29 a.m. - Males:
| Sylvania: | 9.0% (3) |
| Pennsylvania: | 5.6% (157,829) |
6:00 a.m. to 6:29 a.m. - Males:
| Sylvania: | 14.0% (5) |
| Pennsylvania: | 10.5% (296,669) |
6:30 a.m. to 6:59 a.m. - Males:
| Sylvania: | 22.6% (8) |
| Pennsylvania: | 10.4% (293,727) |
7:00 a.m. to 7:29 a.m. - Males:
| Sylvania: | 19.5% (7) |
| Pennsylvania: | 12.6% (356,257) |
7:30 a.m. to 7:59 a.m. - Males:
| Sylvania: | 24.7% (8) |
| Pennsylvania: | 9.5% (268,895) |
11:00 a.m. to 11:59 a.m. - Males:
| Sylvania: | 5.6% (2) |
| Pennsylvania: | 1.3% (36,091) |
12:00 p.m. to 3:59 p.m. - Males:
| Sylvania: | 2.9% (1) |
| Pennsylvania: | 7.4% (210,601) |

12:00 a.m. to 4:59 a.m. - Females:
| Sylvania: | 9.7% (5) |
| Pennsylvania: | 3.0% (75,875) |
6:30 a.m. to 6:59 a.m. - Females:
| Sylvania: | 3.8% (2) |
| Pennsylvania: | 9.5% (238,332) |
7:00 a.m. to 7:29 a.m. - Females:
| Sylvania: | 24.8% (13) |
| Pennsylvania: | 14.8% (370,723) |
7:30 a.m. to 7:59 a.m. - Females:
| Sylvania: | 1.9% (1) |
| Pennsylvania: | 13.7% (342,732) |
8:00 a.m. to 8:29 a.m. - Females:
| Sylvania: | 46.4% (23) |
| Pennsylvania: | 12.4% (310,699) |
8:30 a.m. to 8:59 a.m. - Females:
| Sylvania: | 1.9% (1) |
| Pennsylvania: | 6.6% (165,487) |
12:00 p.m. to 3:59 p.m. - Females:
| Sylvania: | 1.9% (1) |
| Pennsylvania: | 7.9% (196,654) |
4:00 p.m. to 11:59 p.m. - Females:
| Sylvania: | 9.5% (5) |
| Pennsylvania: | 6.7% (167,321) |
Travel time to work
Percentage of workers working in this county: 75.9%


Less than 5 minutes:
| Sylvania: | 6.0% (6) |
| Pennsylvania: | 3.5% (196,492) |
5 to 9 minutes:
| Sylvania: | 18.0% (18) |
| Pennsylvania: | 11.1% (615,919) |
10 to 14 minutes:
| Sylvania: | 14.0% (14) |
| Pennsylvania: | 14.9% (825,199) |
15 to 19 minutes:
| Sylvania: | 8.0% (8) |
| Pennsylvania: | 15.0% (836,006) |
20 to 24 minutes:
| Sylvania: | 10.0% (10) |
| Pennsylvania: | 14.1% (782,790) |
25 to 29 minutes:
| Sylvania: | 6.0% (6) |
| Pennsylvania: | 5.9% (327,459) |
30 to 34 minutes:
| Sylvania: | 10.0% (10) |
| Pennsylvania: | 11.8% (655,811) |
35 to 39 minutes:
| Sylvania: | 6.0% (6) |
| Pennsylvania: | 2.7% (148,906) |
40 to 44 minutes:
| Sylvania: | 6.0% (6) |
| Pennsylvania: | 3.4% (187,483) |
45 to 59 minutes:
| Sylvania: | 9.0% (9) |
| Pennsylvania: | 7.3% (407,516) |
60 to 89 minutes:
| Sylvania: | 2.0% (2) |
| Pennsylvania: | 4.8% (265,759) |
Means of transportation to work


Drove car alone:
| Sylvania: | 81.0% (81) |
| Pennsylvania: | 76.5% (4,247,836) |
Carpooled:
| Sylvania: | 5.0% (5) |
| Pennsylvania: | 10.4% (577,364) |
Walked:
| Sylvania: | 5.0% (5) |
| Pennsylvania: | 4.1% (229,725) |
Other means:
| Sylvania: | 4.0% (4) |
| Pennsylvania: | 0.5% (29,805) |
Private vehicle occupancy

Drove alone:
| Sylvania: | 100.0% (80) |
| Pennsylvania: | 90.2% (4,322,003) |

Drove alone:
| Sylvania: | 94.2% (81) |
| Pennsylvania: | 88.0% (4,247,836) |
In 2 person carpool:
| Sylvania: | 3.5% (3) |
| Pennsylvania: | 9.7% (470,174) |
In 3 person carpool:
| Sylvania: | 2.3% (2) |
| Pennsylvania: | 1.4% (67,610) |
Class of workers

Employee of private company:
| Sylvania: | 64.4% (57) |
| Pennsylvania: | 67.7% (4,333,849) |
Self-employed in own incorporated business:
| Sylvania: | 5.7% (5) |
| Pennsylvania: | 3.2% (202,029) |
Private not-for-profit wage and salary workers:
| Sylvania: | 12.6% (11) |
| Pennsylvania: | 12.7% (810,562) |
Local government workers:
| Sylvania: | 4.6% (4) |
| Pennsylvania: | 6.2% (397,120) |
Self-employed workers in own not incorporated business:
| Sylvania: | 12.6% (11) |
| Pennsylvania: | 5.0% (318,118) |

Employee of private company:
| Sylvania: | 68.0% (68) |
| Pennsylvania: | 69.7% (3,942,119) |
Private not-for-profit wage and salary workers:
| Sylvania: | 9.0% (9) |
| Pennsylvania: | 10.3% (580,382) |
Local government workers:
| Sylvania: | 5.0% (5) |
| Pennsylvania: | 5.8% (326,222) |
State government workers:
| Sylvania: | 10.0% (10) |
| Pennsylvania: | 3.2% (182,232) |
Self-employed workers in own not incorporated business:
| Sylvania: | 8.0% (8) |
| Pennsylvania: | 6.0% (339,631) |

Employee of private company - Males:
| Sylvania: | 71.4% (25) |
| Pennsylvania: | 71.5% (2,388,579) |
Self-employed in own incorporated business - Males:
| Sylvania: | 14.3% (5) |
| Pennsylvania: | 4.0% (134,437) |
Private not-for-profit wage and salary workers - Males:
| Sylvania: | 8.6% (3) |
| Pennsylvania: | 8.1% (270,498) |
Self-employed workers in own not incorporated business - Males:
| Sylvania: | 5.7% (2) |
| Pennsylvania: | 6.0% (199,421) |

Employee of private company - Females:
| Sylvania: | 59.6% (31) |
| Pennsylvania: | 63.5% (1,945,270) |
Private not-for-profit wage and salary workers - Females:
| Sylvania: | 15.4% (8) |
| Pennsylvania: | 17.6% (540,064) |
Local government workers - Females:
| Sylvania: | 7.7% (4) |
| Pennsylvania: | 7.5% (228,810) |
Self-employed workers in own not incorporated business - Females:
| Sylvania: | 17.3% (9) |
| Pennsylvania: | 3.9% (118,697) |