Work and Jobs in Taylor, Texas (TX) Detailed Stats
Occupations, Industries, Unemployment, Workers, Commute
Settings
X


Recent posts about work in Taylor, Texas on our local forum with over 2,400,000 registered users:
 | Samsung to choose Taylor (35 replies) |
| Austin Market has truly gone to **** (736 replies) |
| Houston's economic diversity Thread .. (1255 replies) |
| Fort Worth Development News (1167 replies) |
| People Say Houston's ugly but not cities like Chicago, NYC, etc? (704 replies) |
| Another Californian Possibly Moving In... (88 replies) |
Latest news about work in Taylor, TX collected exclusively by city-data.com from local newspapers, TV, and radio stations
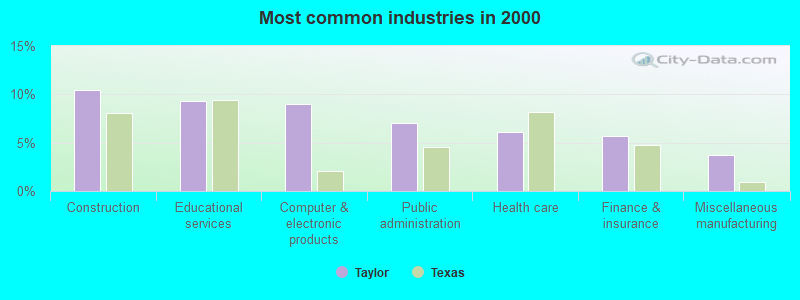
The most common industries in Taylor are: Construction (10.5% of civilian employees), Educational services (9.3% of civilian employees), Computer & electronic products (9.0% of civilian employees). 66.0% of workers work in Williamson County and 8.8% of all workers work at home. 71.0% of workers are employees of private companies, which is 2.0% greater than the rate of 69.6% across the entire state of Texas.
Whole page based on the data from 2000 / 2022 when the population of Taylor, Texas was 13,575 / 17,888
Whole page based on the data from 2000 / 2022 when the population of Taylor, Texas was 13,575 / 17,888
Most common industries
Most common industries | |||
|---|---|---|---|
Industry | All | Males | Females |
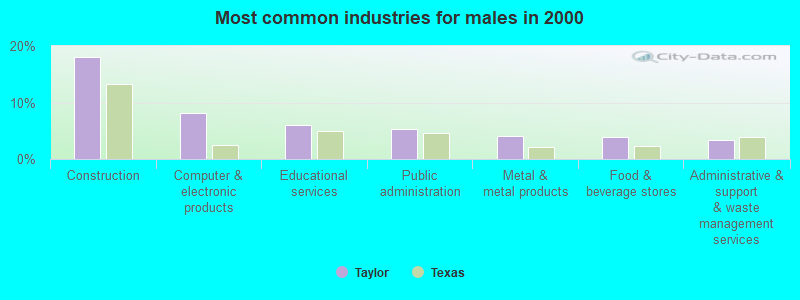
| Construction | 10.5% (612) | 18.1% (568) | 1.6% (44) |
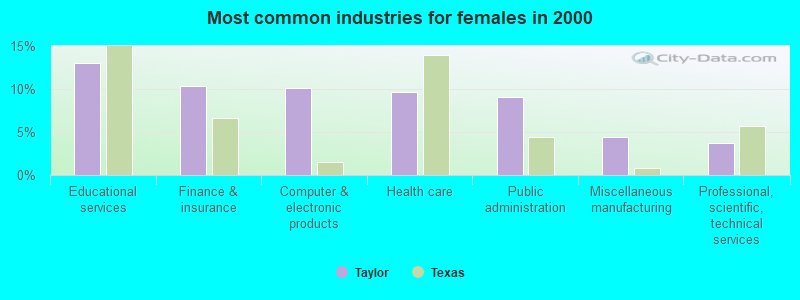
| Educational services | 9.3% (541) | 6.0% (190) | 13.1% (351) |
| Computer and electronic products | 9.0% (527) | 8.1% (254) | 10.2% (273) |
| Public administration | 7.0% (408) | 5.3% (165) | 9.0% (243) |
| Health care | 6.1% (353) | 3.0% (94) | 9.6% (259) |
| Finance and insurance | 5.7% (334) | 1.8% (57) | 10.3% (277) |
| Miscellaneous manufacturing | 3.7% (215) | 3.0% (95) | 4.5% (120) |
| Professional, scientific, and technical services | 3.4% (201) | 3.2% (101) | 3.7% (100) |
| Food and beverage stores | 3.3% (195) | 3.9% (122) | 2.7% (73) |
| Accommodation and food services | 3.1% (183) | 2.8% (87) | 3.6% (96) |
| Administrative and support and waste management services | 3.1% (182) | 3.4% (108) | 2.8% (74) |
| Metal and metal products | 2.4% (141) | 4.1% (130) | 0.4% (11) |
| Department and other general merchandise stores | 2.0% (118) | 0.7% (22) | 3.6% (96) |
| Real estate and rental and leasing | 2.0% (118) | 1.6% (51) | 2.5% (67) |
| Furniture and related product manufacturing | 2.0% (117) | 2.6% (83) | 1.3% (34) |
| Motor vehicle and parts dealers | 1.8% (103) | 3.1% (98) | 0.2% (5) |
| Repair and maintenance | 1.7% (97) | 2.6% (81) | 0.6% (16) |
| Social assistance | 1.3% (76) | 0.2% (7) | 2.6% (69) |
| Utilities | 1.2% (72) | 1.8% (56) | 0.6% (16) |
| Personal and laundry services | 1.2% (72) | 1.2% (38) | 1.3% (34) |
| Machinery | 1.1% (62) | 1.5% (47) | 0.6% (15) |
| Religious, grantmaking, civic, professional, and similar organizations | 1.1% (62) | 1.0% (31) | 1.2% (31) |
| Building material and garden equipment and supplies dealers | 1.0% (61) | 1.6% (49) | 0.4% (12) |
| Plastics and rubber products | 1.0% (60) | 0.7% (22) | 1.4% (38) |
| Broadcasting and telecommunications | 1.0% (56) | 0.8% (26) | 1.1% (30) |
| Food | 0.8% (47) | 0.6% (20) | 1.0% (27) |
| Rail transportation | 0.7% (43) | 1.4% (43) | 0.0% (0) |
| Agriculture, forestry, fishing and hunting | 0.7% (41) | 1.3% (41) | 0.0% (0) |
| Radio, TV, and computer stores | 0.7% (39) | 0.5% (16) | 0.9% (23) |
| Truck transportation | 0.7% (38) | 1.2% (38) | 0.0% (0) |
| Nonmetallic mineral products | 0.6% (35) | 1.1% (35) | 0.0% (0) |
| Groceries and related products merchant wholesalers | 0.6% (35) | 0.9% (29) | 0.2% (6) |
| Other transportation, and support activities, and couriers | 0.6% (35) | 0.9% (29) | 0.2% (6) |
| Chemicals | 0.5% (32) | 0.7% (23) | 0.3% (9) |
| Transportation equipment | 0.5% (32) | 0.8% (25) | 0.3% (7) |
| Other direct selling establishments | 0.5% (31) | 0.4% (11) | 0.7% (20) |
| Furniture and home furnishings, and household appliance stores | 0.5% (28) | 0.5% (17) | 0.4% (11) |
| Electrical equipment, appliances, and components | 0.5% (27) | 0.9% (27) | 0.0% (0) |
| Miscellaneous nondurable goods merchant wholesalers | 0.4% (24) | 0.3% (10) | 0.5% (14) |
| Wood products | 0.4% (23) | 0.5% (15) | 0.3% (8) |
| Pharmacies and drug stores | 0.4% (23) | 0.1% (4) | 0.7% (19) |
| U. S. Postal service | 0.4% (22) | 0.5% (17) | 0.2% (5) |
| Private households | 0.4% (21) | 0.0% (0) | 0.8% (21) |
| Printing and related support activities | 0.3% (20) | 0.4% (13) | 0.3% (7) |
| Professional and commercial equipment and supplies merchant wholesalers | 0.3% (20) | 0.4% (11) | 0.3% (9) |
| Electrical and electronic goods merchant wholesalers | 0.3% (18) | 0.3% (8) | 0.4% (10) |
| Lumber and other construction materials merchant wholesalers | 0.3% (17) | 0.5% (17) | 0.0% (0) |
| Machinery, equipment, and supplies merchant wholesalers | 0.3% (17) | 0.5% (17) | 0.0% (0) |
| Publishing, and motion picture and sound recording industries | 0.3% (17) | 0.3% (10) | 0.3% (7) |
| Textile mills and textile products | 0.3% (16) | 0.4% (11) | 0.2% (5) |
| Arts, entertainment, and recreation | 0.3% (16) | 0.2% (5) | 0.4% (11) |
| Clothing and accessories, including shoe, stores | 0.3% (15) | 0.0% (0) | 0.6% (15) |
| Alcoholic beverages merchant wholesalers | 0.2% (14) | 0.4% (14) | 0.0% (0) |
| Air transportation | 0.2% (14) | 0.0% (0) | 0.5% (14) |
| Furniture and home furnishing merchant wholesalers | 0.2% (13) | 0.4% (13) | 0.0% (0) |
| Mining, quarrying, and oil and gas extraction | 0.2% (13) | 0.4% (13) | 0.0% (0) |
| Data processing, libraries, and other information services | 0.2% (13) | 0.3% (8) | 0.2% (5) |
| Electronic shopping and mail-order houses | 0.2% (12) | 0.0% (0) | 0.4% (12) |
| Used merchandise, gift, novelty, and souvenir, and other miscellaneous stores | 0.2% (12) | 0.0% (0) | 0.4% (12) |
| Management of companies and enterprises | 0.1% (8) | 0.0% (0) | 0.3% (8) |
| Vending machine operators | 0.1% (7) | 0.2% (7) | 0.0% (0) |
| Health and personal care, except drug, stores | 0.1% (7) | 0.2% (7) | 0.0% (0) |
| Warehousing and storage | 0.1% (6) | 0.0% (0) | 0.2% (6) |
| Petroleum and coal products | 0.1% (6) | 0.2% (6) | 0.0% (0) |
| Farm supplies merchant wholesalers | 0.1% (6) | 0.0% (0) | 0.2% (6) |
Unemployment in Taylor
- Unemployment by race in 2022
- Unemployment rate for White non-Hispanic residents
- 5.0%Males
- 3.9%Females
- Unemployment rate for Black residents
- 8.4%Males
- Unemployment rate for other race residents
- 2.9%Males
- Unemployment rate for two or more race residents
- 4.1%Males
- 4.2%Females
- Unemployment rate for Hispanic or Latino residents
- 2.8%Males
- 2.1%Females
- Unemployment by race in 2000
- Unemployment rate for White non-Hispanic residents
- 1.5%Males
- 2.4%Females
- Unemployment rate for Black residents
- 1.8%Males
- 7.1%Females
- Unemployment rate for other race residents
- 11.5%Males
- 6.8%Females
- Unemployment rate for Hispanic or Latino residents
- 7.0%Males
- 5.3%Females
Time leaving home to go to work
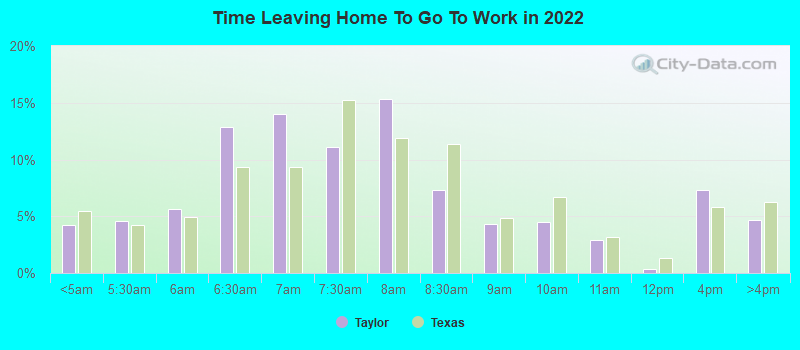
12:00 a.m. to 4:59 a.m.:
| Taylor: | 4.2% (290) |
| Texas: | 5.5% (678,264) |
5:00 a.m. to 5:29 a.m.:
| Taylor: | 4.6% (314) |
| Texas: | 4.3% (525,841) |
5:30 a.m. to 5:59 a.m.:
| Taylor: | 5.6% (386) |
| Texas: | 4.9% (603,953) |
6:00 a.m. to 6:29 a.m.:
| Taylor: | 12.9% (885) |
| Texas: | 9.4% (1,155,020) |
6:30 a.m. to 6:59 a.m.:
| Taylor: | 14.0% (962) |
| Texas: | 9.3% (1,152,822) |
7:00 a.m. to 7:29 a.m.:
| Taylor: | 11.1% (760) |
| Texas: | 15.3% (1,885,477) |
7:30 a.m. to 7:59 a.m.:
| Taylor: | 15.3% (1,050) |
| Texas: | 11.9% (1,469,628) |
8:00 a.m. to 8:29 a.m.:
| Taylor: | 7.3% (502) |
| Texas: | 11.3% (1,400,175) |
8:30 a.m. to 8:59 a.m.:
| Taylor: | 4.3% (293) |
| Texas: | 4.9% (599,574) |
9:00 a.m. to 9:59 a.m.:
| Taylor: | 4.5% (309) |
| Texas: | 6.7% (829,367) |
10:00 a.m. to 10:59 a.m.:
| Taylor: | 2.9% (197) |
| Texas: | 3.2% (390,354) |
11:00 a.m. to 11:59 a.m.:
| Taylor: | 0.4% (25) |
| Texas: | 1.3% (162,330) |
12:00 p.m. to 3:59 p.m.:
| Taylor: | 7.3% (501) |
| Texas: | 5.8% (720,594) |
4:00 p.m. to 11:59 p.m.:
| Taylor: | 4.7% (321) |
| Texas: | 6.3% (777,072) |

<5am:
| Taylor: | 3.0% (172) |
| Texas: | 3.1% (281,361) |
5:30am:
| Taylor: | 2.5% (142) |
| Texas: | 2.9% (262,060) |
6am:
| Taylor: | 8.4% (479) |
| Texas: | 4.4% (403,423) |
6:30am:
| Taylor: | 11.4% (647) |
| Texas: | 8.8% (808,876) |
7am:
| Taylor: | 12.2% (694) |
| Texas: | 10.7% (976,557) |
7:30am:
| Taylor: | 19.5% (1,105) |
| Texas: | 16.4% (1,500,904) |
8am:
| Taylor: | 16.1% (912) |
| Texas: | 16.8% (1,536,308) |
8:30am:
| Taylor: | 6.5% (368) |
| Texas: | 10.0% (913,601) |
9am:
| Taylor: | 1.3% (74) |
| Texas: | 4.4% (398,656) |
10am:
| Taylor: | 1.7% (97) |
| Texas: | 5.2% (472,592) |
11am:
| Taylor: | 1.6% (89) |
| Texas: | 2.2% (197,844) |
12pm:
| Taylor: | 0.5% (30) |
| Texas: | 0.9% (86,997) |
4pm:
| Taylor: | 5.5% (313) |
| Texas: | 5.5% (503,565) |
>4pm:
| Taylor: | 7.4% (421) |
| Texas: | 6.1% (563,107) |

12:00 a.m. to 4:59 a.m. - Males:
| Taylor: | 6.4% (220) |
| Texas: | 7.0% (477,284) |
5:00 a.m. to 5:29 a.m. - Males:
| Taylor: | 6.6% (224) |
| Texas: | 5.8% (394,876) |
5:30 a.m. to 5:59 a.m. - Males:
| Taylor: | 7.6% (260) |
| Texas: | 5.9% (402,788) |
6:00 a.m. to 6:29 a.m. - Males:
| Taylor: | 20.6% (704) |
| Texas: | 10.9% (751,118) |
6:30 a.m. to 6:59 a.m. - Males:
| Taylor: | 10.5% (360) |
| Texas: | 9.5% (652,306) |
7:00 a.m. to 7:29 a.m. - Males:
| Taylor: | 10.9% (372) |
| Texas: | 14.1% (970,598) |
7:30 a.m. to 7:59 a.m. - Males:
| Taylor: | 10.8% (369) |
| Texas: | 10.2% (696,429) |
8:00 a.m. to 8:29 a.m. - Males:
| Taylor: | 5.1% (175) |
| Texas: | 10.6% (729,041) |
8:30 a.m. to 8:59 a.m. - Males:
| Taylor: | 1.3% (44) |
| Texas: | 4.1% (281,762) |
9:00 a.m. to 9:59 a.m. - Males:
| Taylor: | 3.4% (116) |
| Texas: | 5.8% (401,071) |
10:00 a.m. to 10:59 a.m. - Males:
| Taylor: | 2.3% (78) |
| Texas: | 2.7% (186,469) |
11:00 a.m. to 11:59 a.m. - Males:
| Taylor: | 0.5% (15) |
| Texas: | 1.2% (82,242) |
12:00 p.m. to 3:59 p.m. - Males:
| Taylor: | 10.7% (364) |
| Texas: | 5.8% (397,795) |
4:00 p.m. to 11:59 p.m. - Males:
| Taylor: | 4.0% (138) |
| Texas: | 6.4% (435,950) |

12:00 a.m. to 4:59 a.m. - Females:
| Taylor: | 1.7% (58) |
| Texas: | 3.7% (200,980) |
5:00 a.m. to 5:29 a.m. - Females:
| Taylor: | 2.3% (80) |
| Texas: | 2.4% (130,965) |
5:30 a.m. to 5:59 a.m. - Females:
| Taylor: | 3.7% (126) |
| Texas: | 3.7% (201,165) |
6:00 a.m. to 6:29 a.m. - Females:
| Taylor: | 4.7% (161) |
| Texas: | 7.4% (403,902) |
6:30 a.m. to 6:59 a.m. - Females:
| Taylor: | 17.6% (607) |
| Texas: | 9.1% (500,516) |
7:00 a.m. to 7:29 a.m. - Females:
| Taylor: | 11.2% (387) |
| Texas: | 16.7% (914,879) |
7:30 a.m. to 7:59 a.m. - Females:
| Taylor: | 19.9% (689) |
| Texas: | 14.1% (773,199) |
8:00 a.m. to 8:29 a.m. - Females:
| Taylor: | 9.6% (333) |
| Texas: | 12.2% (671,134) |
8:30 a.m. to 8:59 a.m. - Females:
| Taylor: | 7.9% (273) |
| Texas: | 5.8% (317,812) |
9:00 a.m. to 9:59 a.m. - Females:
| Taylor: | 5.7% (197) |
| Texas: | 7.8% (428,296) |
10:00 a.m. to 10:59 a.m. - Females:
| Taylor: | 3.2% (109) |
| Texas: | 3.7% (203,885) |
12:00 p.m. to 3:59 p.m. - Females:
| Taylor: | 4.4% (152) |
| Texas: | 5.9% (322,799) |
4:00 p.m. to 11:59 p.m. - Females:
| Taylor: | 5.4% (187) |
| Texas: | 6.2% (341,122) |
Travel time to work
Percentage of workers working in this county: 66.0%
Number of people working at home: 716 (8.8% of all workers)
Daytime population change due to commuting: -615 (-4.5%)
Workers who live and work in this city: 2,199 (38.7%)
Number of people working at home: 716 (8.8% of all workers)
Daytime population change due to commuting: -615 (-4.5%)
Workers who live and work in this city: 2,199 (38.7%)

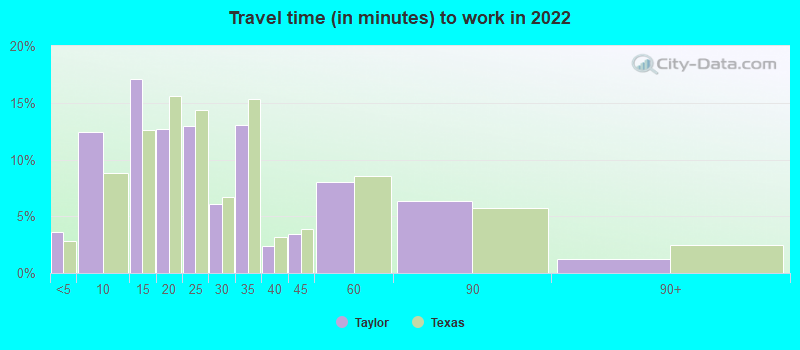

Less than 5 minutes:
| Taylor: | 3.6% (254) |
| Texas: | 2.8% (350,462) |
5 to 9 minutes:
| Taylor: | 12.4% (878) |
| Texas: | 8.8% (1,087,762) |
10 to 14 minutes:
| Taylor: | 17.1% (1,204) |
| Texas: | 12.6% (1,550,271) |
15 to 19 minutes:
| Taylor: | 12.7% (897) |
| Texas: | 15.6% (1,918,353) |
20 to 24 minutes:
| Taylor: | 13.0% (915) |
| Texas: | 14.4% (1,772,079) |
25 to 29 minutes:
| Taylor: | 6.1% (429) |
| Texas: | 6.7% (827,833) |
30 to 34 minutes:
| Taylor: | 13.0% (919) |
| Texas: | 15.3% (1,887,878) |
35 to 39 minutes:
| Taylor: | 2.3% (165) |
| Texas: | 3.2% (394,170) |
40 to 44 minutes:
| Taylor: | 3.4% (241) |
| Texas: | 3.9% (476,118) |
45 to 59 minutes:
| Taylor: | 8.1% (569) |
| Texas: | 8.6% (1,058,376) |
60 to 89 minutes:
| Taylor: | 6.4% (450) |
| Texas: | 5.7% (706,002) |
90 or more minutes:
| Taylor: | 1.2% (85) |
| Texas: | 2.4% (299,884) |


Less than 5 minutes:
| Taylor: | 4.0% (228) |
| Texas: | 3.0% (277,642) |
5 to 9 minutes:
| Taylor: | 20.4% (1,159) |
| Texas: | 10.3% (942,891) |
10 to 14 minutes:
| Taylor: | 12.9% (734) |
| Texas: | 14.4% (1,317,555) |
15 to 19 minutes:
| Taylor: | 5.6% (318) |
| Texas: | 16.0% (1,467,945) |
20 to 24 minutes:
| Taylor: | 5.7% (326) |
| Texas: | 13.9% (1,276,781) |
25 to 29 minutes:
| Taylor: | 4.6% (263) |
| Texas: | 5.3% (482,838) |
30 to 34 minutes:
| Taylor: | 13.4% (760) |
| Texas: | 14.3% (1,309,699) |
35 to 39 minutes:
| Taylor: | 4.3% (246) |
| Texas: | 2.4% (219,873) |
40 to 44 minutes:
| Taylor: | 4.1% (235) |
| Texas: | 3.1% (280,916) |
45 to 59 minutes:
| Taylor: | 15.9% (902) |
| Texas: | 7.6% (692,006) |
60 to 89 minutes:
| Taylor: | 6.1% (346) |
| Texas: | 4.6% (418,905) |
90 or more minutes:
| Taylor: | 0.5% (26) |
| Texas: | 2.4% (218,800) |

Less than 5 minutes - Males:
| Taylor: | 1.9% (71) |
| Texas: | 2.7% (181,937) |
5 to 9 minutes - Males:
| Taylor: | 8.7% (325) |
| Texas: | 7.6% (522,166) |
10 to 14 minutes - Males:
| Taylor: | 16.6% (621) |
| Texas: | 11.5% (785,572) |
15 to 19 minutes - Males:
| Taylor: | 13.7% (511) |
| Texas: | 14.6% (1,001,179) |
20 to 24 minutes - Males:
| Taylor: | 12.0% (447) |
| Texas: | 13.9% (950,043) |
25 to 29 minutes - Males:
| Taylor: | 8.1% (301) |
| Texas: | 6.7% (457,259) |
30 to 34 minutes - Males:
| Taylor: | 14.4% (538) |
| Texas: | 16.2% (1,110,357) |
35 to 39 minutes - Males:
| Taylor: | 3.3% (124) |
| Texas: | 3.3% (223,512) |
40 to 44 minutes - Males:
| Taylor: | 3.4% (128) |
| Texas: | 4.2% (289,434) |
45 to 59 minutes - Males:
| Taylor: | 8.9% (332) |
| Texas: | 9.3% (639,122) |
60 to 89 minutes - Males:
| Taylor: | 6.4% (237) |
| Texas: | 6.8% (467,154) |
90 or more minutes - Males:
| Taylor: | 2.1% (80) |
| Texas: | 3.1% (211,313) |

Less than 5 minutes - Females:
| Taylor: | 4.6% (154) |
| Texas: | 3.1% (168,525) |
5 to 9 minutes - Females:
| Taylor: | 15.9% (528) |
| Texas: | 10.3% (565,596) |
10 to 14 minutes - Females:
| Taylor: | 17.0% (565) |
| Texas: | 13.9% (764,699) |
15 to 19 minutes - Females:
| Taylor: | 11.1% (370) |
| Texas: | 16.7% (917,174) |
20 to 24 minutes - Females:
| Taylor: | 14.0% (465) |
| Texas: | 15.0% (822,036) |
25 to 29 minutes - Females:
| Taylor: | 4.1% (138) |
| Texas: | 6.7% (370,574) |
30 to 34 minutes - Females:
| Taylor: | 11.5% (381) |
| Texas: | 14.2% (777,521) |
35 to 39 minutes - Females:
| Taylor: | 1.4% (48) |
| Texas: | 3.1% (170,658) |
40 to 44 minutes - Females:
| Taylor: | 3.4% (114) |
| Texas: | 3.4% (186,684) |
45 to 59 minutes - Females:
| Taylor: | 7.1% (236) |
| Texas: | 7.6% (419,254) |
60 to 89 minutes - Females:
| Taylor: | 6.3% (208) |
| Texas: | 4.4% (238,848) |
90 or more minutes - Females:
| Taylor: | 0.3% (11) |
| Texas: | 1.6% (88,571) |
Means of transportation to work
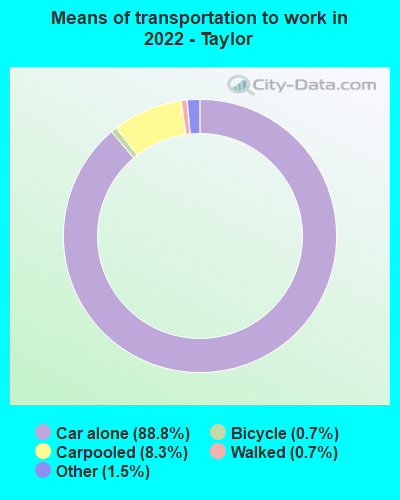

Drove car alone:
| Taylor: | 88.8% (6,931) |
| Texas: | 83.3% (4,557,023) |
Carpooled:
| Taylor: | 8.3% (652) |
| Texas: | 11.7% (674,818) |
Bicycle:
| Taylor: | 0.7% (52) |
| Texas: | 0.2% (7,954) |
Walked:
| Taylor: | 0.7% (55) |
| Texas: | 1.7% (99,911) |
Other means:
| Taylor: | 1.5% (118) |
| Texas: | 2.0% (95,481) |


Drove car alone:
| Taylor: | 73.9% (4,199) |
| Texas: | 77.7% (7,115,590) |
Carpooled:
| Taylor: | 20.5% (1,165) |
| Texas: | 14.5% (1,326,012) |
Bus or trolley bus:
| Taylor: | 0.2% (14) |
| Texas: | 1.7% (157,014) |
Bicycle:
| Taylor: | 0.4% (25) |
| Texas: | 0.2% (21,551) |
Walked:
| Taylor: | 1.5% (86) |
| Texas: | 1.9% (173,670) |
Other means:
| Taylor: | 1.0% (54) |
| Texas: | 0.9% (86,692) |


Drove car alone - Males:
| Taylor: | 87.7% (3,682) |
| Texas: | 83.6% (4,557,023) |
Carpooled - Males:
| Taylor: | 7.5% (316) |
| Texas: | 11.2% (674,818) |
Bicycle - Males:
| Taylor: | 0.7% (28) |
| Texas: | 0.3% (7,954) |
Walked - Males:
| Taylor: | 1.3% (56) |
| Texas: | 1.7% (99,911) |
Other means - Males:
| Taylor: | 2.7% (115) |
| Texas: | 2.2% (95,481) |


Drove car alone - Females:
| Taylor: | 89.9% (3,244) |
| Texas: | 83.0% (4,557,023) |
Carpooled - Females:
| Taylor: | 9.3% (334) |
| Texas: | 12.3% (674,818) |
Bicycle - Females:
| Taylor: | 0.7% (24) |
| Texas: | 0.1% (7,954) |
Other means - Females:
| Taylor: | 0.2% (6) |
| Texas: | 1.7% (95,481) |
Private vehicle occupancy

Drove alone:
| Taylor: | 86.3% (5,701) |
| Texas: | 87.6% (10,283,021) |
In 2 person carpool:
| Taylor: | 11.7% (776) |
| Texas: | 9.0% (1,052,595) |
In 3 person carpool:
| Taylor: | 0.1% (5) |
| Texas: | 2.1% (244,139) |
In 4 person carpool:
| Taylor: | 0.2% (13) |
| Texas: | 0.8% (92,732) |
In 5-6 person carpool:
| Taylor: | 1.6% (106) |
| Texas: | 0.4% (44,947) |
In 7+ person carpool:
| Taylor: | 0.1% (5) |
| Texas: | 0.1% (16,725) |

Drove alone:
| Taylor: | 78.3% (4,199) |
| Texas: | 84.3% (7,115,590) |
In 2 person carpool:
| Taylor: | 16.0% (858) |
| Texas: | 11.6% (982,994) |
In 3 person carpool:
| Taylor: | 3.1% (167) |
| Texas: | 2.4% (201,602) |
In 4 person carpool:
| Taylor: | 1.3% (68) |
| Texas: | 1.0% (83,518) |
In 5-6 person carpool:
| Taylor: | 0.3% (17) |
| Texas: | 0.5% (40,662) |
In 7+ person carpool:
| Taylor: | 1.0% (55) |
| Texas: | 0.2% (17,236) |
Class of workers
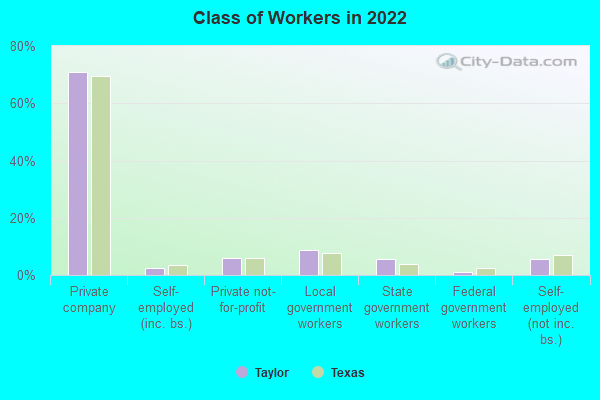
Employee of private company:
| Taylor: | 71.0% (6,025) |
| Texas: | 69.6% (10,139,666) |
Self-employed in own incorporated business:
| Taylor: | 2.3% (194) |
| Texas: | 3.5% (516,446) |
Private not-for-profit wage and salary workers:
| Taylor: | 6.1% (515) |
| Texas: | 6.0% (870,454) |
Local government workers:
| Taylor: | 8.6% (730) |
| Texas: | 7.6% (1,109,799) |
State government workers:
| Taylor: | 5.5% (463) |
| Texas: | 3.8% (558,618) |
Federal government workers:
| Taylor: | 1.0% (85) |
| Texas: | 2.5% (357,298) |
Self-employed workers in own not incorporated business:
| Taylor: | 5.5% (465) |
| Texas: | 6.8% (998,270) |
Unpaid family workers:
| Taylor: | 0.1% (9) |
| Texas: | 0.2% (27,882) |

Employee of private company:
| Taylor: | 67.8% (3,953) |
| Texas: | 69.6% (6,425,274) |
Self-employed in own incorporated business:
| Taylor: | 1.5% (89) |
| Texas: | 2.7% (250,864) |
Private not-for-profit wage and salary workers:
| Taylor: | 4.6% (266) |
| Texas: | 5.7% (526,631) |
Local government workers:
| Taylor: | 7.5% (440) |
| Texas: | 6.6% (608,479) |
State government workers:
| Taylor: | 9.1% (529) |
| Texas: | 5.4% (501,082) |
Federal government workers:
| Taylor: | 1.5% (85) |
| Texas: | 2.6% (237,177) |
Self-employed workers in own not incorporated business:
| Taylor: | 7.5% (439) |
| Texas: | 7.1% (653,527) |
Unpaid family workers:
| Taylor: | 0.5% (28) |
| Texas: | 0.3% (31,338) |

Employee of private company - Males:
| Taylor: | 74.8% (3,198) |
| Texas: | 73.1% (5,788,450) |
Self-employed in own incorporated business - Males:
| Taylor: | 2.4% (101) |
| Texas: | 4.2% (332,655) |
Private not-for-profit wage and salary workers - Males:
| Taylor: | 4.7% (199) |
| Texas: | 4.1% (323,476) |
Local government workers - Males:
| Taylor: | 8.4% (359) |
| Texas: | 5.1% (405,467) |
State government workers - Males:
| Taylor: | 2.9% (122) |
| Texas: | 3.0% (236,706) |
Federal government workers - Males:
| Taylor: | 0.4% (18) |
| Texas: | 2.7% (211,629) |
Self-employed workers in own not incorporated business - Males:
| Taylor: | 6.5% (276) |
| Texas: | 7.7% (609,246) |

Employee of private company - Females:
| Taylor: | 67.1% (2,826) |
| Texas: | 65.4% (4,351,216) |
Self-employed in own incorporated business - Females:
| Taylor: | 2.2% (93) |
| Texas: | 2.8% (183,791) |
Private not-for-profit wage and salary workers - Females:
| Taylor: | 7.5% (317) |
| Texas: | 8.2% (546,978) |
Local government workers - Females:
| Taylor: | 8.8% (371) |
| Texas: | 10.6% (704,332) |
State government workers - Females:
| Taylor: | 8.1% (340) |
| Texas: | 4.8% (321,912) |
Federal government workers - Females:
| Taylor: | 1.6% (67) |
| Texas: | 2.2% (145,669) |
Self-employed workers in own not incorporated business - Females:
| Taylor: | 4.5% (189) |
| Texas: | 5.8% (389,024) |
Unpaid family workers - Females:
| Taylor: | 0.2% (9) |
| Texas: | 0.2% (15,276) |