Work and Jobs in Townsend, Delaware (DE) Detailed Stats
Data:
Unemployment (%)
Unemployment (% change since 2000)
Unemployment (%) - White
Unemployment (% change since 2000) - White
Unemployment (%) - Black or African American
Unemployment (% change since 2000) - Black or African American
Unemployment (%) - Asian
Unemployment (% change since 2000) - Asian
Unemployment (%) - Hispanic or Latino
Unemployment (% change since 2000) - Hispanic or Latino
Unemployment (%) - American Indian and Alaska Native
Unemployment (% change since 2000) - American Indian and Alaska Native
Unemployment (%) - Multirace
Unemployment (% change since 2000) - Multirace
Unemployment (%) - Other Race
Unemployment (% change since 2000) - Other Race
Industry diversity
Most Common Industries - Agriculture, forestry, fishing and hunting, and mining (%)
Most Common Industries - Agriculture, forestry, fishing and hunting (%)
Most Common Industries - Mining, quarrying, and oil and gas extraction (%)
Most Common Industries - Construction (%)
Most Common Industries - Manufacturing (%)
Most Common Industries - Wholesale trade (%)
Most Common Industries - Retail trade (%)
Most Common Industries - Transportation and warehousing, and utilities (%)
Most Common Industries - Transportation and warehousing (%)
Most Common Industries - Utilities (%)
Most Common Industries - Information (%)
Most Common Industries - Finance and insurance, and real estate and rental and leasing (%)
Most Common Industries - Finance and insurance (%)
Most Common Industries - Real estate and rental and leasing (%)
Most Common Industries - Professional, scientific, and management, and administrative and waste management services (%)
Most Common Industries - Professional, scientific, and technical services (%)
Most Common Industries - Management of companies and enterprises (%)
Most Common Industries - Administrative and support and waste management services (%)
Most Common Industries - Educational services, and health care and social assistance (%)
Most Common Industries - Educational services (%)
Most Common Industries - Health care and social assistance (%)
Most Common Industries - Arts, entertainment, and recreation, and accommodation and food services (%)
Most Common Industries - Arts, entertainment, and recreation (%)
Most Common Industries - Accommodation and food services (%)
Most Common Industries - Other services, except public administration (%)
Most Common Industries - Public administration (%)
Occupation diversity
Most Common Occupations - Management, business, science, and arts occupations (%)
Most Common Occupations - Management, business, and financial occupations (%)
Most Common Occupations - Management occupations (%)
Most Common Occupations - Business and financial operations occupations (%)
Most Common Occupations - Computer, engineering, and science occupations (%)
Most Common Occupations - Computer and mathematical occupations (%)
Most Common Occupations - Architecture and engineering occupations (%)
Most Common Occupations - Life, physical, and social science occupations (%)
Most Common Occupations - Education, legal, community service, arts, and media occupations (%)
Most Common Occupations - Community and social service occupations (%)
Most Common Occupations - Legal occupations (%)
Most Common Occupations - Education, training, and library occupations (%)
Most Common Occupations - Arts, design, entertainment, sports, and media occupations (%)
Most Common Occupations - Healthcare practitioners and technical occupations (%)
Most Common Occupations - Health diagnosing and treating practitioners and other technical occupations (%)
Most Common Occupations - Health technologists and technicians (%)
Most Common Occupations - Service occupations (%)
Most Common Occupations - Healthcare support occupations (%)
Most Common Occupations - Protective service occupations (%)
Most Common Occupations - Fire fighting and prevention, and other protective service workers including supervisors (%)
Most Common Occupations - Law enforcement workers including supervisors (%)
Most Common Occupations - Food preparation and serving related occupations (%)
Most Common Occupations - Building and grounds cleaning and maintenance occupations (%)
Most Common Occupations - Personal care and service occupations (%)
Most Common Occupations - Sales and office occupations (%)
Most Common Occupations - Sales and related occupations (%)
Most Common Occupations - Office and administrative support occupations (%)
Most Common Occupations - Natural resources, construction, and maintenance occupations (%)
Most Common Occupations - Farming, fishing, and forestry occupations (%)
Most Common Occupations - Construction and extraction occupations (%)
Most Common Occupations - Installation, maintenance, and repair occupations (%)
Most Common Occupations - Production, transportation, and material moving occupations (%)
Most Common Occupations - Production occupations (%)
Most Common Occupations - Transportation occupations (%)
Most Common Occupations - Material moving occupations (%)
Private vehicle occupancy - Drove alone (% change since 2000)
Private vehicle occupancy - Carpooled (%)
Private vehicle occupancy - Carpooled (% change since 2000)
Private vehicle occupancy - In 2-person carpool (%)
Private vehicle occupancy - In 2-person carpool (% change since 2000)
Private vehicle occupancy - In 3-person carpool (%)
Private vehicle occupancy - In 3-person carpool (% change since 2000)
Private vehicle occupancy - In 4-person carpool (%)
Private vehicle occupancy - In 4-person carpool (% change since 2000)
Private vehicle occupancy - In 5- or 6-person carpool (%)
Private vehicle occupancy - In 5- or 6-person carpool (% change since 2000)
Private vehicle occupancy - In 7-or-more-person carpool (%)
Private vehicle occupancy - In 7-or-more-person carpool (% change since 2000)
Time Leaving Home To Go To Work - 12:00 a.m. to 4:59 a.m. (%)
Time Leaving Home To Go To Work - 12:00 a.m. to 4:59 a.m. (% change since 2000)
Time Leaving Home To Go To Work - 5:00 a.m. to 5:59 a.m. (%)
Time Leaving Home To Go To Work - 5:00 a.m. to 5:59 a.m. (% change since 2000)
Time Leaving Home To Go To Work - 6:00 a.m. to 6:59 a.m. (%)
Time Leaving Home To Go To Work - 6:00 a.m. to 6:59 a.m. (% change since 2000)
Time Leaving Home To Go To Work - 7:00 a.m. to 7:59 a.m. (%)
Time Leaving Home To Go To Work - 7:00 a.m. to 7:59 a.m. (% change since 2000)
Time Leaving Home To Go To Work - 8:00 a.m. to 8:59 a.m. (%)
Time Leaving Home To Go To Work - 8:00 a.m. to 8:59 a.m. (% change since 2000)
Time Leaving Home To Go To Work - 9:00 a.m. to 9:59 a.m. (%)
Time Leaving Home To Go To Work - 9:00 a.m. to 9:59 a.m. (% change since 2000)
Time Leaving Home To Go To Work - 10:00 a.m. to 10:59 a.m. (%)
Time Leaving Home To Go To Work - 10:00 a.m. to 10:59 a.m. (% change since 2000)
Time Leaving Home To Go To Work - 11:00 a.m. to 11:59 a.m. (%)
Time Leaving Home To Go To Work - 11:00 a.m. to 11:59 a.m. (% change since 2000)
Time Leaving Home To Go To Work - 12:00 p.m. to 3:59 p.m. (%)
Time Leaving Home To Go To Work - 12:00 p.m. to 3:59 p.m. (% change since 2000)
Time Leaving Home To Go To Work - 4:00 p.m. to 11:59 p.m. (%)
Time Leaving Home To Go To Work - 4:00 p.m. to 11:59 p.m. (% change since 2000)
Class of Workers - Employee of private company (%)
Class of Workers - Employee of private company (% change since 2000)
Class of Workers - Self-employed in own incorporated business (%)
Class of Workers - Self-employed in own incorporated business (% change since 2000)
Class of Workers - Private not-for-profit wage and salary workers (%)
Class of Workers - Private not-for-profit wage and salary workers (% change since 2000)
Class of Workers - Local government workers (%)
Class of Workers - Local government workers (% change since 2000)
Class of Workers - State government workers (%)
Class of Workers - State government workers (% change since 2000)
Class of Workers - Federal government workers (%)
Class of Workers - Federal government workers (% change since 2000)
Class of Workers - Self-employed workers in own not incorporated business and Unpaid family workers (%)
Class of Workers - Self-employed workers in own not incorporated business and Unpaid family workers (% change since 2000)
Means of transportation to work - Drove car alone (%)
Means of transportation to work - Drove car alone (% change since 2000)
Means of transportation to work - Carpooled (%)
Means of transportation to work - Carpooled (% change since 2000)
Means of transportation to work - Public transportation (%)
Means of transportation to work - Public transportation (% change since 2000)
Means of transportation to work - Bus or trolley bus (%)
Means of transportation to work - Bus or trolley bus (% change since 2000)
Means of transportation to work - Streetcar or trolley car (%)
Means of transportation to work - Streetcar or trolley car (% change since 2000)
Means of transportation to work - Subway or elevated (%)
Means of transportation to work - Subway or elevated (% change since 2000)
Means of transportation to work - Railroad (%)
Means of transportation to work - Railroad (% change since 2000)
Means of transportation to work - Ferryboat (%)
Means of transportation to work - Ferryboat (% change since 2000)
Means of transportation to work - Taxicab (%)
Means of transportation to work - Taxicab (% change since 2000)
Means of transportation to work - Motorcycle (%)
Means of transportation to work - Motorcycle (% change since 2000)
Means of transportation to work - Bicycle (%)
Means of transportation to work - Bicycle (% change since 2000)
Means of transportation to work - Walked (%)
Means of transportation to work - Walked (% change since 2000)
Means of transportation to work - Other means (%)
Means of transportation to work - Other means (% change since 2000)
Working at home (%)
Working at home (% change since 2000)
Travel time to work - Less than 5 minutes (%)
Travel time to work - Less than 5 minutes (% change since 2000)
Travel time to work - 5 to 9 minutes (%)
Travel time to work - 5 to 9 minutes (% change since 2000)
Travel time to work - 10 to 19 minutes (%)
Travel time to work - 10 to 19 minutes (% change since 2000)
Travel time to work - 20 to 29 minutes (%)
Travel time to work - 20 to 29 minutes (% change since 2000)
Travel time to work - 30 to 39 minutes (%)
Travel time to work - 30 to 39 minutes (% change since 2000)
Travel time to work - 40 to 59 minutes (%)
Travel time to work - 40 to 59 minutes (% change since 2000)
Travel time to work - 60 to 89 minutes (%)
Travel time to work - 60 to 89 minutes (% change since 2000)
Travel time to work - 90 or more minutes (%)
Travel time to work - 90 or more minutes (% change since 2000)
Latest news about work in Townsend, DE collected exclusively by city-data.com from local newspapers, TV, and radio stations
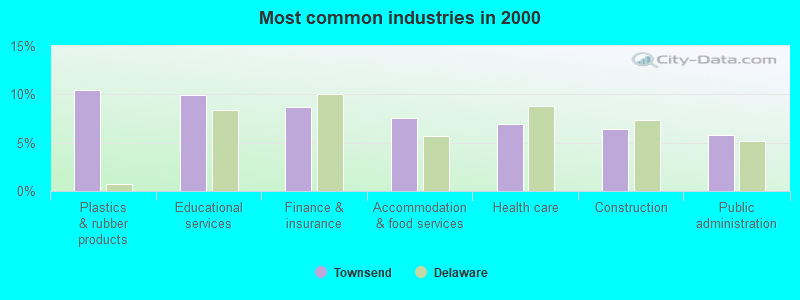
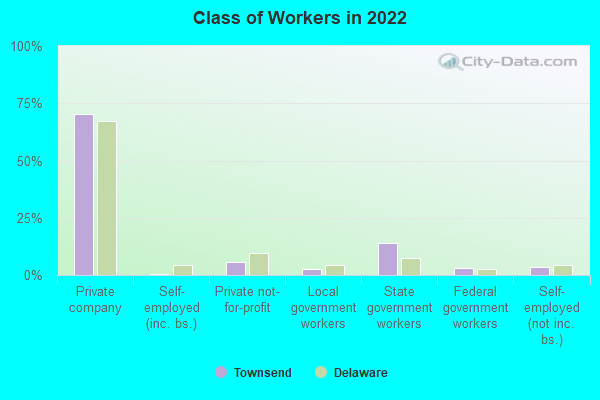
The most common industries in Townsend are: Plastics & rubber products (10.5% of civilian employees), Educational services (9.9% of civilian employees), Finance & insurance (8.7% of civilian employees). 82.6% of workers work in New Castle County and 27.7% of all workers work at home. 70.2% of workers are employees of private companies, which is 4.4% greater than the rate of 67.1% across the entire state of Delaware.
Whole page based on the data from 2000 / 2022 when the population of Townsend, Delaware was 346 / 2,752
Most common industries
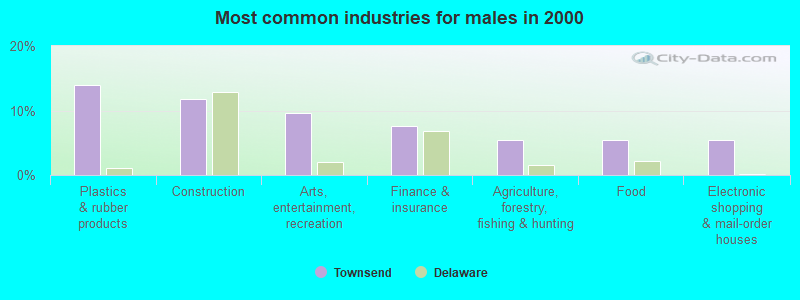
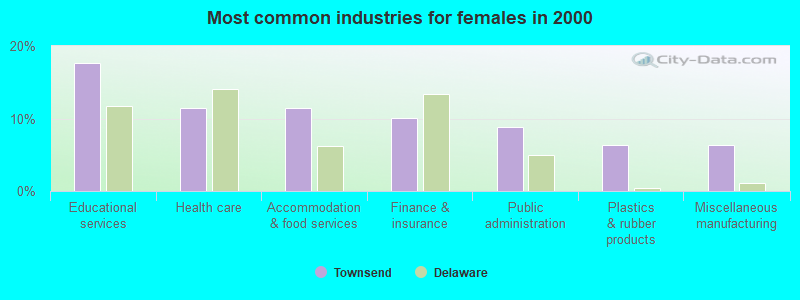
Most common industries Industry All Males Females
Plastics and rubber products 10.5% 14.0% 6.3% Educational services 9.9% 3.2% 17.7% Finance and insurance 8.7% 7.5% 10.1% Accommodation and food services 7.6% 4.3% 11.4% Health care 7.0% 3.2% 11.4% Construction 6.4% 11.8% 0.0% Public administration 5.8% 3.2% 8.9% Arts, entertainment, and recreation 5.2% 9.7% 0.0% Personal and laundry services 4.1% 3.2% 5.1% Agriculture, forestry, fishing and hunting 3.5% 5.4% 1.3% Food 2.9% 5.4% 0.0% Miscellaneous manufacturing 2.9% 0.0% 6.3% Electronic shopping and mail-order houses 2.9% 5.4% 0.0% Other transportation, and support activities, and couriers 2.9% 2.2% 3.8% Metal and metal products 2.3% 3.2% 1.3% Truck transportation 2.3% 0.0% 5.1% Repair and maintenance 1.7% 3.2% 0.0% Miscellaneous nondurable goods merchant wholesalers 1.2% 0.0% 2.5% Transportation equipment 1.2% 2.2% 0.0% Chemicals 1.2% 2.2% 0.0% Food and beverage stores 1.2% 2.2% 0.0% Retail florists 1.2% 2.2% 0.0% Used merchandise, gift, novelty, and souvenir, and other miscellaneous stores 1.2% 0.0% 2.5% Broadcasting and telecommunications 1.2% 2.2% 0.0% Real estate and rental and leasing 1.2% 2.2% 0.0% Professional, scientific, and technical services 1.2% 0.0% 2.5% Nonmetallic mineral products 0.6% 1.1% 0.0% Professional and commercial equipment and supplies merchant wholesalers 0.6% 0.0% 1.3% Computer and electronic products 0.6% 0.0% 1.3% Motor vehicle and parts dealers 0.6% 0.0% 1.3% Social assistance 0.6% 1.1% 0.0%
Unemployment in Townsend Unemployment by race in 2022
Unemployment rate for White non-Hispanic residents 2.0% Males5.5% FemalesUnemployment rate for Black residents 0.3% Males1.5% FemalesUnemployment rate for other race residents 47.8% FemalesUnemployment rate for Hispanic or Latino residents 22.1% FemalesUnemployment by race in 2000
Unemployment rate for White non-Hispanic residents 1.5% Females
Time leaving home to go to work 12:00 a.m. to 4:59 a.m.: Townsend:
4.9% (53)Delaware:
4.5% (18,770)
5:00 a.m. to 5:29 a.m.: Townsend:
1.5% (16)Delaware:
2.9% (12,265)
5:30 a.m. to 5:59 a.m.: Townsend:
6.1% (67)Delaware:
5.5% (23,080)
6:00 a.m. to 6:29 a.m.: Townsend:
9.9% (108)Delaware:
7.6% (31,782)
6:30 a.m. to 6:59 a.m.: Townsend:
4.9% (54)Delaware:
11.7% (48,961)
7:00 a.m. to 7:29 a.m.: Townsend:
25.6% (280)Delaware:
16.0% (67,035)
7:30 a.m. to 7:59 a.m.: Townsend:
7.7% (84)Delaware:
12.0% (49,956)
8:00 a.m. to 8:29 a.m.: Townsend:
6.8% (74)Delaware:
11.6% (48,568)
8:30 a.m. to 8:59 a.m.: Townsend:
5.4% (59)Delaware:
4.8% (20,249)
9:00 a.m. to 9:59 a.m.: Townsend:
6.8% (74)Delaware:
5.8% (24,361)
11:00 a.m. to 11:59 a.m.: Townsend:
0.3% (3)Delaware:
1.4% (5,871)
12:00 p.m. to 3:59 p.m.: Townsend:
11.2% (122)Delaware:
6.2% (26,082)
4:00 p.m. to 11:59 p.m.: Townsend:
8.0% (88)Delaware:
7.1% (29,682)
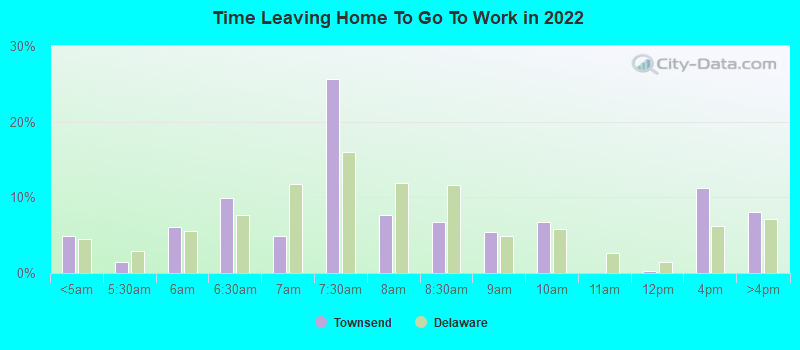
<5am: Townsend:
5.5% (9)Delaware:
2.8% (10,365)
5:30am: Townsend:
14.0% (23)Delaware:
2.2% (8,081)
6am: Townsend:
5.5% (9)Delaware:
3.5% (13,243)
6:30am: Townsend:
7.9% (13)Delaware:
7.7% (28,805)
7am: Townsend:
15.9% (26)Delaware:
11.4% (42,698)
7:30am: Townsend:
19.5% (32)Delaware:
16.6% (61,926)
8am: Townsend:
4.9% (8)Delaware:
16.2% (60,395)
8:30am: Townsend:
1.2% (2)Delaware:
10.6% (39,554)
9am: Townsend:
1.2% (2)Delaware:
5.0% (18,691)
10am: Townsend:
1.2% (2)Delaware:
4.7% (17,404)
12pm: Townsend:
1.8% (3)Delaware:
1.0% (3,667)
4pm: Townsend:
16.5% (27)Delaware:
6.9% (25,586)
>4pm: Townsend:
4.9% (8)Delaware:
6.4% (24,008)
12:00 a.m. to 4:59 a.m. - Males: Townsend:
4.4% (30)Delaware:
6.1% (13,359)
5:00 a.m. to 5:29 a.m. - Males: Townsend:
2.7% (18)Delaware:
4.3% (9,377)
5:30 a.m. to 5:59 a.m. - Males: Townsend:
9.3% (63)Delaware:
7.0% (15,329)
6:00 a.m. to 6:29 a.m. - Males: Townsend:
10.1% (68)Delaware:
9.1% (19,990)
6:30 a.m. to 6:59 a.m. - Males: Townsend:
1.9% (13)Delaware:
11.8% (26,094)
7:00 a.m. to 7:29 a.m. - Males: Townsend:
37.8% (256)Delaware:
15.5% (34,275)
7:30 a.m. to 7:59 a.m. - Males: Townsend:
3.2% (22)Delaware:
10.2% (22,481)
8:00 a.m. to 8:29 a.m. - Males: Townsend:
3.4% (23)Delaware:
10.4% (23,027)
8:30 a.m. to 8:59 a.m. - Males: Townsend:
4.1% (27)Delaware:
4.4% (9,640)
9:00 a.m. to 9:59 a.m. - Males: Townsend:
3.7% (25)Delaware:
4.9% (10,697)
11:00 a.m. to 11:59 a.m. - Males: Townsend:
0.5% (3)Delaware:
1.1% (2,526)
12:00 p.m. to 3:59 p.m. - Males: Townsend:
10.5% (71)Delaware:
5.4% (12,011)
4:00 p.m. to 11:59 p.m. - Males: Townsend:
7.9% (53)Delaware:
7.4% (16,430)
12:00 a.m. to 4:59 a.m. - Females: Townsend:
5.7% (24)Delaware:
2.7% (5,411)
5:30 a.m. to 5:59 a.m. - Females: Townsend:
1.8% (8)Delaware:
3.9% (7,751)
6:00 a.m. to 6:29 a.m. - Females: Townsend:
9.3% (39)Delaware:
6.0% (11,792)
6:30 a.m. to 6:59 a.m. - Females: Townsend:
9.7% (41)Delaware:
11.6% (22,867)
7:00 a.m. to 7:29 a.m. - Females: Townsend:
8.6% (36)Delaware:
16.6% (32,760)
7:30 a.m. to 7:59 a.m. - Females: Townsend:
14.2% (60)Delaware:
13.9% (27,475)
8:00 a.m. to 8:29 a.m. - Females: Townsend:
11.7% (49)Delaware:
13.0% (25,541)
8:30 a.m. to 8:59 a.m. - Females: Townsend:
7.5% (32)Delaware:
5.4% (10,609)
9:00 a.m. to 9:59 a.m. - Females: Townsend:
12.2% (51)Delaware:
6.9% (13,664)
12:00 p.m. to 3:59 p.m. - Females: Townsend:
11.7% (49)Delaware:
7.1% (14,071)
4:00 p.m. to 11:59 p.m. - Females: Townsend:
8.3% (35)Delaware:
6.7% (13,252)
Travel time to work Percentage of workers working in this county: 82.6%Number of people working at home: 440 (27.7% of all workers )
Less than 5 minutes: Townsend:
3.7% (6)Delaware:
2.6% (9,817)
5 to 9 minutes: Townsend:
4.9% (8)Delaware:
9.9% (37,056)
10 to 14 minutes: Townsend:
4.9% (8)Delaware:
15.2% (56,533)
15 to 19 minutes: Townsend:
11.6% (19)Delaware:
17.5% (65,194)
20 to 24 minutes: Townsend:
9.8% (16)Delaware:
16.5% (61,600)
25 to 29 minutes: Townsend:
2.4% (4)Delaware:
6.7% (25,011)
30 to 34 minutes: Townsend:
19.5% (32)Delaware:
12.0% (44,932)
35 to 39 minutes: Townsend:
4.9% (8)Delaware:
2.3% (8,671)
40 to 44 minutes: Townsend:
12.2% (20)Delaware:
2.6% (9,805)
45 to 59 minutes: Townsend:
13.4% (22)Delaware:
5.6% (20,867)
60 to 89 minutes: Townsend:
4.3% (7)Delaware:
3.8% (14,200)
90 or more minutes: Townsend:
8.5% (14)Delaware:
2.2% (8,293)
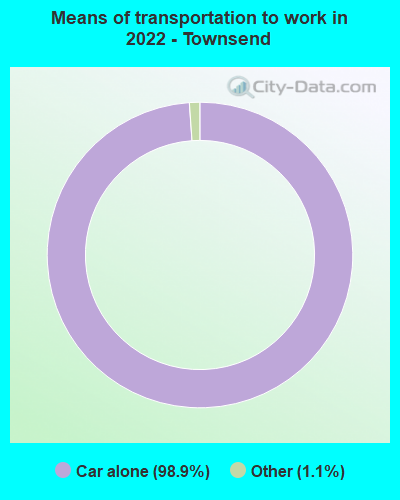
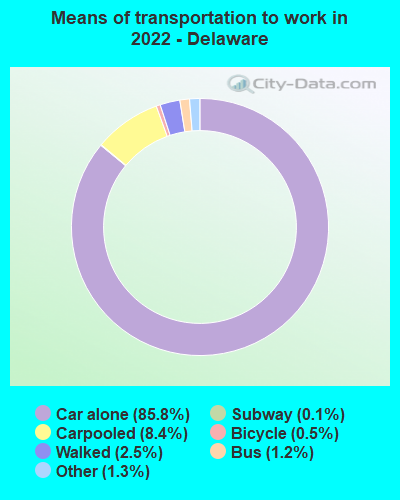
Means of transportation to work Drove car alone: Townsend:
98.9% (182)Delaware:
85.8% (169,034)
Other means: Townsend:
1.1% (2)Delaware:
1.3% (2,053)
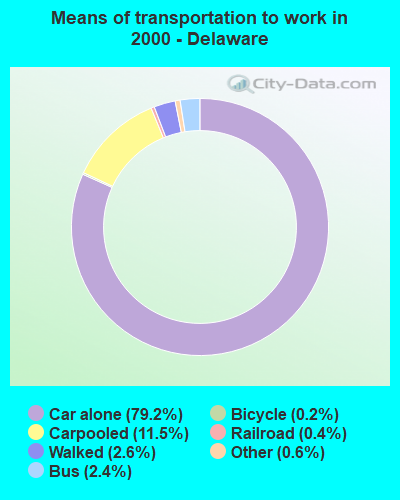
Drove car alone: Townsend:
77.4% (127)Delaware:
79.2% (295,413)
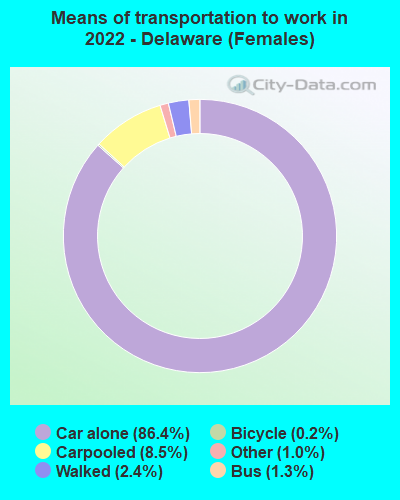
Carpooled: Townsend:
17.1% (28)Delaware:
11.5% (42,990)
Bus or trolley bus: Townsend:
2.4% (4)Delaware:
2.4% (8,770)
Walked: Townsend:
3.0% (5)Delaware:
2.6% (9,637)
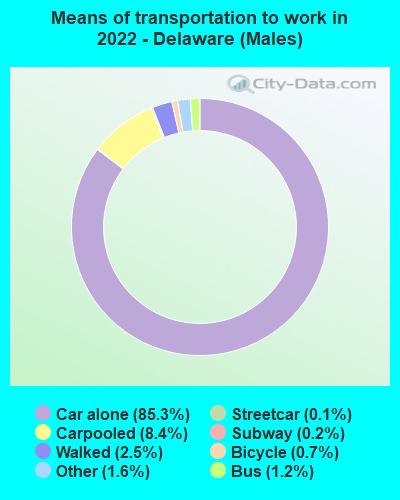
Drove car alone - Males: Townsend:
98.7% (165)Delaware:
85.3% (169,034)
Other means - Males: Townsend:
1.3% (2)Delaware:
1.6% (2,053)
Drove car alone - Females: Townsend:
100.0% (20)Delaware:
86.4% (169,034)
Private vehicle occupancy Drove alone: Townsend:
90.5% (869)Delaware:
91.1% (357,857)
In 2 person carpool: Townsend:
7.0% (67)Delaware:
6.2% (24,360)
In 3 person carpool: Townsend:
0.4% (4)Delaware:
1.7% (6,592)
In 5-6 person carpool: Townsend:
1.0% (10)Delaware:
0.4% (1,605)
Drove alone: Townsend:
81.9% (127)Delaware:
87.3% (295,413)
In 2 person carpool: Townsend:
12.9% (20)Delaware:
10.1% (34,179)
In 3 person carpool: Townsend:
5.2% (8)Delaware:
1.6% (5,574)
Class of workers
Employee of private company: Townsend:
70.2% (1,126)Delaware:
67.1% (334,862)
Self-employed in own incorporated business: Townsend:
0.3% (4)Delaware:
4.4% (21,905)
Private not-for-profit wage and salary workers: Townsend:
5.8% (93)Delaware:
9.8% (48,848)
Local government workers: Townsend:
2.8% (45)Delaware:
4.3% (21,448)
State government workers: Townsend:
14.1% (227)Delaware:
7.5% (37,360)
Federal government workers: Townsend:
3.0% (48)Delaware:
2.5% (12,299)
Self-employed workers in own not incorporated business: Townsend:
3.6% (57)Delaware:
4.3% (21,479)
Unpaid family workers: Townsend:
0.2% (3)Delaware:
0.1% (520)
Employee of private company: Townsend:
65.7% (113)Delaware:
70.4% (265,154)
Local government workers: Townsend:
7.6% (13)Delaware:
2.8% (10,645)
State government workers: Townsend:
18.0% (31)Delaware:
8.8% (33,093)
Federal government workers: Townsend:
2.9% (5)Delaware:
2.2% (8,305)
Self-employed workers in own not incorporated business: Townsend:
5.8% (10)Delaware:
5.0% (18,686)
Employee of private company - Males: Townsend:
80.3% (623)Delaware:
72.0% (184,648)
Self-employed in own incorporated business - Males: Townsend:
0.5% (4)Delaware:
5.7% (14,494)
Private not-for-profit wage and salary workers - Males: Townsend:
2.4% (19)Delaware:
6.6% (16,969)
Local government workers - Males: Townsend:
3.5% (27)Delaware:
2.8% (7,098)
State government workers - Males: Townsend:
4.4% (34)Delaware:
5.4% (13,924)
Federal government workers - Males: Townsend:
3.6% (28)Delaware:
2.6% (6,619)
Self-employed workers in own not incorporated business - Males: Townsend:
4.7% (37)Delaware:
4.8% (12,219)
Unpaid family workers - Males: Townsend:
0.4% (3)Delaware:
0.1% (327)
Employee of private company - Females: Townsend:
60.7% (502)Delaware:
62.0% (150,214)
Private not-for-profit wage and salary workers - Females: Townsend:
9.0% (74)Delaware:
13.2% (31,879)
Local government workers - Females: Townsend:
2.1% (18)Delaware:
5.9% (14,350)
State government workers - Females: Townsend:
23.2% (192)Delaware:
9.7% (23,436)
Federal government workers - Females: Townsend:
2.4% (20)Delaware:
2.3% (5,680)
Self-employed workers in own not incorporated business - Females: Townsend:
2.5% (21)Delaware:
3.8% (9,260)