Estimated zip code population in 2022: 1,696 Zip code population in 2010: 1,308 Zip code population in 2000: 1,263
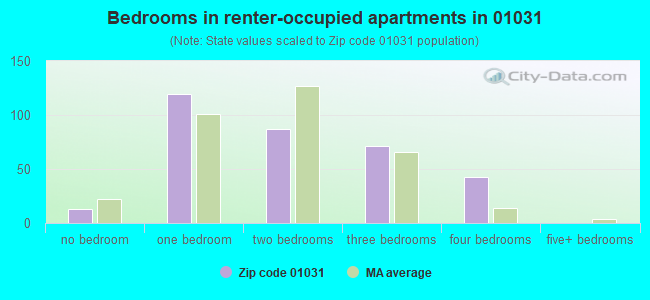
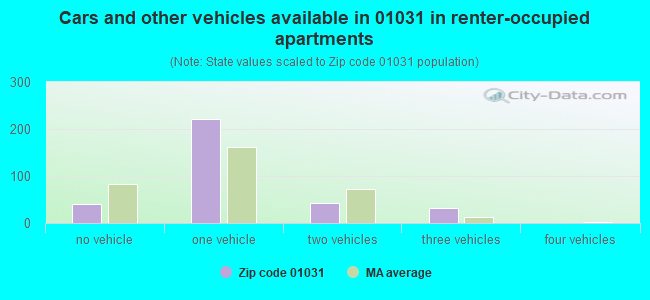
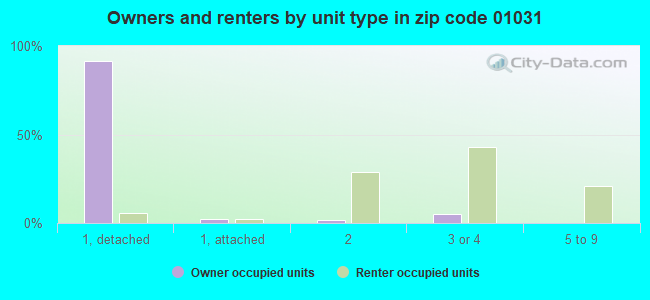
Houses and condos: 740 Renter-occupied apartments: 333
% of renters here:
48%
State:
38%
March 2022 cost of living index in zip code 01031: 113.5 (more than average, U.S. average is 100)
Land area: 8.1 sq. mi. Water area: 0.0 sq. mi.
Population density: 210 people per square mile
(very low).
OSM Map
Google Map
MSN Map
OSM Map
General Map
Google Map
MSN Map
OSM Map
Google Map
MSN Map
OSM Map
Google Map
MSN Map
Please wait while loading the map...
Real estate property taxes paid for housing units in 2022:
This zip code:
1.4% ($3,595)
Massachusetts:
1.0% ($5,536)
Median real estate property taxes paid for housing units with mortgages in 2022: $4,055 (1.5%) Median real estate property taxes paid for housing units with no mortgage in 2022: $3,119 (1.3%)
Business Search- 14 Million verified businesses
Males: 939
(55.4%)
Females: 757
(44.6%)
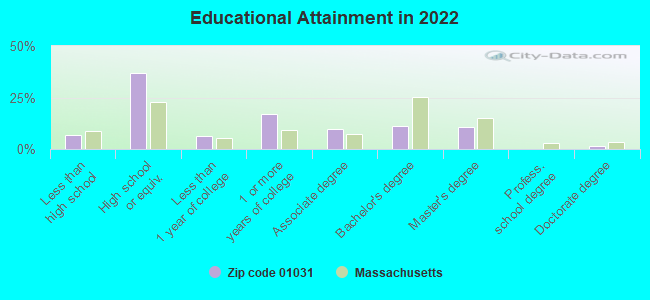
For population 25 years and over in 01031:
High school or higher: 91.4%
Bachelor's degree or higher: 22.7%
Graduate or professional degree: 11.9%
Unemployed: 0.6%
Mean travel time to work (commute): 28.6 minutes
For population 15 years and over in 01031:
Never married: 28.4%
Now married: 55.1%
Separated: 5.6%
Widowed: 4.6%
Divorced: 6.4%
Zip code 01031 compared to state average:
Median household income below state average.
Median house value below state average.
Unemployed percentage significantly below state average.
Black race population percentage significantly below state average.
Median age below state average.
Foreign-born population percentage significantly below state average.
Length of stay since moving in above state average.
Percentage of population with a bachelor's degree or higher significantly below state average.
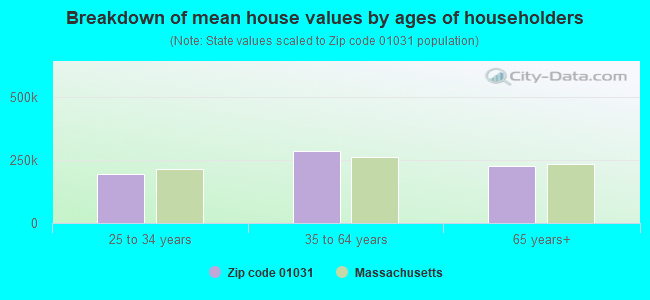
Estimated median house/condo value in 2022: $256,687
01031:
$256,687
Massachusetts:
$534,700
According to our research of Massachusetts and other state lists, there was 1 registered sex offender living in 01031 zip code as of June 16, 2024. The ratio of all residents to sex offenders in zip code 01031 is 1,209 to 1.
Median resident age:
This zip code:
35.9 years
Massachusetts median age:
40.3 years
Average household size:
This zip code:
2.5 people
Massachusetts:
2.4 people
Averages for the 2020 tax year for zip code 01031, filed in 2021:
Average Adjusted Gross Income (AGI) in 2020: $50,023 (Individual Income Tax Returns)
Here:
$50,023
State:
$105,130
Salary/wage: $45,115 (reported on 82.5% of returns)
Here:
$45,115
State:
$82,951
(% of AGI for various income ranges: 945.8% for AGIs below $25k, 3474.0% for AGIs $25k-50k, 6610.0% for AGIs $50k-75k, 10207.5% for AGIs $75k-100k, 20493.3% for AGIs $100k-200k)
Taxable interest for individuals: $363 (reported on 33.3% of returns)
This zip code:
$363
Massachusetts:
$2,361
(% of AGI for various income ranges: 5.0% for AGIs below $25k, 10.0% for AGIs $25k-50k, 17.1% for AGIs $50k-75k, 37.5% for AGIs $75k-100k, 70.0% for AGIs $100k-200k)
Ordinary dividends: $520 (reported on 8.8% of returns)
Here:
$520
State:
$10,365
(% of AGI for various income ranges: 15.0% for AGIs below $25k, 20.0% for AGIs $75k-100k)
Net capital gain/loss in AGI: +$550 (reported on 7.0% of returns)
Here:
+$550
State:
+$48,178
(% of AGI for various income ranges: 31.4% for AGIs $50k-75k)
Profit/loss from business: +$3,040 (reported on 8.8% of returns)
Here:
+$3,040
State:
+$20,792
(% of AGI for various income ranges: 155.0% for AGIs below $25k)
Taxable individual retirement arrangement distribution: $10,375 (reported on 7.0% of returns)
01031:
$10,375
Massachusetts:
$22,790
(% of AGI for various income ranges: 276.7% for AGIs $25k-50k)
Earned income credit: $1,920 (reported on 17.5% of returns)
Here:
$1,920
State:
$1,909
(% of AGI for various income ranges: 63.3% for AGIs below $25k, 77.3% for AGIs $25k-50k)
Percentage of individuals using paid preparers for their 2020 taxes: 96.5%
Here:
96%
State:
92%
(% for various income ranges: 93.8% for AGIs below $25k, 94.7% for AGIs $25k-50k, 100.0% for AGIs $50k-75k, 100.0% for AGIs $75k-100k, 100.0% for AGIs $100k-200k)
Averages for the 2012 tax year for zip code 01031, filed in 2013:
Average Adjusted Gross Income (AGI) in 2012: $41,485 (Individual Income Tax Returns)
Here:
$41,485
State:
$81,425
Salary/wage: $37,591 (reported on 86.8% of returns)
Here:
$37,591
State:
$64,752
(% of AGI for various income ranges: 70.9% for AGIs below $25k, 80.7% for AGIs $25k-50k, 83.6% for AGIs $50k-75k, 78.3% for AGIs $75k-100k, 76.0% for AGIs $100k-200k)
Taxable interest for individuals: $283 (reported on 43.4% of returns)
This zip code:
$283
Massachusetts:
$2,136
(% of AGI for various income ranges: 0.5% for AGIs below $25k, 0.5% for AGIs $25k-50k, 0.2% for AGIs $50k-75k, 0.3% for AGIs $75k-100k)
Ordinary dividends: $986 (reported on 13.2% of returns)
Here:
$986
State:
$9,473
Profit/loss from business: +$4,967 (reported on 11.3% of returns)
Here:
+$4,967
State:
+$20,662
Taxable individual retirement arrangement distribution: $10,280 (reported on 9.4% of returns)
01031:
$10,280
Massachusetts:
$18,892
Total itemized deductions: $17,645 (24% of AGI, reported on 20.8% of returns)
Here:
$17,645
State:
$28,907
Here:
23.6% of AGI
State:
18.2% of AGI
(% of AGI for various income ranges: 8.6% for AGIs $25k-50k, 15.8% for AGIs $50k-75k, 14.2% for AGIs $100k-200k)
Charity contributions: $1,533 (reported on 17.0% of returns)
Here:
$1,533
State:
$4,208
(% of AGI for various income ranges: 0.5% for AGIs $25k-50k, 0.9% for AGIs $50k-75k, 1.3% for AGIs $100k-200k)
Taxes paid: $6,755 (reported on 20.8% of returns)
01031:
$6,755
State:
$13,303
(% of AGI for various income ranges: 3.3% for AGIs $25k-50k, 5.4% for AGIs $50k-75k, 6.1% for AGIs $100k-200k)
Earned income credit: $2,200 (reported on 18.9% of returns)
Here:
$2,200
State:
$1,971
(% of AGI for various income ranges: 6.5% for AGIs below $25k, 1.0% for AGIs $25k-50k)
Percentage of individuals using paid preparers for their 2012 taxes: 52.8%
Here:
53%
State:
56%
(% for various income ranges: 57.1% for AGIs below $25k, 53.3% for AGIs $25k-50k, 50.0% for AGIs $50k-75k, 40.0% for AGIs $75k-100k, 50.0% for AGIs $100k-200k)
Averages for the 2004 tax year for zip code 01031, filed in 2005:
Average Adjusted Gross Income (AGI) in 2004: $38,978 (Individual Income Tax Returns)
Here:
$38,978
State:
$62,877
Salary/wage: $36,697 (reported on 86.5% of returns)
Here:
$36,697
State:
$52,969
(% of AGI for various income ranges: 79.0% for AGIs below $10k, 76.0% for AGIs $10k-25k, 88.2% for AGIs $25k-50k, 82.4% for AGIs $50k-75k, 84.4% for AGIs $75k-100k, 70.2% for AGIs over 100k)
Taxable interest for individuals: $559 (reported on 56.6% of returns)
This zip code:
$559
Massachusetts:
$1,945
(% of AGI for various income ranges: 8.2% for AGIs below $10k, 1.1% for AGIs $10k-25k, 0.4% for AGIs $25k-50k, 0.9% for AGIs $50k-75k, 0.3% for AGIs $75k-100k, 0.6% for AGIs over 100k)
Taxable dividends: $279 (reported on 19.2% of returns)
Here:
$279
State:
$5,323
(% of AGI for various income ranges: 0.7% for AGIs $10k-25k, 0.1% for AGIs $25k-50k, 0.1% for AGIs $50k-75k, 0.0% for AGIs $75k-100k, 0.1% for AGIs over 100k)
Net capital gain/loss: +$5,121 (reported on 10.7% of returns)
Here:
+$5,121
State:
+$20,377
(% of AGI for various income ranges: -0.1% for AGIs $10k-25k, 0.3% for AGIs $50k-75k, 6.6% for AGIs $75k-100k)
Profit/loss from business: +$5,361 (reported on 11.3% of returns)
Here:
+$5,361
State:
+$17,837
(% of AGI for various income ranges: 6.3% for AGIs $10k-25k, 1.7% for AGIs $25k-50k, 1.6% for AGIs $50k-75k, 0.1% for AGIs $75k-100k)
IRA payment deduction: $3,357 (reported on 2.6% of returns)
01031:
$3,357
Massachusetts:
$3,100
Total itemized deductions: $14,205 (20% of AGI, reported on 24.4% of returns)
Here:
$14,205
State:
$22,573
Here:
19.6% of AGI
State:
19.5% of AGI
(% of AGI for various income ranges: 5.8% for AGIs $10k-25k, 5.4% for AGIs $25k-50k, 8.9% for AGIs $50k-75k, 13.4% for AGIs $75k-100k, 11.8% for AGIs over 100k)
Charity contributions deductions: $1,369 (2% of AGI, reported on 20.5% of returns)
Here:
$1,369
State:
$3,295
Here:
1.8% of AGI
State:
2.7% of AGI
(% of AGI for various income ranges: 1.9% for AGIs below $10k, 0.4% for AGIs $25k-50k, 0.7% for AGIs $50k-75k, 1.0% for AGIs $75k-100k, 1.1% for AGIs over 100k)
Total tax: $4,540 (reported on 77.1% of returns)
01031:
$4,540
State:
$11,494
(% of AGI for various income ranges: 2.7% for AGIs below $10k, 4.5% for AGIs $10k-25k, 7.2% for AGIs $25k-50k, 9.1% for AGIs $50k-75k, 10.2% for AGIs $75k-100k, 14.0% for AGIs over 100k)
Earned income credit: $1,597 (reported on 11.5% of returns)
Here:
$1,597
State:
$1,518
Percentage of individuals using paid preparers for their 2004 taxes: 54.7%
Here:
55%
State:
58%
(% for various income ranges: 53.1% for AGIs below $10k, 49.6% for AGIs $10k-25k, 51.7% for AGIs $25k-50k, 59.5% for AGIs $50k-75k, 68.6% for AGIs $75k-100k, 61.5% for AGIs over 100k)
Size of family households: 172 2-persons, 37 3-persons, 127 4-persons, 40 5-persons, 16 6-persons, 16 7-or-more-persons
Size of nonfamily households: 255 1-person, 12 2-persons, 9 3-persons
356 married couples with children.
108 single-parent households (10 men, 98 women).
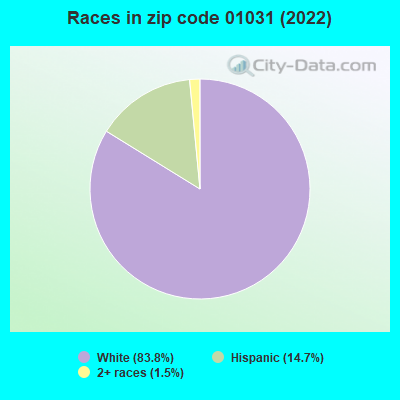
89.5% of residents of 01031 zip code speak English at home.
9.1% of residents speak Spanish at home (100% very well).
0.2% of residents speak other Indo-European language at home (100% very well).
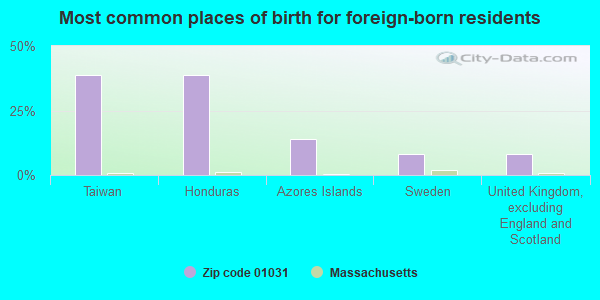
Foreign born population: 37 (2.2%) (69.9% of them are naturalized citizens)
This zip code:
2.2%
Whole state:
18.0%
39%Taiwan
39%Honduras
14%Azores Islands
8%Sweden
8%United Kingdom, excluding England and Scotland
47%Italian
12%American
5%Polish
4%Irish
4%French
3%English
2%German
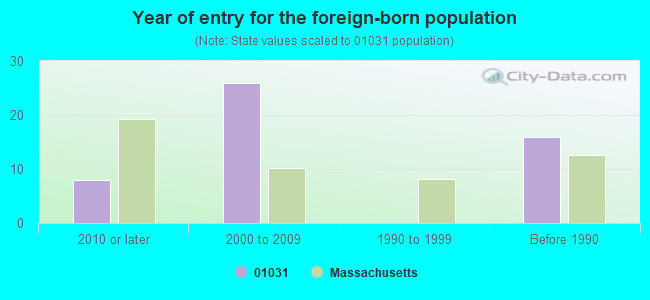
Year of entry for the foreign-born population
82010 or later
262000 to 2009
01990 to 1999
16Before 1990
Public elementary/middle school in in zip code 01031 not listed on the city page:
62% of the 01031 zip code residents lived in the same house 5 years ago. Out of people who lived in different houses, 62% lived in this county. Out of people who lived in different counties, 50% lived in Massachusetts.
98% of the 01031 zip code residents lived in the same house 1 year ago. Out of people who lived in different houses, 11% moved from this county. Out of people who lived in different houses, 61% moved from different county within same state. Out of people who lived in different houses, 39% moved from different state.
Private vs. public school enrollment:
Students in private schools in grades 1 to 8 (elementary and middle school): 26
Here:
9.6%
Massachusetts:
10.3%
Students in private schools in grades 9 to 12 (high school):
Here:
0.0%
Massachusetts:
12.3%
Students in private undergraduate colleges: 29
Here:
25.7%
Massachusetts:
51.2%
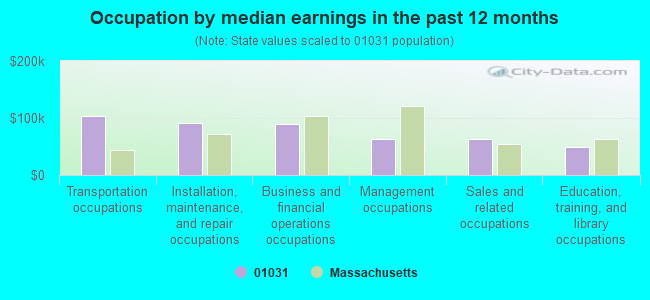
Occupation by median earnings in the past 12 months ($)
103,762Transportation occupations
90,805Installation, maintenance, and repair occupations
88,704Business and financial operations occupations
63,148Management occupations
62,658Sales and related occupations
49,821Education, training, and library occupations
Top industries in this zip code by the number of employees in 2005:
Administrative and Support and Waste Management and Remediation Services: Septic Tank and Related Services (10-19 employees: 1 establishment)
Other Services (except Public Administration): Civic and Social Organizations (1-4: 2)
Other Services (except Public Administration): General Automotive Repair (1-4: 2)
Educational Services: Elementary and Secondary Schools (1-4: 1)
Home Mortgage Disclosure Act Aggregated Statistics For Year 2009 (Based on 2 partial tracts)
A) FHA, FSA/RHS & VA Home Purchase Loans
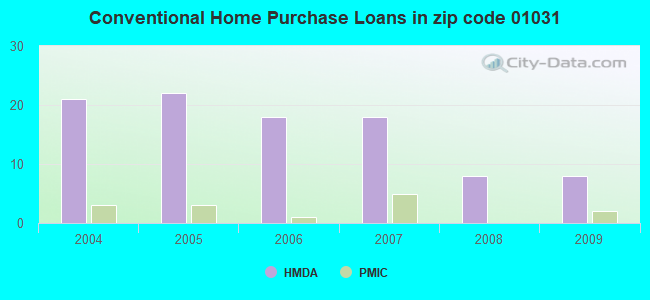
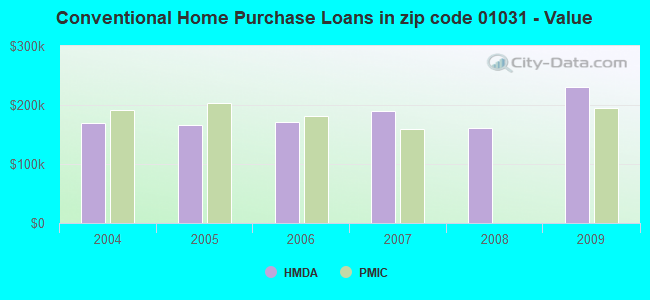
B) Conventional Home Purchase Loans
C) Refinancings
D) Home Improvement Loans
F) Non-occupant Loans on < 5 Family Dwellings (A B C & D)
Number
Average Value
Number
Average Value
Number
Average Value
Number
Average Value
Number
Average Value
LOANS ORIGINATED
6
$170,007
8
$230,728
29
$183,493
4
$109,668
2
$194,965
APPLICATIONS APPROVED, NOT ACCEPTED
0
$0
0
$0
2
$287,860
1
$55,450
0
$0
APPLICATIONS DENIED
1
$216,510
2
$145,870
10
$229,757
2
$128,740
0
$0
APPLICATIONS WITHDRAWN
0
$0
1
$79,820
4
$190,375
0
$0
0
$0
FILES CLOSED FOR INCOMPLETENESS
0
$0
0
$0
2
$259,425
0
$0
0
$0
Aggregated Statistics For Year 2008 (Based on 2 partial tracts)
A) FHA, FSA/RHS & VA Home Purchase Loans
B) Conventional Home Purchase Loans
C) Refinancings
D) Home Improvement Loans
F) Non-occupant Loans on < 5 Family Dwellings (A B C & D)
Number
Average Value
Number
Average Value
Number
Average Value
Number
Average Value
Number
Average Value
LOANS ORIGINATED
2
$169,535
8
$160,661
23
$153,627
3
$75,350
3
$159,530
APPLICATIONS APPROVED, NOT ACCEPTED
0
$0
0
$0
3
$144,813
1
$119,730
0
$0
APPLICATIONS DENIED
1
$163,530
1
$136,340
13
$167,009
2
$63,755
1
$134,220
APPLICATIONS WITHDRAWN
0
$0
0
$0
5
$228,026
0
$0
0
$0
FILES CLOSED FOR INCOMPLETENESS
0
$0
0
$0
1
$368,740
0
$0
0
$0
Aggregated Statistics For Year 2007 (Based on 2 partial tracts)
B) Conventional Home Purchase Loans
C) Refinancings
D) Home Improvement Loans
F) Non-occupant Loans on < 5 Family Dwellings (A B C & D)
Number
Average Value
Number
Average Value
Number
Average Value
Number
Average Value
LOANS ORIGINATED
18
$189,433
30
$165,062
9
$73,780
3
$144,693
APPLICATIONS APPROVED, NOT ACCEPTED
2
$167,415
5
$234,948
1
$151,170
0
$0
APPLICATIONS DENIED
4
$219,602
21
$180,182
2
$83,180
1
$131,390
APPLICATIONS WITHDRAWN
1
$280,090
11
$188,192
1
$153,290
0
$0
FILES CLOSED FOR INCOMPLETENESS
0
$0
4
$170,330
0
$0
0
$0
Aggregated Statistics For Year 2006 (Based on 2 partial tracts)
B) Conventional Home Purchase Loans
C) Refinancings
D) Home Improvement Loans
E) Loans on Dwellings For 5+ Families
F) Non-occupant Loans on < 5 Family Dwellings (A B C & D)
Number
Average Value
Number
Average Value
Number
Average Value
Number
Average Value
Number
Average Value
LOANS ORIGINATED
18
$171,145
33
$169,054
15
$69,345
1
$299,160
2
$119,735
APPLICATIONS APPROVED, NOT ACCEPTED
1
$307,640
6
$143,223
2
$50,510
0
$0
0
$0
APPLICATIONS DENIED
5
$190,870
25
$231,205
4
$127,328
0
$0
1
$123,620
APPLICATIONS WITHDRAWN
2
$214,040
20
$211,214
2
$74,170
0
$0
0
$0
FILES CLOSED FOR INCOMPLETENESS
1
$134,570
5
$188,608
0
$0
0
$0
0
$0
Aggregated Statistics For Year 2005 (Based on 2 partial tracts)
A) FHA, FSA/RHS & VA Home Purchase Loans
B) Conventional Home Purchase Loans
C) Refinancings
D) Home Improvement Loans
F) Non-occupant Loans on < 5 Family Dwellings (A B C & D)
G) Loans On Manufactured Home Dwelling (A B C & D)
Number
Average Value
Number
Average Value
Number
Average Value
Number
Average Value
Number
Average Value
Number
Average Value
LOANS ORIGINATED
1
$175,890
22
$165,811
35
$152,159
11
$64,893
4
$132,980
1
$147,640
APPLICATIONS APPROVED, NOT ACCEPTED
0
$0
4
$136,865
4
$185,872
0
$0
1
$216,510
0
$0
APPLICATIONS DENIED
0
$0
3
$133,863
13
$172,035
3
$38,147
1
$56,510
0
$0
APPLICATIONS WITHDRAWN
0
$0
3
$174,953
14
$185,606
2
$89,715
1
$208,390
0
$0
FILES CLOSED FOR INCOMPLETENESS
0
$0
2
$231,170
8
$189,404
0
$0
0
$0
0
$0
Aggregated Statistics For Year 2004 (Based on 2 partial tracts)
A) FHA, FSA/RHS & VA Home Purchase Loans
B) Conventional Home Purchase Loans
C) Refinancings
D) Home Improvement Loans
F) Non-occupant Loans on < 5 Family Dwellings (A B C & D)


 Nearest zip codes: 01037, 01531, 01094, 01082, 01585, 01074.
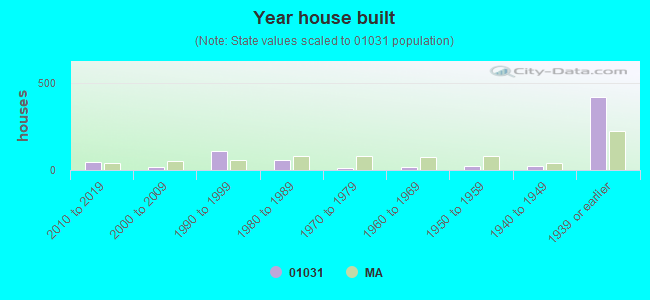


 (Students: 257, Location: 531 LOWER ROAD, Grades: KG-6)