Estimated zip code population in 2022: 983 Zip code population in 2010: 999 Zip code population in 2000: 913
Houses and condos: 432 Renter-occupied apartments: 64
% of renters here:
16%
State:
38%
March 2022 cost of living index in zip code 01531: 109.5 (more than average, U.S. average is 100)
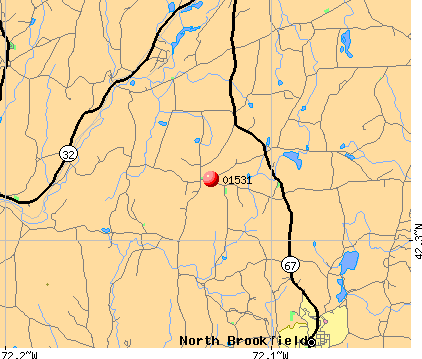
Land area: 20.8 sq. mi. Water area: 0.2 sq. mi.
Population density: 47 people per square mile
(very low).
OSM Map
Google Map
MSN Map
OSM Map
General Map
Google Map
MSN Map
OSM Map
Google Map
MSN Map
OSM Map
Google Map
MSN Map
Please wait while loading the map...
Real estate property taxes paid for housing units in 2022:
This zip code:
1.2% ($4,875)
Massachusetts:
1.0% ($5,536)
Median real estate property taxes paid for housing units with mortgages in 2022: $4,988 (1.2%) Median real estate property taxes paid for housing units with no mortgage in 2022: $4,540 (1.2%)
Business Search- 14 Million verified businesses
Males: 480
(48.8%)
Females: 503
(51.2%)
For population 25 years and over in 01531:
High school or higher: 88.4%
Bachelor's degree or higher: 36.5%
Graduate or professional degree: 13.2%
Unemployed: 2.6%
Mean travel time to work (commute): 33.5 minutes
For population 15 years and over in 01531:
Never married: 27.3%
Now married: 54.4%
Separated: 0.0%
Widowed: 5.5%
Divorced: 12.8%
Zip code 01531 compared to state average:
Black race population percentage below state average.
Hispanic race population percentage significantly below state average.
Median age significantly above state average.
Foreign-born population percentage below state average.
Renting percentage significantly below state average.
Length of stay since moving in significantly above state average.
Estimated median house/condo value in 2022: $411,053
01531:
$411,053
Massachusetts:
$534,700
According to our research of Massachusetts and other state lists, there was 1 registered sex offender living in 01531 zip code as of May 25, 2024. The ratio of all residents to sex offenders in zip code 01531 is 1,121 to 1.
Median resident age:
This zip code:
48.9 years
Massachusetts median age:
40.3 years
Average household size:
This zip code:
2.4 people
Massachusetts:
2.4 people
Averages for the 2020 tax year for zip code 01531, filed in 2021:
Average Adjusted Gross Income (AGI) in 2020: $73,734 (Individual Income Tax Returns)
Here:
$73,734
State:
$105,130
Salary/wage: $67,760 (reported on 80.0% of returns)
Here:
$67,760
State:
$82,951
(% of AGI for various income ranges: 1182.9% for AGIs below $25k, 3684.3% for AGIs $25k-50k, 7127.5% for AGIs $50k-75k, 10008.0% for AGIs $75k-100k, 15637.1% for AGIs $100k-200k)
Taxable interest for individuals: $704 (reported on 46.0% of returns)
This zip code:
$704
Massachusetts:
$2,361
(% of AGI for various income ranges: 21.4% for AGIs below $25k, 41.4% for AGIs $25k-50k, 17.5% for AGIs $50k-75k, 74.0% for AGIs $75k-100k, 105.7% for AGIs $100k-200k)
Ordinary dividends: $2,244 (reported on 18.0% of returns)
Here:
$2,244
State:
$10,365
(% of AGI for various income ranges: 90.0% for AGIs below $25k, 140.0% for AGIs $50k-75k, 118.6% for AGIs $100k-200k)
Net capital gain/loss in AGI: +$2,525 (reported on 16.0% of returns)
Here:
+$2,525
State:
+$48,178
(% of AGI for various income ranges: 22.9% for AGIs below $25k, 37.5% for AGIs $50k-75k, 244.3% for AGIs $100k-200k)
Profit/loss from business: +$20,612 (reported on 16.0% of returns)
Here:
+$20,612
State:
+$20,792
(% of AGI for various income ranges: 291.4% for AGIs below $25k, 72.5% for AGIs $50k-75k, 2022.9% for AGIs $100k-200k)
Taxable individual retirement arrangement distribution: $11,783 (reported on 12.0% of returns)
01531:
$11,783
Massachusetts:
$22,790
(% of AGI for various income ranges: 385.7% for AGIs below $25k, 874.0% for AGIs $75k-100k)
Total itemized deductions: $18,250 (reported on 8.0% of returns)
Here:
$18,250
State:
$36,722
(% of AGI for various income ranges: 1460.0% for AGIs $75k-100k)
Charity contributions: $900 (reported on 4.0% of returns)
Here:
$900
State:
$12,529
(% of AGI for various income ranges: 25.7% for AGIs $25k-50k)
Taxes paid: $7,200 (reported on 8.0% of returns)
01531:
$7,200
State:
$8,782
(% of AGI for various income ranges: 576.0% for AGIs $75k-100k)
Earned income credit: $2,050 (reported on 4.0% of returns)
Here:
$2,050
State:
$1,909
(% of AGI for various income ranges: 58.6% for AGIs below $25k)
Percentage of individuals using paid preparers for their 2020 taxes: 94.0%
Here:
94%
State:
92%
(% for various income ranges: 92.9% for AGIs below $25k, 100.0% for AGIs $25k-50k, 85.7% for AGIs $50k-75k, 100.0% for AGIs $75k-100k, 90.0% for AGIs $100k-200k, 100.0% for AGIs over 200k)
Averages for the 2012 tax year for zip code 01531, filed in 2013:
Average Adjusted Gross Income (AGI) in 2012: $59,935 (Individual Income Tax Returns)
Here:
$59,935
State:
$81,425
Salary/wage: $54,526 (reported on 81.2% of returns)
Here:
$54,526
State:
$64,752
(% of AGI for various income ranges: 65.9% for AGIs below $25k, 71.2% for AGIs $25k-50k, 71.6% for AGIs $50k-75k, 80.4% for AGIs $75k-100k, 73.9% for AGIs $100k-200k)
Taxable interest for individuals: $526 (reported on 64.6% of returns)
This zip code:
$526
Massachusetts:
$2,136
(% of AGI for various income ranges: 2.0% for AGIs below $25k, 0.5% for AGIs $25k-50k, 0.8% for AGIs $50k-75k, 0.2% for AGIs $75k-100k, 0.4% for AGIs $100k-200k)
Ordinary dividends: $2,009 (reported on 22.9% of returns)
Here:
$2,009
State:
$9,473
(% of AGI for various income ranges: 2.9% for AGIs below $25k, 1.7% for AGIs $25k-50k, 0.3% for AGIs $75k-100k, 0.6% for AGIs $100k-200k)
Profit/loss from business: +$17,933 (reported on 18.8% of returns)
Here:
+$17,933
State:
+$20,662
(% of AGI for various income ranges: 15.1% for AGIs below $25k, 16.2% for AGIs $25k-50k, 12.7% for AGIs $75k-100k)
Taxable individual retirement arrangement distribution: $10,250 (reported on 8.3% of returns)
01531:
$10,250
Massachusetts:
$18,892
Total itemized deductions: $17,396 (21% of AGI, reported on 50.0% of returns)
Here:
$17,396
State:
$28,907
Here:
20.6% of AGI
State:
18.2% of AGI
(% of AGI for various income ranges: 19.6% for AGIs below $25k, 13.4% for AGIs $25k-50k, 12.8% for AGIs $50k-75k, 15.3% for AGIs $75k-100k, 14.4% for AGIs $100k-200k)
Charity contributions: $1,382 (reported on 35.4% of returns)
Here:
$1,382
State:
$4,208
(% of AGI for various income ranges: 0.8% for AGIs $25k-50k, 0.4% for AGIs $50k-75k, 1.0% for AGIs $75k-100k, 1.0% for AGIs $100k-200k)
Taxes paid: $8,421 (reported on 50.0% of returns)
01531:
$8,421
State:
$13,303
(% of AGI for various income ranges: 7.1% for AGIs below $25k, 5.4% for AGIs $25k-50k, 5.7% for AGIs $50k-75k, 7.4% for AGIs $75k-100k, 7.8% for AGIs $100k-200k)
Earned income credit: $1,875 (reported on 8.3% of returns)
Here:
$1,875
State:
$1,971
(% of AGI for various income ranges: 4.0% for AGIs below $25k)
Percentage of individuals using paid preparers for their 2012 taxes: 64.6%
Here:
65%
State:
56%
(% for various income ranges: 56.2% for AGIs below $25k, 70.0% for AGIs $25k-50k, 57.1% for AGIs $50k-75k, 66.7% for AGIs $75k-100k, 77.8% for AGIs $100k-200k)
Averages for the 2004 tax year for zip code 01531, filed in 2005:
Average Adjusted Gross Income (AGI) in 2004: $48,231 (Individual Income Tax Returns)
Here:
$48,231
State:
$62,877
Salary/wage: $43,095 (reported on 87.1% of returns)
Here:
$43,095
State:
$52,969
(% of AGI for various income ranges: 96.2% for AGIs below $10k, 73.7% for AGIs $10k-25k, 81.2% for AGIs $25k-50k, 81.3% for AGIs $50k-75k, 81.1% for AGIs $75k-100k, 69.7% for AGIs over 100k)
Taxable interest for individuals: $520 (reported on 71.8% of returns)
This zip code:
$520
Massachusetts:
$1,945
(% of AGI for various income ranges: 2.8% for AGIs below $10k, 1.9% for AGIs $10k-25k, 0.5% for AGIs $25k-50k, 0.7% for AGIs $50k-75k, 0.7% for AGIs $75k-100k, 0.7% for AGIs over 100k)
Taxable dividends: $809 (reported on 25.1% of returns)
Here:
$809
State:
$5,323
(% of AGI for various income ranges: 0.8% for AGIs below $10k, 0.8% for AGIs $10k-25k, 0.5% for AGIs $25k-50k, 0.3% for AGIs $50k-75k, 0.2% for AGIs $75k-100k, 0.5% for AGIs over 100k)
Net capital gain/loss: +$2,053 (reported on 16.6% of returns)
Here:
+$2,053
State:
+$20,377
(% of AGI for various income ranges: -0.5% for AGIs below $10k, 0.7% for AGIs $10k-25k, 0.8% for AGIs $25k-50k, 0.8% for AGIs $50k-75k, 1.3% for AGIs over 100k)
Profit/loss from business: +$15,188 (reported on 17.5% of returns)
Here:
+$15,188
State:
+$17,837
(% of AGI for various income ranges: -0.3% for AGIs $10k-25k, 6.5% for AGIs $25k-50k, 8.3% for AGIs $50k-75k, 10.1% for AGIs $75k-100k)
IRA payment deduction: $2,500 (reported on 3.9% of returns)
01531:
$2,500
Massachusetts:
$3,100
Total itemized deductions: $15,726 (21% of AGI, reported on 45.4% of returns)
Here:
$15,726
State:
$22,573
Here:
20.6% of AGI
State:
19.5% of AGI
(% of AGI for various income ranges: 35.6% for AGIs below $10k, 14.6% for AGIs $25k-50k, 17.8% for AGIs $50k-75k, 16.3% for AGIs $75k-100k, 13.1% for AGIs over 100k)
Charity contributions deductions: $1,212 (2% of AGI, reported on 39.1% of returns)
Here:
$1,212
State:
$3,295
Here:
1.6% of AGI
State:
2.7% of AGI
(% of AGI for various income ranges: 2.8% for AGIs below $10k, 0.9% for AGIs $25k-50k, 1.0% for AGIs $50k-75k, 1.1% for AGIs $75k-100k, 1.1% for AGIs over 100k)
Total tax: $6,412 (reported on 82.8% of returns)
01531:
$6,412
State:
$11,494
(% of AGI for various income ranges: 3.3% for AGIs below $10k, 5.6% for AGIs $10k-25k, 8.0% for AGIs $25k-50k, 8.9% for AGIs $50k-75k, 11.0% for AGIs $75k-100k, 16.3% for AGIs over 100k)
Earned income credit: $931 (reported on 6.3% of returns)
Here:
$931
State:
$1,518
Percentage of individuals using paid preparers for their 2004 taxes: 64.6%
Here:
65%
State:
58%
(% for various income ranges: 60.2% for AGIs below $10k, 60.5% for AGIs $10k-25k, 61.0% for AGIs $25k-50k, 71.8% for AGIs $50k-75k, 67.7% for AGIs $75k-100k, 73.2% for AGIs over 100k)
Household received Food Stamps/SNAP in the past 12 months: 24 Household did not receive Food Stamps/SNAP in the past 12 months: 378
Women who had a birth in the past 12 months: 21 (14 now married, 6 unmarried) Women who did not have a birth in the past 12 months: 173 (72 now married, 100 unmarried)
Housing units in zip code 01531 with a mortgage: 200 (38 second mortgage, 3 home equity loan, 35 both second mortgage and home equity loan) Houses without a mortgage: 20
Median monthly owner costs for units with a mortgage: $2,131 Median monthly owner costs for units without a mortgage: $741
Residents with income below the poverty level in 2022:
This zip code:
13.6%
Whole state:
10.4%
Residents with income below 50% of the poverty level in 2022:
This zip code:
6.1%
Whole state:
5.1%
Median number of rooms in houses and condos:
Here:
6.9
State:
6.5
Median number of rooms in apartments:
Here:
4.4
State:
4.0
Notable locations in this zip code not listed on our city pages
In group quarters: 2 (-1 institutionalized population)
Size of family households: 120 2-persons, 79 3-persons, 60 4-persons, 18 5-persons, 2 6-persons
Size of nonfamily households: 103 1-person, 25 2-persons
117 married couples with children.
55 single-parent households (55 women).
93.8% of residents of 01531 zip code speak English at home.
2.0% of residents speak Spanish at home (100% very well).
0.4% of residents speak other Indo-European language at home (100% very well).
4.0% of residents speak other language at home (42% very well, 58% well).
Foreign born population: 81 (8.2%) (60.0% of them are naturalized citizens)
This zip code:
8.2%
Whole state:
18.0%
31%Kuwait
22%Haiti
15%France
5%Honduras
21%American
13%Polish
12%English
9%Irish
6%Lebanese
4%German
3%Jamaican
Year of entry for the foreign-born population
362010 or later
232000 to 2009
91990 to 1999
17Before 1990
Facilities with environmental interests located in this zip code:
NEW BRAINTREE GRADE (UTLEY RD in NEW BRAINTREE, MA)
(National Center for Education Statistics) - STATE ID-753020 Organizations: QUABBIN (SCHOOL DISTRICT)
NEW BRAINTREE (NEW BRAINTREE in NEW BRAINTREE, MA)
AIR MINOR (AIRS/AFS) Business SIC classification: GENERAL GOVERNMENT
Housing units lacking complete plumbing facilities: 0.9% Housing units lacking complete kitchen facilities: 2.8%
54.3%Fuel oil, kerosene, etc.
24.5%Wood
8.5%Bottled, tank, or LP gas
7.8%Electricity
4.3%Other fuel
0.8%Utility gas
Population in 1990: 881. Population change in the 1990s: +32 (+3.6%).
Place of birth for U.S.-born residents:
This state: 757
Northeast: 73
Midwest: 15
South: 32
West: 12
73% of the 01531 zip code residents lived in the same house 5 years ago. Out of people who lived in different houses, 74% lived in this county. Out of people who lived in different counties, 50% lived in Massachusetts.
93% of the 01531 zip code residents lived in the same house 1 year ago. Out of people who lived in different houses, 23% moved from this county. Out of people who lived in different houses, 73% moved from different county within same state. Out of people who lived in different houses, 4% moved from abroad.
Private vs. public school enrollment:
Students in private schools in grades 1 to 8 (elementary and middle school): 8
Here:
9.5%
Massachusetts:
10.3%
Students in private schools in grades 9 to 12 (high school): 4
Here:
5.7%
Massachusetts:
12.3%
Students in private undergraduate colleges: 2
Here:
29.1%
Massachusetts:
51.2%
Occupation by median earnings in the past 12 months ($)
109,720Architecture and engineering occupations
101,141Health technologists and technicians
89,496Construction and extraction occupations
82,076Health diagnosing and treating practitioners and other technical occupations
78,241Management occupations
76,882Sales and related occupations
Top industries in this zip code by the number of employees in 2005:
Construction: All Other Specialty Trade Contractors (5-9 employees: 1 establishment)
Accommodation and Food Services: Food Service Contractors (5-9: 1)
Administrative and Support and Waste Management and Remediation Services: Landscaping Services (1-4: 3)
Construction: Site Preparation Contractors (1-4: 2)
Accommodation and Food Services: Full-Service Restaurants (1-4: 1)
Other Services (except Public Administration): Religious Organizations (1-4: 1)
Construction: Framing Contractors (1-4: 1)
Professional, Scientific, and Technical Services: Graphic Design Services (1-4: 1)
People in group quarters in 2010:
4 people in workers' group living quarters and job corps centers
Home Mortgage Disclosure Act Aggregated Statistics For Year 2009 (Based on 2 partial tracts)
A) FHA, FSA/RHS & VA Home Purchase Loans
B) Conventional Home Purchase Loans
C) Refinancings
D) Home Improvement Loans
F) Non-occupant Loans on < 5 Family Dwellings (A B C & D)
Number
Average Value
Number
Average Value
Number
Average Value
Number
Average Value
Number
Average Value
LOANS ORIGINATED
10
$188,875
14
$244,129
54
$182,466
8
$101,534
5
$144,404
APPLICATIONS APPROVED, NOT ACCEPTED
1
$94,180
0
$0
5
$213,204
1
$102,680
0
$0
APPLICATIONS DENIED
3
$133,633
4
$135,050
18
$236,348
3
$158,923
0
$0
APPLICATIONS WITHDRAWN
0
$0
1
$147,800
7
$201,431
1
$13,080
0
$0
FILES CLOSED FOR INCOMPLETENESS
0
$0
1
$14,390
5
$192,146
1
$136,030
0
$0
Aggregated Statistics For Year 2008 (Based on 2 partial tracts)
A) FHA, FSA/RHS & VA Home Purchase Loans
B) Conventional Home Purchase Loans
C) Refinancings
D) Home Improvement Loans
E) Loans on Dwellings For 5+ Families
F) Non-occupant Loans on < 5 Family Dwellings (A B C & D)
G) Loans On Manufactured Home Dwelling (A B C & D)
Number
Average Value
Number
Average Value
Number
Average Value
Number
Average Value
Number
Average Value
Number
Average Value
Number
Average Value
LOANS ORIGINATED
3
$209,280
14
$169,994
42
$155,777
6
$69,760
1
$109,220
5
$177,234
0
$0
APPLICATIONS APPROVED, NOT ACCEPTED
1
$103,990
1
$135,380
5
$160,884
3
$73,903
0
$0
1
$75,210
0
$0
APPLICATIONS DENIED
2
$151,400
1
$252,440
24
$167,506
5
$47,218
1
$109,220
1
$248,520
1
$23,540
APPLICATIONS WITHDRAWN
1
$93,520
1
$139,960
10
$211,111
1
$91,560
0
$0
0
$0
0
$0
FILES CLOSED FOR INCOMPLETENESS
0
$0
1
$41,200
3
$227,593
0
$0
0
$0
0
$0
0
$0
Aggregated Statistics For Year 2007 (Based on 2 partial tracts)
A) FHA, FSA/RHS & VA Home Purchase Loans
B) Conventional Home Purchase Loans
C) Refinancings
D) Home Improvement Loans
F) Non-occupant Loans on < 5 Family Dwellings (A B C & D)
G) Loans On Manufactured Home Dwelling (A B C & D)
Number
Average Value
Number
Average Value
Number
Average Value
Number
Average Value
Number
Average Value
Number
Average Value
LOANS ORIGINATED
1
$128,180
34
$185,698
55
$166,711
17
$72,325
6
$133,962
1
$17,660
APPLICATIONS APPROVED, NOT ACCEPTED
0
$0
4
$154,998
10
$217,520
2
$139,955
0
$0
0
$0
APPLICATIONS DENIED
1
$105,950
8
$203,312
39
$179,649
3
$102,677
1
$243,290
0
$0
APPLICATIONS WITHDRAWN
0
$0
3
$172,873
20
$191,654
1
$283,840
0
$0
0
$0
FILES CLOSED FOR INCOMPLETENESS
0
$0
1
$134,070
7
$180,224
0
$0
0
$0
0
$0
Aggregated Statistics For Year 2006 (Based on 2 partial tracts)
A) FHA, FSA/RHS & VA Home Purchase Loans
B) Conventional Home Purchase Loans
C) Refinancings
D) Home Improvement Loans
E) Loans on Dwellings For 5+ Families
F) Non-occupant Loans on < 5 Family Dwellings (A B C & D)
G) Loans On Manufactured Home Dwelling (A B C & D)
Number
Average Value
Number
Average Value
Number
Average Value
Number
Average Value
Number
Average Value
Number
Average Value
Number
Average Value
LOANS ORIGINATED
1
$379,320
34
$167,770
61
$169,343
28
$68,787
1
$553,940
4
$110,852
1
$98,100
APPLICATIONS APPROVED, NOT ACCEPTED
0
$0
3
$189,877
10
$159,118
4
$46,760
0
$0
0
$0
0
$0
APPLICATIONS DENIED
1
$141,920
9
$196,346
46
$232,668
8
$117,884
0
$0
3
$76,300
0
$0
APPLICATIONS WITHDRAWN
0
$0
5
$158,530
37
$211,401
4
$68,670
1
$104,640
1
$70,630
0
$0
FILES CLOSED FOR INCOMPLETENESS
0
$0
2
$124,585
9
$194,020
0
$0
1
$94,180
0
$0
0
$0
Aggregated Statistics For Year 2005 (Based on 2 partial tracts)
A) FHA, FSA/RHS & VA Home Purchase Loans
B) Conventional Home Purchase Loans
C) Refinancings
D) Home Improvement Loans
E) Loans on Dwellings For 5+ Families
F) Non-occupant Loans on < 5 Family Dwellings (A B C & D)
G) Loans On Manufactured Home Dwelling (A B C & D)
Number
Average Value
Number
Average Value
Number
Average Value
Number
Average Value
Number
Average Value
Number
Average Value
Number
Average Value
LOANS ORIGINATED
1
$325,690
40
$168,863
65
$151,708
20
$66,086
0
$0
7
$140,703
2
$136,685
APPLICATIONS APPROVED, NOT ACCEPTED
0
$0
7
$144,814
8
$172,084
1
$13,080
1
$429,020
2
$200,450
1
$65,400
APPLICATIONS DENIED
0
$0
5
$148,720
24
$172,547
5
$42,380
0
$0
3
$34,880
1
$13,080
APPLICATIONS WITHDRAWN
0
$0
6
$161,973
27
$178,203
4
$83,058
0
$0
2
$192,930
0
$0
FILES CLOSED FOR INCOMPLETENESS
0
$0
4
$214,022
16
$175,354
1
$114,450
0
$0
0
$0
0
$0
Aggregated Statistics For Year 2004 (Based on 2 partial tracts)
A) FHA, FSA/RHS & VA Home Purchase Loans
B) Conventional Home Purchase Loans
C) Refinancings
D) Home Improvement Loans
E) Loans on Dwellings For 5+ Families
F) Non-occupant Loans on < 5 Family Dwellings (A B C & D)
G) Loans On Manufactured Home Dwelling (A B C & D)


 Nearest zip codes: 01094, 01031, 01074, 01535, 01037, 01585.


