Estimated zip code population in 2022: 4,748 Zip code population in 2010: 4,680 Zip code population in 2000: 4,683
Houses and condos: 2,099 Renter-occupied apartments: 582
% of renters here:
31%
State:
38%
March 2022 cost of living index in zip code 01535: 124.5 (high, U.S. average is 100)
Land area: 21.3 sq. mi. Water area: 0.7 sq. mi.
Population density: 223 people per square mile
(very low).
OSM Map
Google Map
MSN Map
OSM Map
General Map
Google Map
MSN Map
OSM Map
Google Map
MSN Map
OSM Map
Google Map
MSN Map
Please wait while loading the map...
Real estate property taxes paid for housing units in 2022:
This zip code:
1.1% ($3,486)
Massachusetts:
1.0% ($5,536)
Median real estate property taxes paid for housing units with mortgages in 2022: $3,544 (1.1%) Median real estate property taxes paid for housing units with no mortgage in 2022: $3,365 (1.1%)
Estimated median house/condo value in 2022: $319,892
01535:
$319,892
Massachusetts:
$534,700
According to our research of Massachusetts and other state lists, there were 3 registered sex offenders living in 01535 zip code as of May 11, 2024. The ratio of all residents to sex offenders in zip code 01535 is 1,610 to 1. The ratio of registered sex offenders to all residents in this zip code is near the state average.
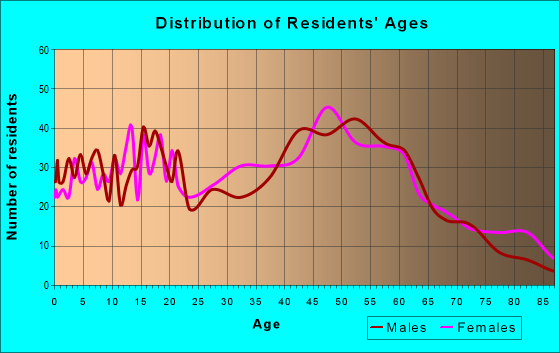
Median resident age:
This zip code:
48.3 years
Massachusetts median age:
40.3 years
Average household size:
This zip code:
2.5 people
Massachusetts:
2.4 people
Averages for the 2020 tax year for zip code 01535, filed in 2021:
Average Adjusted Gross Income (AGI) in 2020: $64,675 (Individual Income Tax Returns)
Here:
$64,675
State:
$105,130
Salary/wage: $57,254 (reported on 84.8% of returns)
Here:
$57,254
State:
$82,951
(% of AGI for various income ranges: 1179.8% for AGIs below $25k, 3670.2% for AGIs $25k-50k, 6308.8% for AGIs $50k-75k, 9011.4% for AGIs $75k-100k, 17592.1% for AGIs $100k-200k)
Taxable interest for individuals: $851 (reported on 36.0% of returns)
This zip code:
$851
Massachusetts:
$2,361
(% of AGI for various income ranges: 20.4% for AGIs below $25k, 23.4% for AGIs $25k-50k, 36.4% for AGIs $50k-75k, 58.6% for AGIs $75k-100k, 83.3% for AGIs $100k-200k)
Ordinary dividends: $4,265 (reported on 13.6% of returns)
Here:
$4,265
State:
$10,365
(% of AGI for various income ranges: 35.1% for AGIs below $25k, 14.6% for AGIs $25k-50k, 32.4% for AGIs $50k-75k, 68.6% for AGIs $75k-100k, 160.8% for AGIs $100k-200k)
Net capital gain/loss in AGI: +$8,828 (reported on 11.6% of returns)
Here:
+$8,828
State:
+$48,178
(% of AGI for various income ranges: 10.7% for AGIs below $25k, 14.8% for AGIs $25k-50k, 35.2% for AGIs $50k-75k, 42.4% for AGIs $75k-100k, 246.7% for AGIs $100k-200k)
Profit/loss from business: +$14,245 (reported on 12.4% of returns)
Here:
+$14,245
State:
+$20,792
(% of AGI for various income ranges: 62.4% for AGIs below $25k, 227.0% for AGIs $25k-50k, 370.9% for AGIs $50k-75k, 365.2% for AGIs $75k-100k, 420.4% for AGIs $100k-200k)
Taxable individual retirement arrangement distribution: $18,573 (reported on 8.8% of returns)
01535:
$18,573
Massachusetts:
$22,790
(% of AGI for various income ranges: 78.2% for AGIs below $25k, 69.6% for AGIs $25k-50k, 169.4% for AGIs $50k-75k, 268.1% for AGIs $75k-100k, 943.3% for AGIs $100k-200k)
Total itemized deductions: $21,980 (reported on 6.0% of returns)
Here:
$21,980
State:
$36,722
(% of AGI for various income ranges: 92.2% for AGIs below $25k, 171.8% for AGIs $50k-75k, 305.7% for AGIs $75k-100k, 697.1% for AGIs $100k-200k)
Charity contributions: $5,325 (reported on 3.2% of returns)
Here:
$5,325
State:
$12,529
(% of AGI for various income ranges: 30.6% for AGIs $50k-75k, 135.4% for AGIs $100k-200k)
Taxes paid: $7,273 (reported on 6.0% of returns)
01535:
$7,273
State:
$8,782
(% of AGI for various income ranges: 34.4% for AGIs below $25k, 62.4% for AGIs $50k-75k, 120.5% for AGIs $75k-100k, 198.8% for AGIs $100k-200k)
Earned income credit: $1,912 (reported on 10.4% of returns)
Here:
$1,912
State:
$1,909
(% of AGI for various income ranges: 55.1% for AGIs below $25k, 49.8% for AGIs $25k-50k)
Percentage of individuals using paid preparers for their 2020 taxes: 93.6%
Here:
94%
State:
92%
(% for various income ranges: 92.3% for AGIs below $25k, 93.8% for AGIs $25k-50k, 93.3% for AGIs $50k-75k, 93.1% for AGIs $75k-100k, 94.9% for AGIs $100k-200k, 100.0% for AGIs over 200k)
Averages for the 2012 tax year for zip code 01535, filed in 2013:
Average Adjusted Gross Income (AGI) in 2012: $51,565 (Individual Income Tax Returns)
Here:
$51,565
State:
$81,425
Salary/wage: $47,726 (reported on 86.8% of returns)
Here:
$47,726
State:
$64,752
(% of AGI for various income ranges: 72.8% for AGIs below $25k, 81.1% for AGIs $25k-50k, 81.0% for AGIs $50k-75k, 84.4% for AGIs $75k-100k, 82.5% for AGIs $100k-200k, 64.1% for AGIs over 200k)
Taxable interest for individuals: $564 (reported on 53.1% of returns)
This zip code:
$564
Massachusetts:
$2,136
(% of AGI for various income ranges: 1.0% for AGIs below $25k, 0.5% for AGIs $25k-50k, 0.6% for AGIs $50k-75k, 0.2% for AGIs $75k-100k, 0.7% for AGIs $100k-200k, 1.0% for AGIs over 200k)
Ordinary dividends: $1,895 (reported on 16.2% of returns)
Here:
$1,895
State:
$9,473
(% of AGI for various income ranges: 0.8% for AGIs below $25k, 0.6% for AGIs $25k-50k, 0.7% for AGIs $50k-75k, 0.3% for AGIs $75k-100k, 0.8% for AGIs $100k-200k)
Net capital gain/loss in AGI: +$413 (reported on 10.1% of returns)
Here:
+$413
State:
+$31,437
(% of AGI for various income ranges: 0.3% for AGIs $100k-200k)
Profit/loss from business: +$12,210 (reported on 13.6% of returns)
Here:
+$12,210
State:
+$20,662
(% of AGI for various income ranges: 8.7% for AGIs below $25k, 3.6% for AGIs $25k-50k, 4.3% for AGIs $50k-75k, 2.1% for AGIs $75k-100k, 2.3% for AGIs $100k-200k)
Taxable individual retirement arrangement distribution: $12,850 (reported on 9.6% of returns)
01535:
$12,850
Massachusetts:
$18,892
(% of AGI for various income ranges: 4.1% for AGIs below $25k, 1.9% for AGIs $25k-50k, 2.2% for AGIs $50k-75k, 1.6% for AGIs $75k-100k, 3.4% for AGIs $100k-200k)
Total itemized deductions: $17,824 (20% of AGI, reported on 35.1% of returns)
Here:
$17,824
State:
$28,907
Here:
20.5% of AGI
State:
18.2% of AGI
(% of AGI for various income ranges: 5.8% for AGIs below $25k, 7.8% for AGIs $25k-50k, 13.2% for AGIs $50k-75k, 14.2% for AGIs $75k-100k, 14.6% for AGIs $100k-200k, 11.9% for AGIs over 200k)
Charity contributions: $1,817 (reported on 26.3% of returns)
Here:
$1,817
State:
$4,208
(% of AGI for various income ranges: 0.2% for AGIs below $25k, 0.4% for AGIs $25k-50k, 0.9% for AGIs $50k-75k, 1.1% for AGIs $75k-100k, 1.2% for AGIs $100k-200k, 1.5% for AGIs over 200k)
Taxes paid: $7,569 (reported on 35.1% of returns)
01535:
$7,569
State:
$13,303
(% of AGI for various income ranges: 1.8% for AGIs below $25k, 2.8% for AGIs $25k-50k, 5.2% for AGIs $50k-75k, 5.5% for AGIs $75k-100k, 6.9% for AGIs $100k-200k, 7.0% for AGIs over 200k)
Earned income credit: $2,000 (reported on 12.3% of returns)
Here:
$2,000
State:
$1,971
(% of AGI for various income ranges: 4.2% for AGIs below $25k, 0.8% for AGIs $25k-50k)
Percentage of individuals using paid preparers for their 2012 taxes: 54.8%
Here:
55%
State:
56%
(% for various income ranges: 47.4% for AGIs below $25k, 53.4% for AGIs $25k-50k, 61.1% for AGIs $50k-75k, 61.5% for AGIs $75k-100k, 63.0% for AGIs $100k-200k, 66.7% for AGIs over 200k)
Averages for the 2004 tax year for zip code 01535, filed in 2005:
Average Adjusted Gross Income (AGI) in 2004: $44,841 (Individual Income Tax Returns)
Here:
$44,841
State:
$62,877
Salary/wage: $41,615 (reported on 87.3% of returns)
Here:
$41,615
State:
$52,969
(% of AGI for various income ranges: 99.5% for AGIs below $10k, 71.7% for AGIs $10k-25k, 84.2% for AGIs $25k-50k, 85.9% for AGIs $50k-75k, 88.9% for AGIs $75k-100k, 69.7% for AGIs over 100k)
Taxable interest for individuals: $839 (reported on 60.3% of returns)
This zip code:
$839
Massachusetts:
$1,945
(% of AGI for various income ranges: 8.8% for AGIs below $10k, 2.3% for AGIs $10k-25k, 1.0% for AGIs $25k-50k, 1.0% for AGIs $50k-75k, 0.5% for AGIs $75k-100k, 1.1% for AGIs over 100k)
Taxable dividends: $1,575 (reported on 19.6% of returns)
Here:
$1,575
State:
$5,323
(% of AGI for various income ranges: 2.3% for AGIs below $10k, 0.9% for AGIs $10k-25k, 0.7% for AGIs $25k-50k, 0.3% for AGIs $50k-75k, 0.2% for AGIs $75k-100k, 1.2% for AGIs over 100k)
Net capital gain/loss: +$5,990 (reported on 13.2% of returns)
Here:
+$5,990
State:
+$20,377
(% of AGI for various income ranges: -1.1% for AGIs below $10k, 0.5% for AGIs $10k-25k, 0.7% for AGIs $25k-50k, 1.1% for AGIs $50k-75k, 1.5% for AGIs $75k-100k, 4.0% for AGIs over 100k)
Profit/loss from business: +$12,548 (reported on 14.5% of returns)
Here:
+$12,548
State:
+$17,837
(% of AGI for various income ranges: 2.7% for AGIs below $10k, 9.6% for AGIs $10k-25k, 4.0% for AGIs $25k-50k, 3.0% for AGIs $50k-75k, 3.6% for AGIs $75k-100k, 3.8% for AGIs over 100k)
IRA payment deduction: $2,706 (reported on 2.4% of returns)
01535:
$2,706
Massachusetts:
$3,100
(% of AGI for various income ranges: 0.7% for AGIs $10k-25k, 0.2% for AGIs $25k-50k, 0.1% for AGIs $50k-75k, 0.2% for AGIs $75k-100k)
Total itemized deductions: $15,435 (21% of AGI, reported on 38.8% of returns)
Here:
$15,435
State:
$22,573
Here:
21.1% of AGI
State:
19.5% of AGI
(% of AGI for various income ranges: 18.5% for AGIs below $10k, 7.1% for AGIs $10k-25k, 11.5% for AGIs $25k-50k, 14.8% for AGIs $50k-75k, 15.9% for AGIs $75k-100k, 13.2% for AGIs over 100k)
Charity contributions deductions: $1,586 (2% of AGI, reported on 33.3% of returns)
Here:
$1,586
State:
$3,295
Here:
2.1% of AGI
State:
2.7% of AGI
(% of AGI for various income ranges: 1.2% for AGIs below $10k, 0.7% for AGIs $10k-25k, 0.8% for AGIs $25k-50k, 1.2% for AGIs $50k-75k, 1.3% for AGIs $75k-100k, 1.4% for AGIs over 100k)
Total tax: $5,987 (reported on 79.2% of returns)
01535:
$5,987
State:
$11,494
(% of AGI for various income ranges: 3.2% for AGIs below $10k, 5.1% for AGIs $10k-25k, 7.5% for AGIs $25k-50k, 8.6% for AGIs $50k-75k, 10.4% for AGIs $75k-100k, 17.1% for AGIs over 100k)
Earned income credit: $1,454 (reported on 11.1% of returns)
Here:
$1,454
State:
$1,518
Percentage of individuals using paid preparers for their 2004 taxes: 57.7%
Here:
58%
State:
58%
(% for various income ranges: 48.4% for AGIs below $10k, 55.6% for AGIs $10k-25k, 56.3% for AGIs $25k-50k, 64.3% for AGIs $50k-75k, 61.4% for AGIs $75k-100k, 69.9% for AGIs over 100k)
Household received Food Stamps/SNAP in the past 12 months: 186 Household did not receive Food Stamps/SNAP in the past 12 months: 1,703
Women who had a birth in the past 12 months: 20 (11 now married, 8 unmarried) Women who did not have a birth in the past 12 months: 882 (330 now married, 551 unmarried)
Housing units in zip code 01535 with a mortgage: 843 (110 second mortgage, 112 both second mortgage and home equity loan) Houses without a mortgage: 16
Median monthly owner costs for units with a mortgage: $1,629 Median monthly owner costs for units without a mortgage: $691
Residents with income below the poverty level in 2022:
This zip code:
8.5%
Whole state:
10.4%
Residents with income below 50% of the poverty level in 2022:
This zip code:
5.5%
Whole state:
5.1%
Median number of rooms in houses and condos:
Here:
6.3
State:
6.5
Median number of rooms in apartments:
Here:
3.8
State:
4.0
Notable locations in this zip code not listed on our city pages
Notable locations in zip code 01535: Brookfield Orchards and Touring Center (A), Brookfield Orchards (B), North Brookfield EMS (C), North Brookfield Fire Department (D), North Brookfield Town Hall (E). Display/hide their locations on the map
Churches in zip code 01535 include: Saint Josephs Church (A), First Congregational Church (B), Christ Memorial Church (C). Display/hide their locations on the map
Lakes and reservoirs: Brooks Pond (A), Bliss Pond (B), Perry Pond (C), Horse Pond (D), Doane Pond (E), Bell Hill Reservoir (F), Lake Lashaway (G), Horse Pond Brook Reservoir (H). Display/hide their locations on the map
Streams, rivers, and creeks: Sucker Brook (A), Fivemile River (B), Forget-me-not Brook (C), North Brook (D), Horse Pond Brook (E). Display/hide their locations on the map
In group quarters: 10 (-1 institutionalized population)
Size of family households: 564 2-persons, 250 3-persons, 187 4-persons, 191 5-persons, 18 6-persons
Size of nonfamily households: 465 1-person, 239 2-persons
542 married couples with children.
216 single-parent households (10 men, 206 women).
96.9% of residents of 01535 zip code speak English at home.
0.3% of residents speak Spanish at home (47% very well, 53% well).
1.2% of residents speak other Indo-European language at home (100% very well).
0.3% of residents speak Asian or Pacific Island language at home (100% very well).
0.7% of residents speak other language at home (59% very well, 41% well).
Foreign born population: 72 (1.5%) (25.7% of them are naturalized citizens)
This zip code:
1.5%
Whole state:
18.0%
35%Cabo Verde
22%Germany
10%Honduras
8%Taiwan
8%Grenada
28%American
10%French
9%Irish
9%English
7%French Canadian
4%Polish
4%Scottish
Year of entry for the foreign-born population
612010 or later
52000 to 2009
01990 to 1999
14Before 1990
Facilities with environmental interests located in this zip code:
NORTH BROOKFIELD WASTE WATER TREATMENT PLANT (59 EAST BROOKFIELD ROAD in NORTH BROOKFIELD, MA)
(Integrated Compliance Information System) - ICIS-01-2003-0033, FORMAL ENFORCEMENT ACTION National Pollutant Discharge Elimination System MAJOR (Tracking pollutant discharge elimination systems) - permit - ICIS-, ENFORCEMENT/COMPLIANCE ACTIVITY, ICIS-01-2004-2005, FORMAL ENFORCEMENT ACTION Business SIC classification: SEWERAGE SYSTEMS Organizations: NORTH BROOKFIELD WTP (CONTACT/OPERATOR)
Alternative names: NORTH BROOKFIELD W W T P, NORTH BROOKFIELD WWTP
NORTH BROOKFIELD ELEM (10 NEW SCHOOL DRIVE in NORTH BROOKFIELD, MA)
(National Center for Education Statistics) - STATE ID-215015
NORTH BROOKFIELD HIGH (10 NEW SCHOOL DRIVE in NORTH BROOKFIELD, MA)
(National Center for Education Statistics) - STATE ID-215505
NORTH COUNTRY SIGNS (95 NEW BRAINTREE RD in NORTH BROOKFIELD, MA)
(Resource Conservation and Recovery Act (tracking hazardous waste)) Organizations: RANDY L BEAUDOIN (CONTACT/OWNER)
NORTH BROOKFIELD PRESS (32 MT GUYOT ST in NORTH BROOKFIELD, MA)
(Resource Conservation and Recovery Act (tracking hazardous waste))
LANE JOHN C & SONS INC (372 MAIN ST in NORTH BROOKFIELD, MA)
(Resource Conservation and Recovery Act (tracking hazardous waste))
CLEAN HARBORS ENVIRONMENTAL SERVICES INC (EAST BROOKFIELD RD in NORTH BROOKFIELD, MA)
Small Quantity Generators, between 100 kg and 1000 kg of hazardous waste/month (Resource Conservation and Recovery Act (tracking hazardous waste)) - notification Organizations: TOWN OF NORTH BROOKFIELD (CONTACT/OWNER)
Alternative names: SAFETY KLEEN NE INC
NORTH BROOKFIELD (NORTH BROOKFIELD in NORTH BROOKFIELD, MA)
AIR MINOR (AIRS/AFS) Business SIC classification: GENERAL GOVERNMENT
NORTH BROOKFIELD TRANSFER STATION (EAST BROOKFIELD RD in NORTH BROOKFIELD, MA)
Small Quantity Generators, between 100 kg and 1000 kg of hazardous waste/month (Resource Conservation and Recovery Act (tracking hazardous waste)) - notification Organizations: N BROOKFIELD TRANSFER STATION (CONTACT/OPERATOR)
, TOWN OF NORTH BROOKFIELD (CONTACT/OWNER)
Alternative names: NORTH BROOKFIELD TOWN OF BOARD OF HEALTH
AZTEC INDUSTRIES INCORPRATED (14 SOUTH COMMON STREET in NORTH BROOKFIELD, MA)
AIR MAJOR (AIRS/AFS)
NORTH BROOKFIELD LANDFILL (EAST BROOKFIELD RD in NORTH BROOKFIELD, MA)
CRITERIA AND HAZARDOUS AIR POLLUTANT INVENTORY (Inventory of air pollution sources) Business SIC classification: REFUSE SYSTEMS Business NAICS classification: SOLID WASTE LANDFILL.
Housing units lacking complete kitchen facilities: 0.8%
50.9%Fuel oil, kerosene, etc.
24.9%Utility gas
11.9%Electricity
6.2%Wood
5.2%Bottled, tank, or LP gas
0.5%Coal or coke
0.5%Other fuel
Population in 1990: 4,755.
Place of birth for U.S.-born residents:
This state: 4,012
Northeast: 380
Midwest: 98
South: 102
West: 34
66% of the 01535 zip code residents lived in the same house 5 years ago. Out of people who lived in different houses, 74% lived in this county. Out of people who lived in different counties, 50% lived in Massachusetts.
92% of the 01535 zip code residents lived in the same house 1 year ago. Out of people who lived in different houses, 54% moved from this county. Out of people who lived in different houses, 28% moved from different county within same state. Out of people who lived in different houses, 18% moved from abroad.
Private vs. public school enrollment:
Students in private schools in grades 1 to 8 (elementary and middle school): 94
Here:
25.2%
Massachusetts:
10.3%
Students in private schools in grades 9 to 12 (high school): 29
Here:
10.7%
Massachusetts:
12.3%
Students in private undergraduate colleges: 84
Here:
47.5%
Massachusetts:
51.2%
Occupation by median earnings in the past 12 months ($)
114,364Computer and mathematical occupations
95,160Fire fighting and prevention, and other protective service workers including supervisors
89,656Life, physical, and social science occupations
74,781Law enforcement workers including supervisors
73,336Business and financial operations occupations
70,180Community and social service occupations
Companies with federal contracts located in this zip code:
BROWN ELECTRIC COMPANY (215 N MAIN in NORTH BROOKFIE, MA; small business) : $4,680 in 2 contractsin 2005
$2,340 with Army for Maintenance, Repair or Alteration of Real Property -- Other Administrative Facilities and Service Buildings. Signed on 2005-04-01. Completion date: 2005-04-08.
$2,340 with U.S. Army Corps of Engineers - civil program financing only for Maintenance, Repair or Alteration of Real Property -- Other Administrative Facilities and Service Buildings. Signed on 2005-04-01. Completion date: 2005-04-08.
CHASE PRECAST DIV OF OLDCASTLE (70 E BROOKFIELD RD in NORTH BROOKFIE, MA; small business)
$3,410 with U.S. Army Corps of Engineers - civil program financing only for Miscellaneous Fabricated Nonmetallic Materials. Signed on 2002-08-08. Completion date: 2002-08-21.
Top industries in this zip code by the number of employees in 2005:
Detailed PMIC statistics for the following Tracts:7251.00
2004 - 2018 National Fire Incident Reporting System (NFIRS) incidents
Based on the data from the years 2004 - 2018 the average number of fires per year is 21. The highest number of fires - 42 took place in 2018, and the least - 3 in 2006. The data has a rising trend.
When looking into fire subcategories, the most reports belonged to: Outside Fires (45.3%), and Structure Fires (44.0%).
Fire incident types reported to NFIRS in Zip Code 01535


 Nearest zip codes: 01515, 01562, 01531, 01068, 01506, 01585.


 Based on the data from the years 2004 - 2018 the average number of fires per year is 21. The highest number of fires - 42 took place in 2018, and the least - 3 in 2006. The data has a rising trend.
 When looking into fire subcategories, the most reports belonged to: Outside Fires (45.3%), and Structure Fires (44.0%).