Estimated zip code population in 2022: 4,839 Zip code population in 2010: 4,554 Zip code population in 2000: 5,617
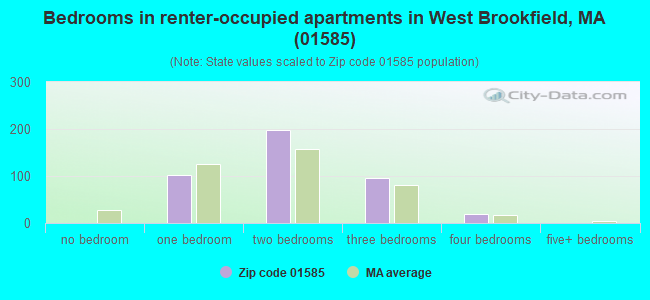
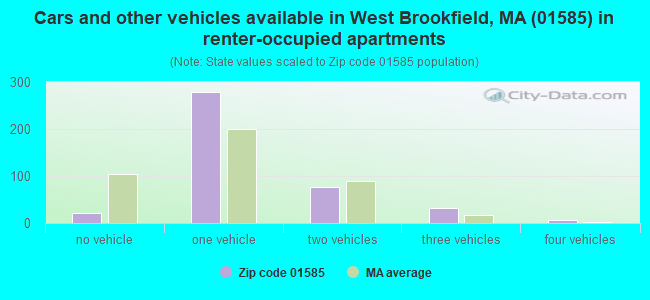
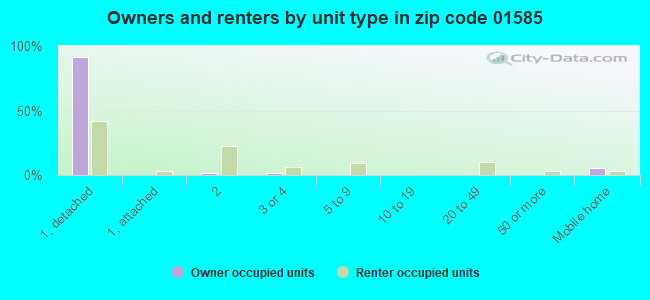
Houses and condos: 2,328 Renter-occupied apartments: 413
% of renters here:
20%
State:
38%
March 2022 cost of living index in zip code 01585: 112.2 (more than average, U.S. average is 100)
Land area: 25.6 sq. mi. Water area: 0.6 sq. mi.
Population density: 189 people per square mile
(very low).
OSM Map
Google Map
MSN Map
OSM Map
General Map
Google Map
MSN Map
OSM Map
Google Map
MSN Map
OSM Map
Google Map
MSN Map
Please wait while loading the map...
Real estate property taxes paid for housing units in 2022:
This zip code:
1.2% ($3,743)
Massachusetts:
1.0% ($5,536)
Median real estate property taxes paid for housing units with mortgages in 2022: $3,802 (1.1%) Median real estate property taxes paid for housing units with no mortgage in 2022: $3,555 (1.5%)
Estimated median house/condo value in 2022: $317,019
01585:
$317,019
Massachusetts:
$534,700
According to our research of Massachusetts and other state lists, there were 3 registered sex offenders living in 01585 zip code as of May 25, 2024. The ratio of all residents to sex offenders in zip code 01585 is 1,557 to 1. The ratio of registered sex offenders to all residents in this zip code is near the state average.
Median resident age:
This zip code:
53.3 years
Massachusetts median age:
40.3 years
Average household size:
This zip code:
2.2 people
Massachusetts:
2.4 people
Averages for the 2020 tax year for zip code 01585, filed in 2021:
Average Adjusted Gross Income (AGI) in 2020: $74,446 (Individual Income Tax Returns)
Here:
$74,446
State:
$105,130
Salary/wage: $62,808 (reported on 80.1% of returns)
Here:
$62,808
State:
$82,951
(% of AGI for various income ranges: 1041.1% for AGIs below $25k, 3394.3% for AGIs $25k-50k, 6690.0% for AGIs $50k-75k, 8780.0% for AGIs $75k-100k, 18433.8% for AGIs $100k-200k, 69060.0% for AGIs over 200k)
Taxable interest for individuals: $1,343 (reported on 41.2% of returns)
This zip code:
$1,343
Massachusetts:
$2,361
(% of AGI for various income ranges: 33.4% for AGIs below $25k, 27.3% for AGIs $25k-50k, 43.0% for AGIs $50k-75k, 53.3% for AGIs $75k-100k, 163.8% for AGIs $100k-200k, 1416.7% for AGIs over 200k)
Ordinary dividends: $4,658 (reported on 19.0% of returns)
Here:
$4,658
State:
$10,365
(% of AGI for various income ranges: 42.6% for AGIs below $25k, 35.8% for AGIs $25k-50k, 23.0% for AGIs $50k-75k, 165.0% for AGIs $75k-100k, 158.3% for AGIs $100k-200k, 3226.7% for AGIs over 200k)
Net capital gain/loss in AGI: +$15,297 (reported on 15.9% of returns)
Here:
+$15,297
State:
+$48,178
(% of AGI for various income ranges: 0.8% for AGIs below $25k, 38.8% for AGIs $25k-50k, 67.8% for AGIs $50k-75k, 199.4% for AGIs $75k-100k, 357.1% for AGIs $100k-200k, 13256.7% for AGIs over 200k)
Profit/loss from business: +$14,630 (reported on 13.3% of returns)
Here:
+$14,630
State:
+$20,792
(% of AGI for various income ranges: 66.1% for AGIs below $25k, 104.8% for AGIs $25k-50k, 297.8% for AGIs $50k-75k, 428.9% for AGIs $75k-100k, 823.8% for AGIs $100k-200k, 950.0% for AGIs over 200k)
Taxable individual retirement arrangement distribution: $18,438 (reported on 11.5% of returns)
01585:
$18,438
Massachusetts:
$22,790
(% of AGI for various income ranges: 111.1% for AGIs below $25k, 132.2% for AGIs $25k-50k, 231.7% for AGIs $50k-75k, 463.3% for AGIs $75k-100k, 1031.7% for AGIs $100k-200k)
Total itemized deductions: $22,021 (reported on 8.4% of returns)
Here:
$22,021
State:
$36,722
(% of AGI for various income ranges: 114.2% for AGIs below $25k, 221.7% for AGIs $50k-75k, 402.2% for AGIs $75k-100k, 574.6% for AGIs $100k-200k, 3790.0% for AGIs over 200k)
Charity contributions: $5,183 (reported on 5.3% of returns)
Here:
$5,183
State:
$12,529
(% of AGI for various income ranges: 7.8% for AGIs $25k-50k, 32.8% for AGIs $75k-100k, 221.7% for AGIs $100k-200k)
Taxes paid: $7,828 (reported on 8.0% of returns)
01585:
$7,828
State:
$8,782
(% of AGI for various income ranges: 29.7% for AGIs below $25k, 85.2% for AGIs $50k-75k, 170.6% for AGIs $75k-100k, 213.8% for AGIs $100k-200k, 933.3% for AGIs over 200k)
Earned income credit: $1,876 (reported on 9.3% of returns)
Here:
$1,876
State:
$1,909
(% of AGI for various income ranges: 57.4% for AGIs below $25k, 44.0% for AGIs $25k-50k)
Percentage of individuals using paid preparers for their 2020 taxes: 92.9%
Here:
93%
State:
92%
(% for various income ranges: 93.2% for AGIs below $25k, 94.2% for AGIs $25k-50k, 94.3% for AGIs $50k-75k, 88.9% for AGIs $75k-100k, 92.9% for AGIs $100k-200k, 90.9% for AGIs over 200k)
Averages for the 2012 tax year for zip code 01585, filed in 2013:
Average Adjusted Gross Income (AGI) in 2012: $58,720 (Individual Income Tax Returns)
Here:
$58,720
State:
$81,425
Salary/wage: $52,076 (reported on 82.9% of returns)
Here:
$52,076
State:
$64,752
(% of AGI for various income ranges: 67.5% for AGIs below $25k, 77.1% for AGIs $25k-50k, 76.7% for AGIs $50k-75k, 74.0% for AGIs $75k-100k, 80.0% for AGIs $100k-200k, 60.3% for AGIs over 200k)
Taxable interest for individuals: $764 (reported on 56.2% of returns)
This zip code:
$764
Massachusetts:
$2,136
(% of AGI for various income ranges: 1.9% for AGIs below $25k, 0.7% for AGIs $25k-50k, 0.8% for AGIs $50k-75k, 0.7% for AGIs $75k-100k, 0.6% for AGIs $100k-200k, 0.4% for AGIs over 200k)
Ordinary dividends: $2,679 (reported on 20.5% of returns)
Here:
$2,679
State:
$9,473
(% of AGI for various income ranges: 1.3% for AGIs below $25k, 0.7% for AGIs $25k-50k, 0.9% for AGIs $50k-75k, 1.4% for AGIs $75k-100k, 0.6% for AGIs $100k-200k, 1.1% for AGIs over 200k)
Net capital gain/loss in AGI: +$1,839 (reported on 13.3% of returns)
Here:
+$1,839
State:
+$31,437
(% of AGI for various income ranges: 0.2% for AGIs $50k-75k, 1.3% for AGIs $100k-200k, 0.4% for AGIs over 200k)
Profit/loss from business: +$20,938 (reported on 16.2% of returns)
Here:
+$20,938
State:
+$20,662
(% of AGI for various income ranges: 8.1% for AGIs below $25k, 4.6% for AGIs $25k-50k, 2.3% for AGIs $50k-75k, 4.0% for AGIs $75k-100k, 2.4% for AGIs $100k-200k, 15.2% for AGIs over 200k)
Taxable individual retirement arrangement distribution: $11,460 (reported on 11.9% of returns)
01585:
$11,460
Massachusetts:
$18,892
(% of AGI for various income ranges: 5.7% for AGIs below $25k, 2.6% for AGIs $25k-50k, 2.3% for AGIs $50k-75k, 3.4% for AGIs $75k-100k, 2.3% for AGIs $100k-200k)
Total itemized deductions: $19,110 (19% of AGI, reported on 39.0% of returns)
Here:
$19,110
State:
$28,907
Here:
19.3% of AGI
State:
18.2% of AGI
(% of AGI for various income ranges: 12.9% for AGIs below $25k, 8.9% for AGIs $25k-50k, 12.7% for AGIs $50k-75k, 14.3% for AGIs $75k-100k, 14.6% for AGIs $100k-200k, 11.4% for AGIs over 200k)
Charity contributions: $2,062 (reported on 27.6% of returns)
Here:
$2,062
State:
$4,208
(% of AGI for various income ranges: 0.4% for AGIs below $25k, 0.4% for AGIs $25k-50k, 0.7% for AGIs $50k-75k, 0.9% for AGIs $75k-100k, 1.1% for AGIs $100k-200k, 1.8% for AGIs over 200k)
Taxes paid: $8,345 (reported on 39.0% of returns)
01585:
$8,345
State:
$13,303
(% of AGI for various income ranges: 3.4% for AGIs below $25k, 2.9% for AGIs $25k-50k, 5.0% for AGIs $50k-75k, 5.8% for AGIs $75k-100k, 6.8% for AGIs $100k-200k, 6.8% for AGIs over 200k)
Earned income credit: $1,888 (reported on 11.9% of returns)
Here:
$1,888
State:
$1,971
(% of AGI for various income ranges: 4.4% for AGIs below $25k, 0.6% for AGIs $25k-50k)
Percentage of individuals using paid preparers for their 2012 taxes: 56.2%
Here:
56%
State:
56%
(% for various income ranges: 49.3% for AGIs below $25k, 53.1% for AGIs $25k-50k, 60.6% for AGIs $50k-75k, 66.7% for AGIs $75k-100k, 61.5% for AGIs $100k-200k, 71.4% for AGIs over 200k)
Averages for the 2004 tax year for zip code 01585, filed in 2005:
Average Adjusted Gross Income (AGI) in 2004: $48,697 (Individual Income Tax Returns)
Here:
$48,697
State:
$62,877
Salary/wage: $41,942 (reported on 87.1% of returns)
Here:
$41,942
State:
$52,969
(% of AGI for various income ranges: 89.6% for AGIs below $10k, 70.2% for AGIs $10k-25k, 81.9% for AGIs $25k-50k, 80.4% for AGIs $50k-75k, 80.7% for AGIs $75k-100k, 64.5% for AGIs over 100k)
Taxable interest for individuals: $1,217 (reported on 66.5% of returns)
This zip code:
$1,217
Massachusetts:
$1,945
(% of AGI for various income ranges: 4.3% for AGIs below $10k, 2.6% for AGIs $10k-25k, 1.2% for AGIs $25k-50k, 1.3% for AGIs $50k-75k, 0.6% for AGIs $75k-100k, 2.5% for AGIs over 100k)
Taxable dividends: $1,763 (reported on 23.7% of returns)
Here:
$1,763
State:
$5,323
(% of AGI for various income ranges: 2.6% for AGIs below $10k, 1.5% for AGIs $10k-25k, 0.6% for AGIs $25k-50k, 0.8% for AGIs $50k-75k, 0.8% for AGIs $75k-100k, 0.9% for AGIs over 100k)
Net capital gain/loss: +$5,936 (reported on 17.3% of returns)
Here:
+$5,936
State:
+$20,377
(% of AGI for various income ranges: -4.0% for AGIs below $10k, -0.5% for AGIs $10k-25k, 0.2% for AGIs $25k-50k, 1.5% for AGIs $50k-75k, 3.4% for AGIs $75k-100k, 3.8% for AGIs over 100k)
Profit/loss from business: +$20,712 (reported on 16.7% of returns)
Here:
+$20,712
State:
+$17,837
(% of AGI for various income ranges: 3.1% for AGIs below $10k, 7.3% for AGIs $10k-25k, 4.5% for AGIs $25k-50k, 4.8% for AGIs $50k-75k, 4.4% for AGIs $75k-100k, 11.9% for AGIs over 100k)
IRA payment deduction: $3,197 (reported on 3.1% of returns)
01585:
$3,197
Massachusetts:
$3,100
Self-employed pension: $15,621 (reported on 1.5% of returns)
Here:
$15,621
Massachusetts:
$14,516
Total itemized deductions: $17,202 (22% of AGI, reported on 40.8% of returns)
Here:
$17,202
State:
$22,573
Here:
21.7% of AGI
State:
19.5% of AGI
(% of AGI for various income ranges: 15.7% for AGIs below $10k, 11.0% for AGIs $10k-25k, 13.2% for AGIs $25k-50k, 15.5% for AGIs $50k-75k, 15.7% for AGIs $75k-100k, 14.4% for AGIs over 100k)
Charity contributions deductions: $1,928 (2% of AGI, reported on 34.7% of returns)
Here:
$1,928
State:
$3,295
Here:
2.3% of AGI
State:
2.7% of AGI
(% of AGI for various income ranges: 0.8% for AGIs $10k-25k, 0.9% for AGIs $25k-50k, 1.1% for AGIs $50k-75k, 1.4% for AGIs $75k-100k, 2.0% for AGIs over 100k)
Total tax: $6,973 (reported on 79.2% of returns)
01585:
$6,973
State:
$11,494
(% of AGI for various income ranges: 2.3% for AGIs below $10k, 4.8% for AGIs $10k-25k, 7.3% for AGIs $25k-50k, 9.1% for AGIs $50k-75k, 10.3% for AGIs $75k-100k, 17.8% for AGIs over 100k)
Earned income credit: $1,469 (reported on 9.7% of returns)
Here:
$1,469
State:
$1,518
Percentage of individuals using paid preparers for their 2004 taxes: 57.6%
Here:
58%
State:
58%
(% for various income ranges: 42.6% for AGIs below $10k, 57.1% for AGIs $10k-25k, 57.5% for AGIs $25k-50k, 65.2% for AGIs $50k-75k, 61.5% for AGIs $75k-100k, 67.9% for AGIs over 100k)
Household received Food Stamps/SNAP in the past 12 months: 199 Household did not receive Food Stamps/SNAP in the past 12 months: 1,847
Women who had a birth in the past 12 months: 70 (10 now married, 52 unmarried) Women who did not have a birth in the past 12 months: 700 (304 now married, 392 unmarried)
Housing units in zip code 01585 with a mortgage: 1,005 (23 second mortgage, 13 home equity loan, 5 both second mortgage and home equity loan) Houses without a mortgage: 50
Median monthly owner costs for units with a mortgage: $1,734 Median monthly owner costs for units without a mortgage: $754
Residents with income below the poverty level in 2022:
This zip code:
10.0%
Whole state:
10.4%
Residents with income below 50% of the poverty level in 2022:
This zip code:
6.4%
Whole state:
5.1%
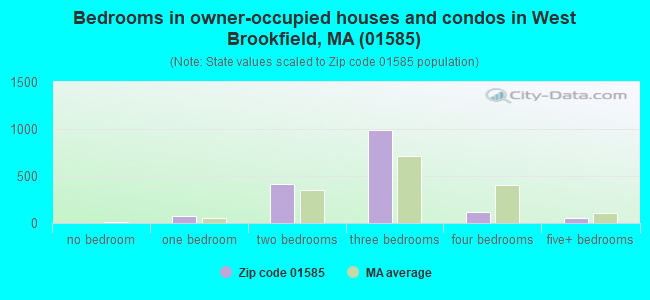
Median number of rooms in houses and condos:
Here:
5.8
State:
6.5
Median number of rooms in apartments:
Here:
4.1
State:
4.0
Notable locations in this zip code not listed on our city pages
Notable locations in zip code 01585: Breezeland Orchards (A), Ragged Hill Orchard (B), West Brookfield Rescue Squad (C), West Brookfield Fire Department (D), West Brookfield Town Hall (E). Display/hide their locations on the map
In group quarters: 198 (-1 institutionalized population)
Size of family households: 642 2-persons, 195 3-persons, 348 4-persons, 57 5-persons, 12 6-persons
Size of nonfamily households: 623 1-person, 149 2-persons, 38 3-persons
512 married couples with children.
223 single-parent households (223 women).
97.3% of residents of 01585 zip code speak English at home.
0.4% of residents speak Spanish at home (100% very well).
2.2% of residents speak other Indo-European language at home (66% very well, 21% well, 14% not well).
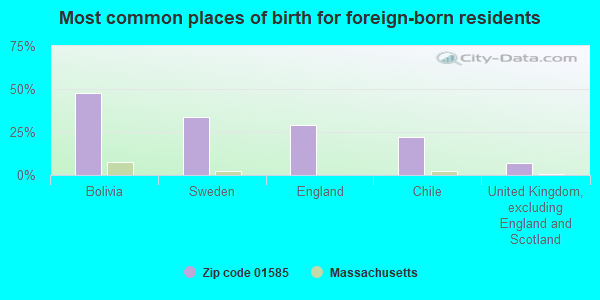
Foreign born population: 130 (2.7%) (60.3% of them are naturalized citizens)
This zip code:
2.7%
Whole state:
18.0%
48%Bolivia
34%Sweden
29%England
22%Chile
7%United Kingdom, excluding England and Scotland
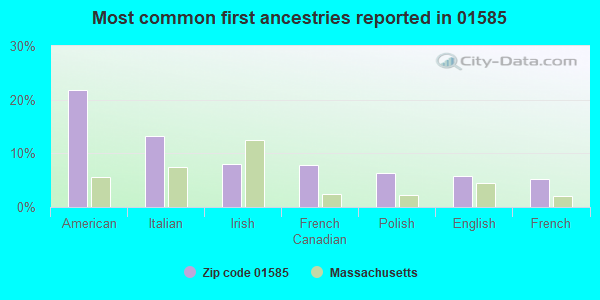
22%American
13%Italian
8%Irish
8%French Canadian
6%Polish
6%English
5%French
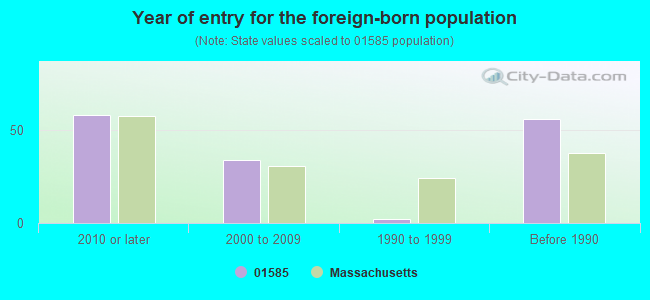
Year of entry for the foreign-born population
582010 or later
342000 to 2009
21990 to 1999
56Before 1990
Facilities with environmental interests located in this zip code:
BROOKFIELD WIRE COMPANY INC (213 EAST MAIN ST in WEST BROOKFIELD, MA)
AIR MINOR (AIRS/AFS) ENFORCEMENT/COMPLIANCE ACTIVITY (Integrated Compliance Information System) STATE MASTER (MA-EPICS) - NEI-1180557, AIR PROGRAM, RCRAINFO-MAD055742761, HAZARDOUS WASTE PROGRAM CRITERIA AND HAZARDOUS AIR POLLUTANT INVENTORY (Inventory of air pollution sources) HAZARDOUS WASTE BIENNIAL REPORTER (Resource Conservation and Recovery Act (tracking hazardous waste)) Large Quantity Generators, more that 1000 kg of hazardous waste/month (Resource Conservation and Recovery Act (tracking hazardous waste)) - notification TRI REPORTER (Tracking of toxic chemicals releasing facilities) Business SIC classification: STEEL WIREDRAWING AND STEEL NAILS AND SPIKES Business NAICS classification: STEEL WIRE DRAWING. Organizations: BROOKFIELD WIRE COMPANY, INC. (CONTACT/OPERATOR)
, AJD HOLDING CO., INC (CONTACT/OWNER)
AQUATIC PLASTIC CO INC (RTE 9 INDUSTRIAL PARK in WEST BROOKFIELD, MA)
(Resource Conservation and Recovery Act (tracking hazardous waste))
MCINTYRE CHEVROLET (RTE 9 in WEST BROOKFIELD, MA)
(Resource Conservation and Recovery Act (tracking hazardous waste))
MRSE (192 WEST MAIN ST in WEST BROOKFIELD, MA)
Small Quantity Generators, between 100 kg and 1000 kg of hazardous waste/month (Resource Conservation and Recovery Act (tracking hazardous waste)) - notification Business NAICS classification: SPECIAL DIE AND TOOL, DIE SET, JIG, AND FIXTURE MANUFACTURING. Organizations: MARY JANE & FRANK GAUMOND (CONTACT/OWNER)
Housing units lacking complete plumbing facilities: 1.3% Housing units lacking complete kitchen facilities: 1.3%
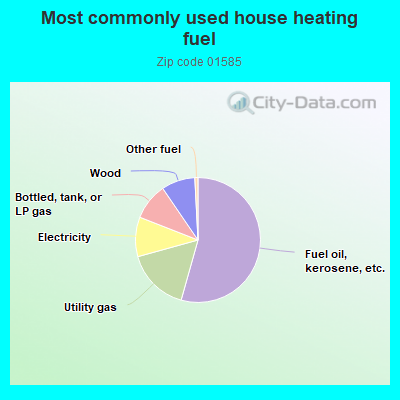
54.2%Fuel oil, kerosene, etc.
16.3%Utility gas
10.2%Electricity
9.5%Bottled, tank, or LP gas
8.7%Wood
0.8%Other fuel
Population in 1990: 3,528. Population change in the 1990s: +2,089 (+59.2%).
Place of birth for U.S.-born residents:
This state: 3,685
Northeast: 666
Midwest: 43
South: 236
West: 28
64% of the 01585 zip code residents lived in the same house 5 years ago. Out of people who lived in different houses, 72% lived in this county. Out of people who lived in different counties, 50% lived in Massachusetts.
94% of the 01585 zip code residents lived in the same house 1 year ago. Out of people who lived in different houses, 53% moved from this county. Out of people who lived in different houses, 25% moved from different county within same state. Out of people who lived in different houses, 21% moved from different state.
Private vs. public school enrollment:
Students in private schools in grades 1 to 8 (elementary and middle school): 9
Here:
2.9%
Massachusetts:
10.3%
Students in private schools in grades 9 to 12 (high school):
Here:
0.0%
Massachusetts:
12.3%
Students in private undergraduate colleges: 12
Here:
23.1%
Massachusetts:
51.2%
Occupation by median earnings in the past 12 months ($)
93,485Management occupations
87,237Installation, maintenance, and repair occupations
81,187Transportation occupations
80,186Business and financial operations occupations
76,770Production occupations
56,387Architecture and engineering occupations
Companies with federal contracts located in this zip code:
BROOKFIELD WIRE COMPANY INC (RR 9 in WEST BROOKFIEL, MA; small business) : $1,993,922 in 100 contractsfrom 2000 to 2006
Contracts for Wire, Nonelectrical, Wire, Nonelectrical, Nonferrous Base Metal by Defense Logistics Agency, Navy Signed by year:2000: $148,063; 2001: $373,277; 2002: $126,556; 2003: $127,613; 2004: $558,167; 2005: $418,643; 2006: $241,603.
Biggest contracts:
$101,119 with Defense Logistics Agency for Wire, Nonelectrical. Signed on 2004-10-27. Completion date: 2004-11-26.
$89,209 with Defense Logistics Agency for Wire, Nonelectrical, Nonferrous Base Metal. Signed on 2006-05-30. Completion date: 2006-07-31.
$75,984 with Defense Logistics Agency for Wire, Nonelectrical. Signed on 2003-10-09. Completion date: 2003-11-08.
$73,976, same as above.Signed on 2005-04-29. Completion date: 2005-05-30.
M R S E, INC (192 W MAIN ST in WEST BROOKFIEL, MA; small business) : $268,824 in 4 contractsfrom 2003 to 2005
$252,658 with Air Force for Modification of Equipment -- Special Industry Machinery. Taking place in UT. Signed on 2003-06-05. Completion date: 2003-12-15.
$12,850 with Army for Maintenance, Repair and Rebuilding of Equipment -- Metalworking Machinery. Signed on 2005-08-18. Completion date: 2005-09-23.
$5,084 with Army for Machine Tool Accessories. Signed on 2004-05-26. Completion date: 2004-07-01.
-$1,768 with Army for Maintenance, Repair and Rebuilding of Equipment -- Metalworking Machinery. Signed on 2005-09-30. Completion date: 2005-09-23.
ALM & SON SEPTIC SERVICE (398 WICKABOAG VALLEY RD in WEST BROOKFIEL, MA; small business) : $27,540 in 5 contractsin 2006
Contracts for Trash/Garbage Collection Services - Including Portable Sanitation Services by Army Signed by year:2000: $0; 2001: $0; 2002: $0; 2003: $0; 2004: $0; 2005: $0; 2006: $27,540.
Biggest contracts:
$14,000 with Army for Trash/Garbage Collection Services - Including Portable Sanitation Services. Signed on 2006-01-05. Completion date: 2006-09-30.
$11,380, same as above.Signed on 2006-03-30. Completion date: 2006-09-30.
$2,160, same as above.Signed on 2006-06-07. Completion date: 2006-09-30.
$0, same as above.Signed on 2006-01-05. Completion date: 2006-09-30.
Top industries in this zip code by the number of employees in 2005:
Health Care and Social Assistance: Nursing Care Facilities (100-249 employees: 1 establishment, 10-19 employees: 1 establishment, 5-9 employees: 1 establishment)
Accommodation and Food Services: Full-Service Restaurants (50-99: 1, 5-9: 1)
Professional, Scientific, and Technical Services: Veterinary Services (20-49: 1)
Health Care and Social Assistance: Residential Mental Health and Substance Abuse Facilities (20-49: 1)
Finance and Insurance: Savings Institutions (10-19: 1, 5-9: 1)
Health Care and Social Assistance: Offices of Dentists (10-19: 1)
People in group quarters in 2010:
130 people in nursing facilities/skilled-nursing facilities
28 people in group homes intended for adults
People in group quarters in 2000:
350 people in nursing homes
9 people in other nonhousehold living situations
Fatal accident statistics in 2013:
Fatal accident count: 2
Vehicles involved in fatal accidents: 3
Fatal accidents caused by drunken drivers: 0
Fatalities: 2
Persons involved in fatal accidents: 4
Pedestrians involved in fatal accidents: 1
Home Mortgage Disclosure Act Aggregated Statistics For Year 2009 (Based on 8 partial tracts)
A) FHA, FSA/RHS & VA Home Purchase Loans
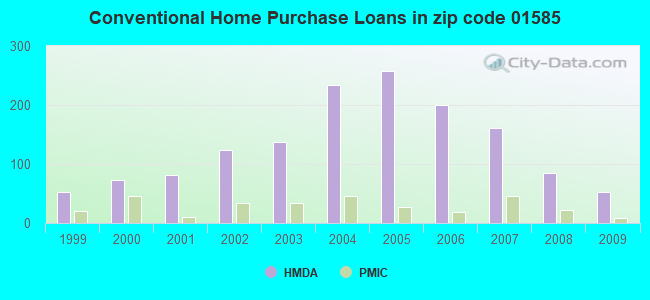
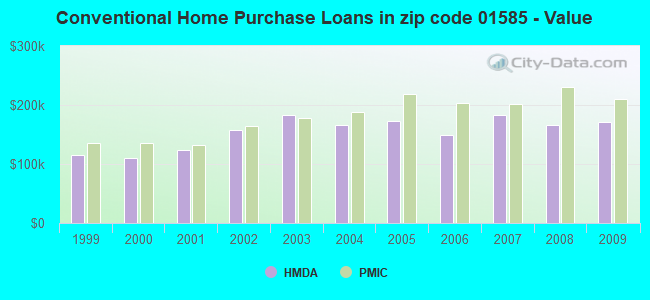
B) Conventional Home Purchase Loans
C) Refinancings
D) Home Improvement Loans
E) Loans on Dwellings For 5+ Families
F) Non-occupant Loans on < 5 Family Dwellings (A B C & D)
G) Loans On Manufactured Home Dwelling (A B C & D)
Number
Average Value
Number
Average Value
Number
Average Value
Number
Average Value
Number
Average Value
Number
Average Value
Number
Average Value
LOANS ORIGINATED
32
$170,614
52
$170,430
207
$187,563
34
$117,972
0
$0
12
$153,880
1
$62,400
APPLICATIONS APPROVED, NOT ACCEPTED
3
$136,330
3
$216,450
12
$238,371
1
$1,800
0
$0
0
$0
1
$19,200
APPLICATIONS DENIED
6
$155,788
10
$126,536
88
$203,953
8
$116,509
1
$205,200
5
$146,414
1
$69,000
APPLICATIONS WITHDRAWN
7
$195,313
14
$159,124
41
$213,252
6
$254,873
0
$0
4
$395,185
1
$87,000
FILES CLOSED FOR INCOMPLETENESS
0
$0
2
$148,380
17
$172,207
0
$0
0
$0
2
$148,380
0
$0
Aggregated Statistics For Year 2008 (Based on 8 partial tracts)
A) FHA, FSA/RHS & VA Home Purchase Loans
B) Conventional Home Purchase Loans
C) Refinancings
D) Home Improvement Loans
F) Non-occupant Loans on < 5 Family Dwellings (A B C & D)
G) Loans On Manufactured Home Dwelling (A B C & D)
Number
Average Value
Number
Average Value
Number
Average Value
Number
Average Value
Number
Average Value
Number
Average Value
LOANS ORIGINATED
19
$207,904
84
$166,929
156
$177,451
38
$129,226
20
$183,751
1
$103,800
APPLICATIONS APPROVED, NOT ACCEPTED
2
$279,945
13
$140,879
16
$166,128
5
$8,602
4
$148,875
7
$92,503
APPLICATIONS DENIED
10
$171,496
16
$154,865
80
$197,092
31
$72,112
3
$28,897
2
$80,700
APPLICATIONS WITHDRAWN
6
$196,842
15
$179,089
28
$196,136
5
$97,862
3
$103,223
0
$0
FILES CLOSED FOR INCOMPLETENESS
1
$214,200
1
$81,000
10
$188,801
7
$168,493
0
$0
1
$19,800
Aggregated Statistics For Year 2007 (Based on 8 partial tracts)
A) FHA, FSA/RHS & VA Home Purchase Loans
B) Conventional Home Purchase Loans
C) Refinancings
D) Home Improvement Loans
E) Loans on Dwellings For 5+ Families
F) Non-occupant Loans on < 5 Family Dwellings (A B C & D)
G) Loans On Manufactured Home Dwelling (A B C & D)
Number
Average Value
Number
Average Value
Number
Average Value
Number
Average Value
Number
Average Value
Number
Average Value
Number
Average Value
LOANS ORIGINATED
6
$256,693
161
$183,612
212
$156,198
59
$73,952
1
$134,400
24
$169,585
3
$91,000
APPLICATIONS APPROVED, NOT ACCEPTED
0
$0
21
$151,920
37
$246,572
6
$107,508
0
$0
1
$49,200
1
$24,000
APPLICATIONS DENIED
0
$0
48
$156,999
199
$190,185
36
$47,068
0
$0
7
$147,509
1
$66,000
APPLICATIONS WITHDRAWN
2
$192,895
15
$179,859
68
$200,469
1
$18,000
0
$0
0
$0
0
$0
FILES CLOSED FOR INCOMPLETENESS
0
$0
4
$148,570
28
$212,188
4
$93,975
0
$0
0
$0
1
$71,400
Aggregated Statistics For Year 2006 (Based on 8 partial tracts)
A) FHA, FSA/RHS & VA Home Purchase Loans
B) Conventional Home Purchase Loans
C) Refinancings
D) Home Improvement Loans
E) Loans on Dwellings For 5+ Families
F) Non-occupant Loans on < 5 Family Dwellings (A B C & D)
G) Loans On Manufactured Home Dwelling (A B C & D)
Number
Average Value
Number
Average Value
Number
Average Value
Number
Average Value
Number
Average Value
Number
Average Value
Number
Average Value
LOANS ORIGINATED
6
$241,120
200
$148,667
298
$145,978
103
$63,137
0
$0
30
$136,134
7
$41,571
APPLICATIONS APPROVED, NOT ACCEPTED
1
$154,800
15
$155,829
35
$188,511
3
$16,790
0
$0
2
$116,400
0
$0
APPLICATIONS DENIED
0
$0
44
$176,127
199
$181,575
35
$85,911
1
$3,000
2
$143,400
4
$122,700
APPLICATIONS WITHDRAWN
0
$0
19
$179,220
135
$175,152
6
$54,722
0
$0
3
$210,760
1
$35,400
FILES CLOSED FOR INCOMPLETENESS
1
$91,800
3
$159,000
28
$166,827
5
$29,680
0
$0
0
$0
0
$0
Aggregated Statistics For Year 2005 (Based on 8 partial tracts)
A) FHA, FSA/RHS & VA Home Purchase Loans
B) Conventional Home Purchase Loans
C) Refinancings
D) Home Improvement Loans
E) Loans on Dwellings For 5+ Families
F) Non-occupant Loans on < 5 Family Dwellings (A B C & D)
G) Loans On Manufactured Home Dwelling (A B C & D)
Number
Average Value
Number
Average Value
Number
Average Value
Number
Average Value
Number
Average Value
Number
Average Value
Number
Average Value
LOANS ORIGINATED
3
$71,477
257
$173,111
383
$167,184
91
$89,797
1
$160,800
26
$134,438
6
$48,347
APPLICATIONS APPROVED, NOT ACCEPTED
1
$96,000
25
$158,202
42
$182,082
8
$28,662
1
$160,800
7
$138,099
0
$0
APPLICATIONS DENIED
2
$336,330
43
$143,257
203
$168,466
37
$60,249
0
$0
3
$67,183
1
$18,600
APPLICATIONS WITHDRAWN
1
$120,000
34
$137,604
186
$174,907
26
$190,615
0
$0
5
$102,066
1
$138,600
FILES CLOSED FOR INCOMPLETENESS
0
$0
19
$130,284
111
$200,542
0
$0
0
$0
3
$215,260
0
$0
Aggregated Statistics For Year 2004 (Based on 8 partial tracts)
A) FHA, FSA/RHS & VA Home Purchase Loans
B) Conventional Home Purchase Loans
C) Refinancings
D) Home Improvement Loans
E) Loans on Dwellings For 5+ Families
F) Non-occupant Loans on < 5 Family Dwellings (A B C & D)
G) Loans On Manufactured Home Dwelling (A B C & D)
Number
Average Value
Number
Average Value
Number
Average Value
Number
Average Value
Number
Average Value
Number
Average Value
Number
Average Value
LOANS ORIGINATED
13
$165,227
234
$165,513
339
$150,579
108
$86,375
1
$81,000
38
$154,981
5
$103,058
APPLICATIONS APPROVED, NOT ACCEPTED
0
$0
23
$134,780
50
$162,176
7
$90,756
0
$0
2
$147,000
2
$40,800
APPLICATIONS DENIED
5
$170,824
34
$102,585
133
$154,300
44
$61,589
0
$0
1
$141,000
9
$46,867
APPLICATIONS WITHDRAWN
2
$181,025
21
$190,845
140
$147,595
5
$92,984
0
$0
2
$95,950
0
$0
FILES CLOSED FOR INCOMPLETENESS
2
$181,025
2
$131,400
95
$153,360
6
$138,142
0
$0
1
$66,000
0
$0
Aggregated Statistics For Year 2003 (Based on 4 partial tracts)
A) FHA, FSA/RHS & VA Home Purchase Loans
B) Conventional Home Purchase Loans
C) Refinancings
D) Home Improvement Loans
E) Loans on Dwellings For 5+ Families
F) Non-occupant Loans on < 5 Family Dwellings (A B C & D)
Number
Average Value
Number
Average Value
Number
Average Value
Number
Average Value
Number
Average Value
Number
Average Value
LOANS ORIGINATED
6
$214,987
137
$183,399
538
$138,117
20
$44,316
2
$296,760
32
$119,817
APPLICATIONS APPROVED, NOT ACCEPTED
2
$163,220
32
$145,412
53
$132,030
10
$34,028
0
$0
8
$182,012
APPLICATIONS DENIED
4
$183,990
24
$167,752
180
$146,347
14
$58,646
0
$0
6
$105,185
APPLICATIONS WITHDRAWN
0
$0
16
$160,992
89
$142,912
8
$54,159
0
$0
0
$0
FILES CLOSED FOR INCOMPLETENESS
0
$0
2
$33,635
10
$141,653
0
$0
0
$0
2
$87,050
Aggregated Statistics For Year 2002 (Based on 4 partial tracts)
A) FHA, FSA/RHS & VA Home Purchase Loans
B) Conventional Home Purchase Loans
C) Refinancings
D) Home Improvement Loans
F) Non-occupant Loans on < 5 Family Dwellings (A B C & D)
Number
Average Value
Number
Average Value
Number
Average Value
Number
Average Value
Number
Average Value
LOANS ORIGINATED
8
$153,326
123
$157,918
317
$128,334
28
$21,409
12
$67,595
APPLICATIONS APPROVED, NOT ACCEPTED
2
$186,960
2
$210,700
28
$132,411
6
$36,270
0
$0
APPLICATIONS DENIED
2
$186,960
4
$161,735
65
$107,990
20
$29,874
0
$0
APPLICATIONS WITHDRAWN
0
$0
16
$182,384
69
$117,471
0
$0
2
$98,920
FILES CLOSED FOR INCOMPLETENESS
0
$0
0
$0
18
$136,070
0
$0
0
$0
Aggregated Statistics For Year 2001 (Based on 4 partial tracts)
A) FHA, FSA/RHS & VA Home Purchase Loans
B) Conventional Home Purchase Loans
C) Refinancings
D) Home Improvement Loans
F) Non-occupant Loans on < 5 Family Dwellings (A B C & D)
Number
Average Value
Number
Average Value
Number
Average Value
Number
Average Value
Number
Average Value
LOANS ORIGINATED
8
$117,715
81
$123,052
231
$116,383
26
$19,860
8
$131,069
APPLICATIONS APPROVED, NOT ACCEPTED
0
$0
10
$68,057
34
$107,183
0
$0
2
$81,115
APPLICATIONS DENIED
0
$0
8
$120,435
46
$91,006
10
$31,654
2
$82,105
APPLICATIONS WITHDRAWN
0
$0
12
$107,987
59
$93,018
8
$36,352
0
$0
FILES CLOSED FOR INCOMPLETENESS
2
$122,660
0
$0
6
$140,137
0
$0
0
$0
Aggregated Statistics For Year 2000 (Based on 4 partial tracts)
A) FHA, FSA/RHS & VA Home Purchase Loans
B) Conventional Home Purchase Loans
C) Refinancings
D) Home Improvement Loans
F) Non-occupant Loans on < 5 Family Dwellings (A B C & D)
Number
Average Value
Number
Average Value
Number
Average Value
Number
Average Value
Number
Average Value
LOANS ORIGINATED
18
$135,960
73
$110,628
61
$81,731
36
$18,245
6
$43,855
APPLICATIONS APPROVED, NOT ACCEPTED
0
$0
16
$132,306
14
$106,692
8
$29,676
4
$42,535
APPLICATIONS DENIED
2
$123,650
16
$86,061
53
$54,014
18
$23,741
0
$0
APPLICATIONS WITHDRAWN
2
$103,865
16
$85,689
36
$59,517
0
$0
0
$0
FILES CLOSED FOR INCOMPLETENESS
2
$97,930
2
$117,715
14
$148,380
2
$49,460
0
$0
Aggregated Statistics For Year 1999 (Based on 2 partial tracts)
A) FHA, FSA/RHS & VA Home Purchase Loans
B) Conventional Home Purchase Loans
C) Refinancings
D) Home Improvement Loans
F) Non-occupant Loans on < 5 Family Dwellings (A B C & D)
Detailed PMIC statistics for the following Tracts:7241.00
, 7611.00
2002 - 2018 National Fire Incident Reporting System (NFIRS) incidents
Based on the data from the years 2002 - 2018 the average number of fires per year is 7. The highest number of fires - 22 took place in 2018, and the least - 1 in 2010. The data has a rising trend.
When looking into fire subcategories, the most incidents belonged to: Structure Fires (67.7%), and Outside Fires (18.9%).
Fire incident types reported to NFIRS in Zip Code 01585


 Nearest zip codes: 01083, 01506, 01531, 01092, 01031, 01535.
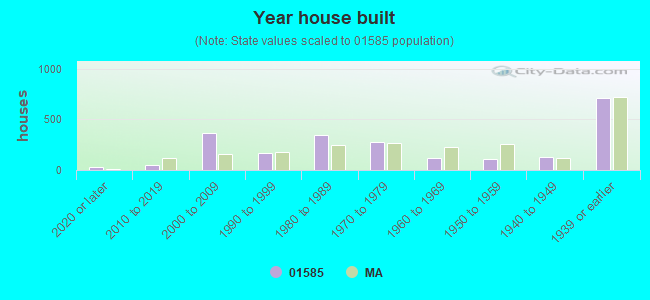


 Based on the data from the years 2002 - 2018 the average number of fires per year is 7. The highest number of fires - 22 took place in 2018, and the least - 1 in 2010. The data has a rising trend.
 When looking into fire subcategories, the most incidents belonged to: Structure Fires (67.7%), and Outside Fires (18.9%).