Estimated zip code population in 2022: 1,584 Zip code population in 2010: 1,902 Zip code population in 2000: 1,716
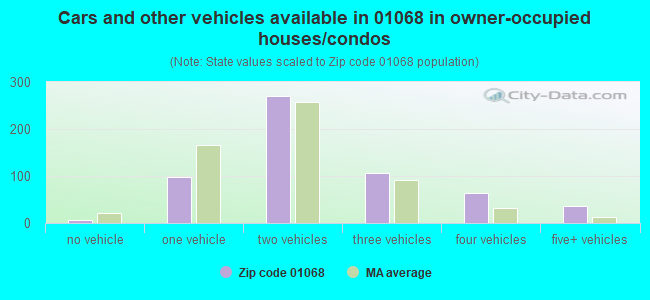
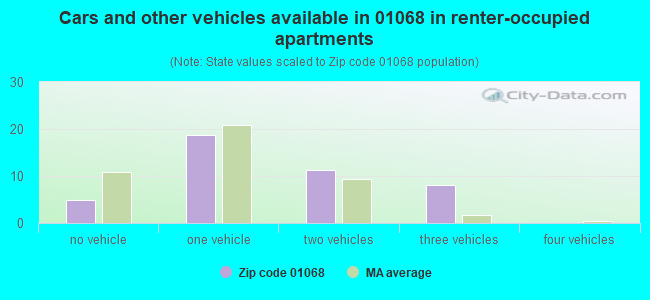
Houses and condos: 682 Renter-occupied apartments: 43
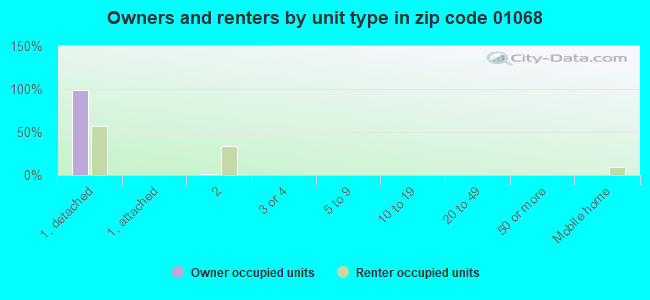
% of renters here:
7%
State:
38%
March 2022 cost of living index in zip code 01068: 113.0 (more than average, U.S. average is 100)
Land area: 20.8 sq. mi. Water area: 0.4 sq. mi.
Population density: 76 people per square mile
(very low).
OSM Map
Google Map
MSN Map
OSM Map
General Map
Google Map
MSN Map
OSM Map
Google Map
MSN Map
OSM Map
Google Map
MSN Map
Please wait while loading the map...
Real estate property taxes paid for housing units in 2022:
This zip code:
1.0% ($3,838)
Massachusetts:
1.0% ($5,536)
Median real estate property taxes paid for housing units with mortgages in 2022: $3,801 (0.9%) Median real estate property taxes paid for housing units with no mortgage in 2022: $3,898 (1.0%)
Estimated median house/condo value in 2022: $403,539
01068:
$403,539
Massachusetts:
$534,700
Median resident age:
This zip code:
49.9 years
Massachusetts median age:
40.3 years
Average household size:
This zip code:
2.5 people
Massachusetts:
2.4 people
Averages for the 2020 tax year for zip code 01068, filed in 2021:
Average Adjusted Gross Income (AGI) in 2020: $78,302 (Individual Income Tax Returns)
Here:
$78,302
State:
$105,130
Salary/wage: $67,215 (reported on 80.0% of returns)
Here:
$67,215
State:
$82,951
(% of AGI for various income ranges: 1244.6% for AGIs below $25k, 2955.3% for AGIs $25k-50k, 6587.3% for AGIs $50k-75k, 10015.6% for AGIs $75k-100k, 17430.8% for AGIs $100k-200k)
Taxable interest for individuals: $838 (reported on 45.0% of returns)
This zip code:
$838
Massachusetts:
$2,361
(% of AGI for various income ranges: 39.2% for AGIs below $25k, 46.7% for AGIs $25k-50k, 47.3% for AGIs $50k-75k, 65.6% for AGIs $75k-100k, 63.8% for AGIs $100k-200k)
Ordinary dividends: $3,257 (reported on 21.0% of returns)
Here:
$3,257
State:
$10,365
(% of AGI for various income ranges: 26.2% for AGIs below $25k, 41.3% for AGIs $25k-50k, 179.1% for AGIs $50k-75k, 88.9% for AGIs $75k-100k, 156.9% for AGIs $100k-200k)
Net capital gain/loss in AGI: +$8,056 (reported on 16.0% of returns)
Here:
+$8,056
State:
+$48,178
(% of AGI for various income ranges: 32.7% for AGIs $50k-75k, 103.3% for AGIs $75k-100k, 458.5% for AGIs $100k-200k)
Profit/loss from business: +$16,262 (reported on 16.0% of returns)
Here:
+$16,262
State:
+$20,792
(% of AGI for various income ranges: 173.1% for AGIs below $25k, 227.3% for AGIs $25k-50k, 329.1% for AGIs $50k-75k, 400.0% for AGIs $75k-100k, 1010.8% for AGIs $100k-200k)
Taxable individual retirement arrangement distribution: $17,318 (reported on 11.0% of returns)
01068:
$17,318
Massachusetts:
$22,790
(% of AGI for various income ranges: 216.7% for AGIs $25k-50k, 596.4% for AGIs $50k-75k, 710.8% for AGIs $100k-200k)
Total itemized deductions: $23,440 (reported on 10.0% of returns)
Here:
$23,440
State:
$36,722
(% of AGI for various income ranges: 425.5% for AGIs $50k-75k, 614.4% for AGIs $75k-100k, 1017.7% for AGIs $100k-200k)
Charity contributions: $2,983 (reported on 6.0% of returns)
Here:
$2,983
State:
$12,529
(% of AGI for various income ranges: 60.9% for AGIs $50k-75k, 86.2% for AGIs $100k-200k)
Taxes paid: $7,710 (reported on 10.0% of returns)
01068:
$7,710
State:
$8,782
(% of AGI for various income ranges: 156.4% for AGIs $50k-75k, 225.6% for AGIs $75k-100k, 304.6% for AGIs $100k-200k)
Earned income credit: $1,717 (reported on 6.0% of returns)
Here:
$1,717
State:
$1,909
(% of AGI for various income ranges: 47.7% for AGIs below $25k, 27.3% for AGIs $25k-50k)
Percentage of individuals using paid preparers for their 2020 taxes: 95.0%
Here:
95%
State:
92%
(% for various income ranges: 95.5% for AGIs below $25k, 94.7% for AGIs $25k-50k, 94.4% for AGIs $50k-75k, 92.9% for AGIs $75k-100k, 95.7% for AGIs $100k-200k, 100.0% for AGIs over 200k)
Averages for the 2012 tax year for zip code 01068, filed in 2013:
Average Adjusted Gross Income (AGI) in 2012: $62,283 (Individual Income Tax Returns)
Here:
$62,283
State:
$81,425
Salary/wage: $56,434 (reported on 83.7% of returns)
Here:
$56,434
State:
$64,752
(% of AGI for various income ranges: 69.4% for AGIs below $25k, 76.5% for AGIs $25k-50k, 74.8% for AGIs $50k-75k, 79.3% for AGIs $75k-100k, 82.6% for AGIs $100k-200k, 57.0% for AGIs over 200k)
Taxable interest for individuals: $592 (reported on 50.0% of returns)
This zip code:
$592
Massachusetts:
$2,136
(% of AGI for various income ranges: 1.1% for AGIs below $25k, 0.8% for AGIs $25k-50k, 0.6% for AGIs $50k-75k, 0.4% for AGIs $75k-100k, 0.3% for AGIs $100k-200k, 0.4% for AGIs over 200k)
Ordinary dividends: $1,757 (reported on 21.4% of returns)
Here:
$1,757
State:
$9,473
(% of AGI for various income ranges: 1.6% for AGIs below $25k, 0.8% for AGIs $25k-50k, 0.8% for AGIs $50k-75k, 0.2% for AGIs $75k-100k, 0.7% for AGIs $100k-200k)
Net capital gain/loss in AGI: +$557 (reported on 14.3% of returns)
Here:
+$557
State:
+$31,437
(% of AGI for various income ranges: 0.6% for AGIs $100k-200k)
Profit/loss from business: +$19,888 (reported on 17.3% of returns)
Here:
+$19,888
State:
+$20,662
(% of AGI for various income ranges: 9.7% for AGIs below $25k, 7.2% for AGIs $25k-50k, 3.6% for AGIs $50k-75k, 4.4% for AGIs $75k-100k, 7.9% for AGIs $100k-200k)
Taxable individual retirement arrangement distribution: $13,378 (reported on 9.2% of returns)
01068:
$13,378
Massachusetts:
$18,892
(% of AGI for various income ranges: 8.3% for AGIs below $25k, 4.7% for AGIs $50k-75k, 2.4% for AGIs $100k-200k)
Total itemized deductions: $20,235 (20% of AGI, reported on 40.8% of returns)
Here:
$20,235
State:
$28,907
Here:
20.2% of AGI
State:
18.2% of AGI
(% of AGI for various income ranges: 12.0% for AGIs below $25k, 11.7% for AGIs $25k-50k, 12.4% for AGIs $50k-75k, 15.1% for AGIs $75k-100k, 13.7% for AGIs $100k-200k, 12.8% for AGIs over 200k)
Charity contributions: $1,740 (reported on 30.6% of returns)
Here:
$1,740
State:
$4,208
(% of AGI for various income ranges: 0.6% for AGIs $25k-50k, 0.6% for AGIs $50k-75k, 0.9% for AGIs $75k-100k, 1.0% for AGIs $100k-200k, 1.4% for AGIs over 200k)
Taxes paid: $8,235 (reported on 40.8% of returns)
01068:
$8,235
State:
$13,303
(% of AGI for various income ranges: 2.7% for AGIs below $25k, 3.1% for AGIs $25k-50k, 4.8% for AGIs $50k-75k, 5.9% for AGIs $75k-100k, 6.3% for AGIs $100k-200k, 6.3% for AGIs over 200k)
Earned income credit: $1,300 (reported on 10.2% of returns)
Here:
$1,300
State:
$1,971
(% of AGI for various income ranges: 3.0% for AGIs below $25k, 0.5% for AGIs $25k-50k)
Percentage of individuals using paid preparers for their 2012 taxes: 58.2%
Here:
58%
State:
56%
(% for various income ranges: 51.7% for AGIs below $25k, 54.5% for AGIs $25k-50k, 66.7% for AGIs $50k-75k, 61.5% for AGIs $75k-100k, 75.0% for AGIs $100k-200k)
Averages for the 2004 tax year for zip code 01068, filed in 2005:
Average Adjusted Gross Income (AGI) in 2004: $53,401 (Individual Income Tax Returns)
Here:
$53,401
State:
$62,877
Salary/wage: $48,660 (reported on 89.0% of returns)
Here:
$48,660
State:
$52,969
(% of AGI for various income ranges: 82.9% for AGIs below $10k, 73.8% for AGIs $10k-25k, 83.4% for AGIs $25k-50k, 82.9% for AGIs $50k-75k, 89.0% for AGIs $75k-100k, 75.3% for AGIs over 100k)
Taxable interest for individuals: $826 (reported on 65.6% of returns)
This zip code:
$826
Massachusetts:
$1,945
(% of AGI for various income ranges: 4.4% for AGIs below $10k, 1.1% for AGIs $10k-25k, 0.8% for AGIs $25k-50k, 1.2% for AGIs $50k-75k, 0.8% for AGIs $75k-100k, 1.0% for AGIs over 100k)
Taxable dividends: $1,362 (reported on 26.7% of returns)
Here:
$1,362
State:
$5,323
(% of AGI for various income ranges: 5.9% for AGIs below $10k, 0.9% for AGIs $10k-25k, 0.7% for AGIs $25k-50k, 0.3% for AGIs $50k-75k, 0.6% for AGIs $75k-100k, 0.8% for AGIs over 100k)
Net capital gain/loss: +$6,866 (reported on 19.4% of returns)
Here:
+$6,866
State:
+$20,377
(% of AGI for various income ranges: -2.1% for AGIs below $10k, -0.1% for AGIs $10k-25k, -0.3% for AGIs $25k-50k, 0.9% for AGIs $50k-75k, 0.0% for AGIs $75k-100k, 6.9% for AGIs over 100k)
Profit/loss from business: +$14,669 (reported on 19.3% of returns)
Here:
+$14,669
State:
+$17,837
(% of AGI for various income ranges: 14.2% for AGIs below $10k, 10.6% for AGIs $10k-25k, 6.3% for AGIs $25k-50k, 6.9% for AGIs $50k-75k, 3.9% for AGIs $75k-100k, 3.6% for AGIs over 100k)
IRA payment deduction: $3,067 (reported on 3.3% of returns)
01068:
$3,067
Massachusetts:
$3,100
Total itemized deductions: $17,244 (21% of AGI, reported on 47.5% of returns)
Here:
$17,244
State:
$22,573
Here:
20.9% of AGI
State:
19.5% of AGI
(% of AGI for various income ranges: 15.3% for AGIs $10k-25k, 12.9% for AGIs $25k-50k, 17.2% for AGIs $50k-75k, 16.6% for AGIs $75k-100k, 15.1% for AGIs over 100k)
Charity contributions deductions: $1,756 (2% of AGI, reported on 41.8% of returns)
Here:
$1,756
State:
$3,295
Here:
2.1% of AGI
State:
2.7% of AGI
(% of AGI for various income ranges: 0.5% for AGIs $10k-25k, 0.7% for AGIs $25k-50k, 1.0% for AGIs $50k-75k, 1.4% for AGIs $75k-100k, 2.1% for AGIs over 100k)
Total tax: $7,137 (reported on 83.6% of returns)
01068:
$7,137
State:
$11,494
(% of AGI for various income ranges: 3.3% for AGIs below $10k, 6.0% for AGIs $10k-25k, 7.7% for AGIs $25k-50k, 8.6% for AGIs $50k-75k, 10.0% for AGIs $75k-100k, 16.1% for AGIs over 100k)
Earned income credit: $1,206 (reported on 6.8% of returns)
Here:
$1,206
State:
$1,518
Percentage of individuals using paid preparers for their 2004 taxes: 57.9%
Here:
58%
State:
58%
(% for various income ranges: 44.7% for AGIs below $10k, 60.6% for AGIs $10k-25k, 53.7% for AGIs $25k-50k, 61.2% for AGIs $50k-75k, 60.2% for AGIs $75k-100k, 71.7% for AGIs over 100k)
Likely homosexual households (counted as self-reported same-sex unmarried-partner households)
Lesbian couples: 0.5% of all households
Gay men: 0.0% of all households
Household received Food Stamps/SNAP in the past 12 months: 80 Household did not receive Food Stamps/SNAP in the past 12 months: 542
Women who had a birth in the past 12 months: 13 (14 now married, 0 unmarried) Women who did not have a birth in the past 12 months: 290 (116 now married, 172 unmarried)
Housing units in zip code 01068 with a mortgage: 331 (38 second mortgage, 35 both second mortgage and home equity loan) Houses without a mortgage: 26
Median monthly owner costs for units with a mortgage: $1,933 Median monthly owner costs for units without a mortgage: $714
Residents with income below the poverty level in 2022:
This zip code:
5.5%
Whole state:
10.4%
Residents with income below 50% of the poverty level in 2022:
This zip code:
2.8%
Whole state:
5.1%
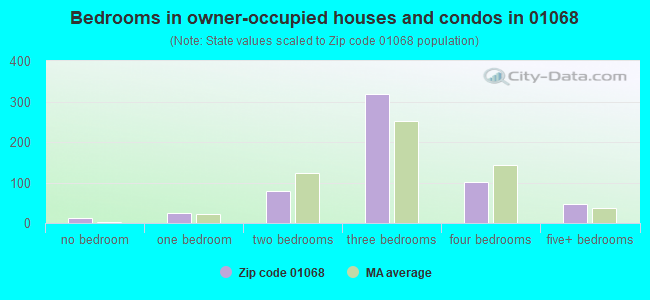
Median number of rooms in houses and condos:
Here:
7.0
State:
6.5
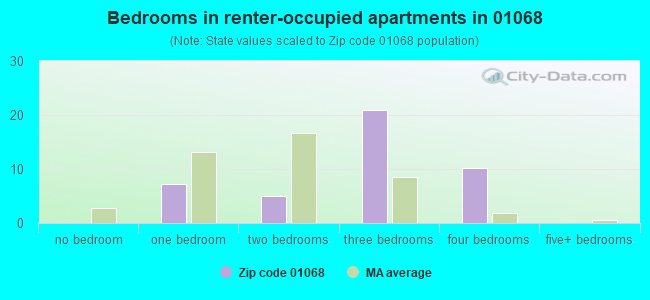
Median number of rooms in apartments:
Here:
5.5
State:
4.0
Notable locations in this zip code not listed on our city pages
Notable locations in zip code 01068: Camp Treasure Valley (A), Oakham Fire Department (B), Fobes Memorial Library (C). Display/hide their locations on the map
Cemeteries: Southwest Cemetery (1), Oakham Center Cemetery (2), South Cemetery (3), West Cemetery (4), Green Hollow Cemetery (5). Display/hide their locations on the map
Lakes and reservoirs: Peg Millpond (A), Muddy Pond (B), Foley Pond (C), Davis Pond (D), Browning Pond (E), Dean Pond (F), Adams Pond (G). Display/hide their locations on the map
In group quarters: 14 (-1 institutionalized population)
Size of family households: 250 2-persons, 88 3-persons, 76 4-persons, 20 5-persons, 26 6-persons
Size of nonfamily households: 122 1-person, 27 2-persons, 10 3-persons
215 married couples with children.
20 single-parent households (1 men, 19 women).
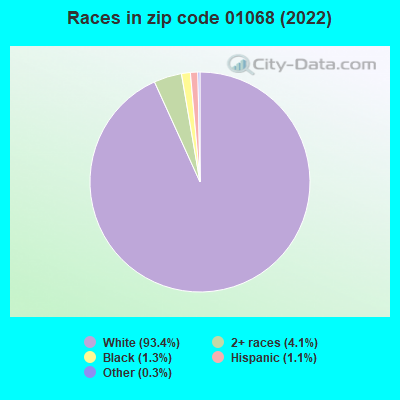
96.4% of residents of 01068 zip code speak English at home.
0.7% of residents speak Spanish at home (90% very well, 10% not well).
2.3% of residents speak other Indo-European language at home (94% very well, 6% not well).
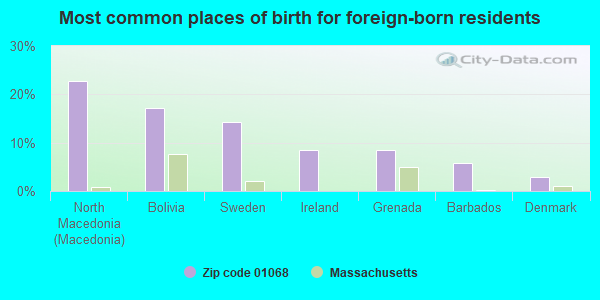
Foreign born population: 36 (2.3%) (69.0% of them are naturalized citizens)
This zip code:
2.3%
Whole state:
18.0%
23%North Macedonia (Macedonia)
17%Bolivia
14%Sweden
9%Ireland
9%Grenada
6%Barbados
3%Denmark
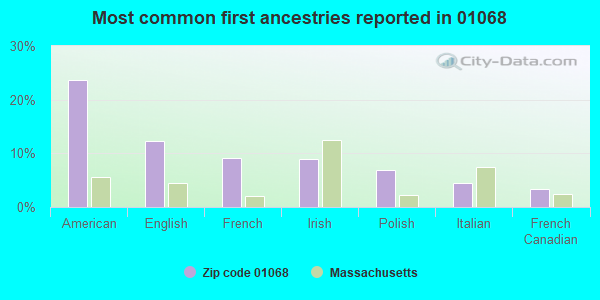
24%American
12%English
9%French
9%Irish
7%Polish
4%Italian
3%French Canadian
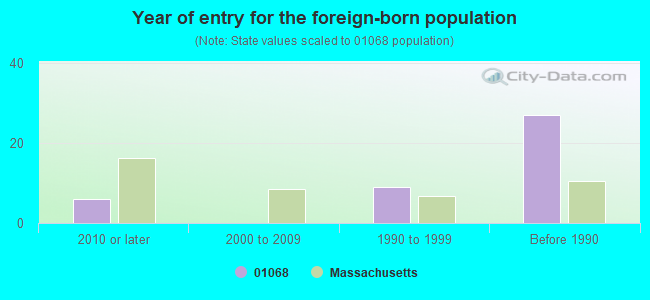
Year of entry for the foreign-born population
62010 or later
02000 to 2009
91990 to 1999
27Before 1990
Facilities with environmental interests located in this zip code:
OAKHAM CENTER (COLDBROOK RD in OAKHAM, MA)
(National Center for Education Statistics) - STATE ID-753025 Organizations: QUABBIN (SCHOOL DISTRICT)
OAKHAM (OAKHAM in OAKHAM, MA)
AIR MINOR (AIRS/AFS) Business SIC classification: GENERAL GOVERNMENT
OAKHAM LANDFILL (SOUTH RD in OAKHAM, MA)
CRITERIA AND HAZARDOUS AIR POLLUTANT INVENTORY (Inventory of air pollution sources) Business SIC classification: REFUSE SYSTEMS Business NAICS classification: SOLID WASTE LANDFILL.
Housing units lacking complete plumbing facilities: 0.6%
59.1%Fuel oil, kerosene, etc.
16.7%Wood
11.9%Bottled, tank, or LP gas
8.2%Electricity
2.8%Other fuel
1.0%Utility gas
0.7%Coal or coke
Population in 1990: 1,503. Population change in the 1990s: +213 (+14.2%).
Place of birth for U.S.-born residents:
This state: 1,321
Northeast: 127
Midwest: 35
South: 17
West: 24
82% of the 01068 zip code residents lived in the same house 5 years ago. Out of people who lived in different houses, 82% lived in this county. Out of people who lived in different counties, 50% lived in Massachusetts.
95% of the 01068 zip code residents lived in the same house 1 year ago. Out of people who lived in different houses, 75% moved from this county. Out of people who lived in different houses, 21% moved from different county within same state.
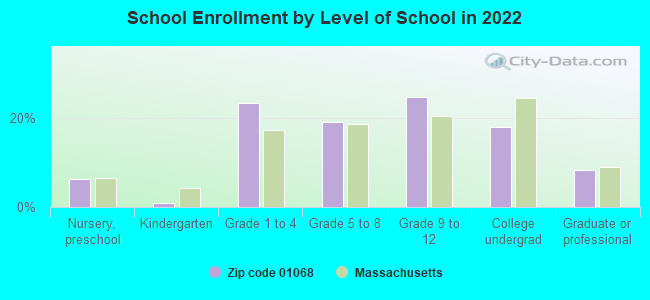
Private vs. public school enrollment:
Students in private schools in grades 1 to 8 (elementary and middle school): 32
Here:
24.8%
Massachusetts:
10.3%
Students in private schools in grades 9 to 12 (high school):
Here:
0.0%
Massachusetts:
12.3%
Students in private undergraduate colleges: 15
Here:
27.7%
Massachusetts:
51.2%
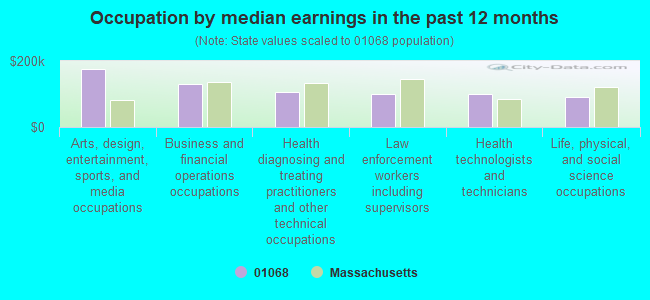
Occupation by median earnings in the past 12 months ($)
174,957Arts, design, entertainment, sports, and media occupations
129,581Business and financial operations occupations
104,974Health diagnosing and treating practitioners and other technical occupations
101,015Law enforcement workers including supervisors
98,977Health technologists and technicians
92,207Life, physical, and social science occupations
Top industries in this zip code by the number of employees in 2005:
Wholesale Trade: Other Grocery and Related Products Merchant Wholesalers (20-49 employees: 1 establishment)
Wholesale Trade: Motor Vehicle Supplies and New Parts Merchant Wholesalers (10-19: 1)
Health Care and Social Assistance: Child Day Care Services (5-9: 1)
Accommodation and Food Services: RV (Recreational Vehicle) Parks and Campgrounds (5-9: 1)
Construction: Electrical Contractors (5-9: 1)
Construction: New Single-Family Housing Construction (except Operative Builders) (5-9: 1)
Professional, Scientific, and Technical Services: Offices of Certified Public Accountants (1-4: 1)
People in group quarters in 2010:
7 people in group homes intended for adults
Fatal accident statistics in 2014:
Fatal accident count: 3
Vehicles involved in fatal accidents: 3
Fatal accidents caused by drunken drivers: 2
Fatalities: 3
Persons involved in fatal accidents: 5
Pedestrians involved in fatal accidents: 0
Home Mortgage Disclosure Act Aggregated Statistics For Year 2009 (Based on 2 partial tracts)
A) FHA, FSA/RHS & VA Home Purchase Loans
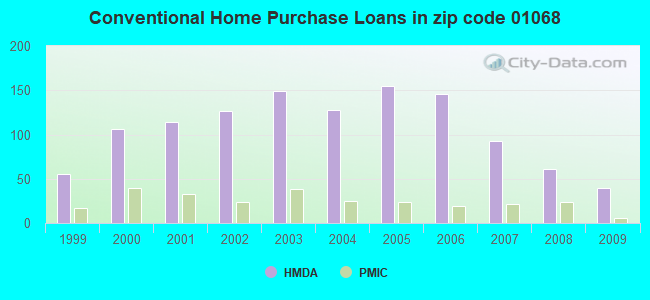
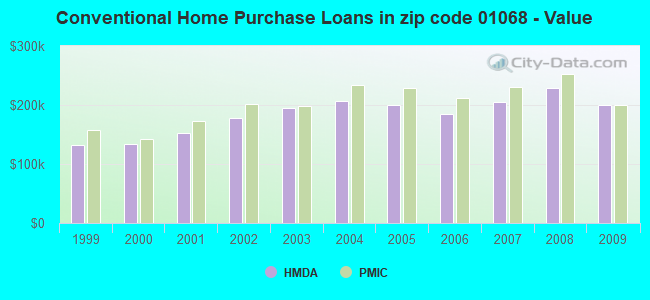
B) Conventional Home Purchase Loans
C) Refinancings
D) Home Improvement Loans
F) Non-occupant Loans on < 5 Family Dwellings (A B C & D)
G) Loans On Manufactured Home Dwelling (A B C & D)
Number
Average Value
Number
Average Value
Number
Average Value
Number
Average Value
Number
Average Value
Number
Average Value
LOANS ORIGINATED
29
$270,569
39
$200,692
228
$212,048
18
$112,114
3
$118,190
1
$83,590
APPLICATIONS APPROVED, NOT ACCEPTED
1
$195,050
1
$352,480
15
$236,008
2
$32,740
0
$0
1
$26,470
APPLICATIONS DENIED
6
$182,973
6
$145,705
68
$224,920
9
$79,799
1
$307,200
0
$0
APPLICATIONS WITHDRAWN
6
$240,907
8
$197,921
38
$247,055
3
$95,203
1
$141,410
0
$0
FILES CLOSED FOR INCOMPLETENESS
1
$184,600
3
$154,877
20
$234,441
0
$0
0
$0
0
$0
Aggregated Statistics For Year 2008 (Based on 2 partial tracts)
A) FHA, FSA/RHS & VA Home Purchase Loans
B) Conventional Home Purchase Loans
C) Refinancings
D) Home Improvement Loans
F) Non-occupant Loans on < 5 Family Dwellings (A B C & D)
G) Loans On Manufactured Home Dwelling (A B C & D)
Number
Average Value
Number
Average Value
Number
Average Value
Number
Average Value
Number
Average Value
Number
Average Value
LOANS ORIGINATED
14
$249,582
61
$228,713
123
$215,317
28
$63,913
11
$211,766
1
$96,830
APPLICATIONS APPROVED, NOT ACCEPTED
1
$132,350
12
$260,587
15
$229,739
3
$107,510
1
$337,850
1
$17,410
APPLICATIONS DENIED
3
$238,003
10
$210,443
49
$243,170
15
$50,480
2
$142,455
1
$73,140
APPLICATIONS WITHDRAWN
2
$223,260
5
$212,742
20
$231,410
3
$148,840
1
$136,530
0
$0
FILES CLOSED FOR INCOMPLETENESS
0
$0
1
$356,660
8
$296,490
1
$34,830
0
$0
0
$0
Aggregated Statistics For Year 2007 (Based on 2 partial tracts)
A) FHA, FSA/RHS & VA Home Purchase Loans
B) Conventional Home Purchase Loans
C) Refinancings
D) Home Improvement Loans
E) Loans on Dwellings For 5+ Families
F) Non-occupant Loans on < 5 Family Dwellings (A B C & D)
G) Loans On Manufactured Home Dwelling (A B C & D)
Number
Average Value
Number
Average Value
Number
Average Value
Number
Average Value
Number
Average Value
Number
Average Value
Number
Average Value
LOANS ORIGINATED
3
$208,747
93
$205,235
143
$178,013
47
$53,949
3
$1,335,383
7
$172,459
3
$102,167
APPLICATIONS APPROVED, NOT ACCEPTED
0
$0
10
$233,222
26
$207,882
3
$54,103
0
$0
2
$233,360
0
$0
APPLICATIONS DENIED
0
$0
13
$182,509
104
$203,166
8
$94,389
0
$0
2
$151,510
1
$165,790
APPLICATIONS WITHDRAWN
1
$181,810
3
$229,647
30
$187,594
2
$224,655
0
$0
0
$0
0
$0
FILES CLOSED FOR INCOMPLETENESS
0
$0
3
$197,833
13
$238,237
1
$45,280
0
$0
0
$0
0
$0
Aggregated Statistics For Year 2006 (Based on 2 partial tracts)
A) FHA, FSA/RHS & VA Home Purchase Loans
B) Conventional Home Purchase Loans
C) Refinancings
D) Home Improvement Loans
E) Loans on Dwellings For 5+ Families
F) Non-occupant Loans on < 5 Family Dwellings (A B C & D)
G) Loans On Manufactured Home Dwelling (A B C & D)
Number
Average Value
Number
Average Value
Number
Average Value
Number
Average Value
Number
Average Value
Number
Average Value
Number
Average Value
LOANS ORIGINATED
1
$370,590
146
$184,394
181
$175,697
45
$72,648
1
$222,910
8
$154,558
0
$0
APPLICATIONS APPROVED, NOT ACCEPTED
0
$0
18
$172,331
36
$168,616
2
$39,705
0
$0
1
$128,870
0
$0
APPLICATIONS DENIED
0
$0
24
$151,859
82
$213,177
16
$64,609
0
$0
1
$18,810
2
$67,220
APPLICATIONS WITHDRAWN
0
$0
8
$164,224
59
$199,700
8
$96,392
0
$0
0
$0
0
$0
FILES CLOSED FOR INCOMPLETENESS
0
$0
1
$76,630
22
$199,386
1
$59,210
0
$0
2
$228,485
0
$0
Aggregated Statistics For Year 2005 (Based on 2 partial tracts)
A) FHA, FSA/RHS & VA Home Purchase Loans
B) Conventional Home Purchase Loans
C) Refinancings
D) Home Improvement Loans
F) Non-occupant Loans on < 5 Family Dwellings (A B C & D)
G) Loans On Manufactured Home Dwelling (A B C & D)
Number
Average Value
Number
Average Value
Number
Average Value
Number
Average Value
Number
Average Value
Number
Average Value
LOANS ORIGINATED
0
$0
155
$200,351
242
$188,445
40
$88,921
15
$140,249
1
$121,910
APPLICATIONS APPROVED, NOT ACCEPTED
1
$241,720
20
$173,280
24
$188,866
6
$98,220
4
$148,375
1
$78,720
APPLICATIONS DENIED
1
$139,320
31
$184,914
88
$206,352
8
$68,092
3
$95,667
1
$211,770
APPLICATIONS WITHDRAWN
0
$0
20
$189,788
80
$195,457
8
$152,208
1
$31,350
0
$0
FILES CLOSED FOR INCOMPLETENESS
0
$0
6
$203,523
45
$245,095
0
$0
1
$165,790
0
$0
Aggregated Statistics For Year 2004 (Based on 2 partial tracts)
A) FHA, FSA/RHS & VA Home Purchase Loans
B) Conventional Home Purchase Loans
C) Refinancings
D) Home Improvement Loans
E) Loans on Dwellings For 5+ Families
F) Non-occupant Loans on < 5 Family Dwellings (A B C & D)
G) Loans On Manufactured Home Dwelling (A B C & D)
Number
Average Value
Number
Average Value
Number
Average Value
Number
Average Value
Number
Average Value
Number
Average Value
Number
Average Value
LOANS ORIGINATED
6
$170,552
128
$206,950
251
$184,677
49
$96,557
1
$696,600
11
$123,362
1
$116,330
APPLICATIONS APPROVED, NOT ACCEPTED
1
$229,880
8
$237,715
31
$178,127
8
$42,405
0
$0
4
$109,018
0
$0
APPLICATIONS DENIED
1
$85,680
17
$207,628
47
$182,539
13
$49,405
0
$0
2
$91,950
0
$0
APPLICATIONS WITHDRAWN
0
$0
13
$224,145
65
$181,438
6
$63,507
0
$0
1
$374,070
0
$0
FILES CLOSED FOR INCOMPLETENESS
0
$0
2
$251,125
51
$194,037
2
$250,430
0
$0
0
$0
0
$0
Aggregated Statistics For Year 2003 (Based on 2 partial tracts)
A) FHA, FSA/RHS & VA Home Purchase Loans
B) Conventional Home Purchase Loans
C) Refinancings
D) Home Improvement Loans
F) Non-occupant Loans on < 5 Family Dwellings (A B C & D)
Number
Average Value
Number
Average Value
Number
Average Value
Number
Average Value
Number
Average Value
LOANS ORIGINATED
6
$205,382
149
$194,104
665
$157,640
29
$36,391
21
$81,038
APPLICATIONS APPROVED, NOT ACCEPTED
0
$0
12
$209,270
62
$153,083
4
$43,190
1
$111,460
APPLICATIONS DENIED
1
$80,810
12
$110,527
94
$160,500
7
$62,296
2
$59,560
APPLICATIONS WITHDRAWN
1
$194,350
13
$205,818
82
$161,101
1
$20,900
3
$157,430
FILES CLOSED FOR INCOMPLETENESS
1
$146,980
2
$185,645
10
$165,651
0
$0
0
$0
Aggregated Statistics For Year 2002 (Based on 2 partial tracts)
A) FHA, FSA/RHS & VA Home Purchase Loans
B) Conventional Home Purchase Loans
C) Refinancings
D) Home Improvement Loans
F) Non-occupant Loans on < 5 Family Dwellings (A B C & D)
Number
Average Value
Number
Average Value
Number
Average Value
Number
Average Value
Number
Average Value
LOANS ORIGINATED
11
$185,865
126
$178,700
403
$150,512
33
$35,527
12
$43,538
APPLICATIONS APPROVED, NOT ACCEPTED
1
$152,560
13
$166,595
55
$133,798
8
$32,914
3
$105,420
APPLICATIONS DENIED
1
$237,540
11
$113,293
52
$119,896
12
$46,672
6
$54,683
APPLICATIONS WITHDRAWN
0
$0
10
$167,532
59
$128,045
3
$34,830
1
$119,120
FILES CLOSED FOR INCOMPLETENESS
0
$0
1
$97,520
9
$140,868
1
$41,800
1
$37,620
Aggregated Statistics For Year 2001 (Based on 2 partial tracts)
A) FHA, FSA/RHS & VA Home Purchase Loans
B) Conventional Home Purchase Loans
C) Refinancings
D) Home Improvement Loans
E) Loans on Dwellings For 5+ Families
F) Non-occupant Loans on < 5 Family Dwellings (A B C & D)
Number
Average Value
Number
Average Value
Number
Average Value
Number
Average Value
Number
Average Value
Number
Average Value
LOANS ORIGINATED
9
$165,946
114
$151,938
297
$136,470
24
$40,345
2
$184,945
8
$58,515
APPLICATIONS APPROVED, NOT ACCEPTED
1
$123,300
10
$163,562
31
$99,097
8
$45,628
0
$0
0
$0
APPLICATIONS DENIED
1
$68,270
11
$91,951
42
$112,551
8
$42,405
1
$27,860
1
$76,630
APPLICATIONS WITHDRAWN
0
$0
6
$189,475
46
$113,576
6
$51,317
0
$0
1
$31,350
FILES CLOSED FOR INCOMPLETENESS
1
$41,800
2
$266,800
8
$121,295
1
$18,810
0
$0
0
$0
Aggregated Statistics For Year 2000 (Based on 2 partial tracts)
A) FHA, FSA/RHS & VA Home Purchase Loans
B) Conventional Home Purchase Loans
C) Refinancings
D) Home Improvement Loans
E) Loans on Dwellings For 5+ Families
F) Non-occupant Loans on < 5 Family Dwellings (A B C & D)
Number
Average Value
Number
Average Value
Number
Average Value
Number
Average Value
Number
Average Value
Number
Average Value
LOANS ORIGINATED
10
$149,769
106
$133,412
62
$97,457
26
$22,613
1
$250,780
8
$57,034
APPLICATIONS APPROVED, NOT ACCEPTED
1
$126,780
9
$103,561
9
$89,010
8
$30,911
0
$0
1
$13,930
APPLICATIONS DENIED
1
$167,880
15
$102,447
40
$72,081
15
$24,288
0
$0
1
$33,440
APPLICATIONS WITHDRAWN
1
$48,070
7
$113,446
29
$73,599
4
$60,082
0
$0
1
$9,750
FILES CLOSED FOR INCOMPLETENESS
0
$0
1
$89,160
5
$174,010
1
$12,540
0
$0
0
$0
Aggregated Statistics For Year 1999 (Based on 1 partial tract)
A) FHA, FSA/RHS & VA Home Purchase Loans
B) Conventional Home Purchase Loans
C) Refinancings
D) Home Improvement Loans
F) Non-occupant Loans on < 5 Family Dwellings (A B C & D)
Detailed PMIC statistics for the following Tracts:7211.00
2002 - 2018 National Fire Incident Reporting System (NFIRS) incidents
Based on the data from the years 2002 - 2018 the average number of fire incidents per year is 12. The highest number of fire incidents - 21 took place in 2015, and the least - 4 in 2017. The data has a dropping trend.
When looking into fire subcategories, the most reports belonged to: Structure Fires (54.6%), and Outside Fires (34.1%).
Fire incident types reported to NFIRS in Zip Code 01068


 Nearest zip codes: 01074, 01543, 01535, 01531, 01005, 01094.
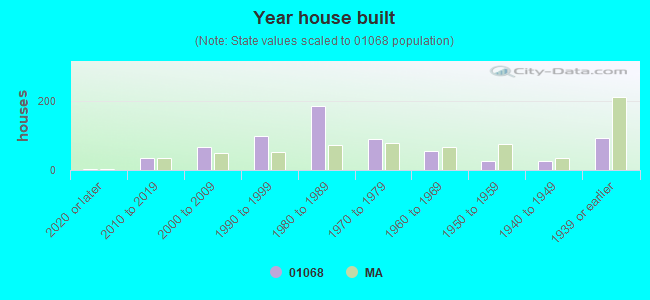


 Based on the data from the years 2002 - 2018 the average number of fire incidents per year is 12. The highest number of fire incidents - 21 took place in 2015, and the least - 4 in 2017. The data has a dropping trend.
 When looking into fire subcategories, the most reports belonged to: Structure Fires (54.6%), and Outside Fires (34.1%).