Estimated zip code population in 2022: 4,884 Zip code population in 2010: 4,608 Zip code population in 2000: 4,631
Houses and condos: 2,015 Renter-occupied apartments: 396
% of renters here:
21%
State:
37%
March 2022 cost of living index in zip code 02832: 88.7 (less than average, U.S. average is 100)
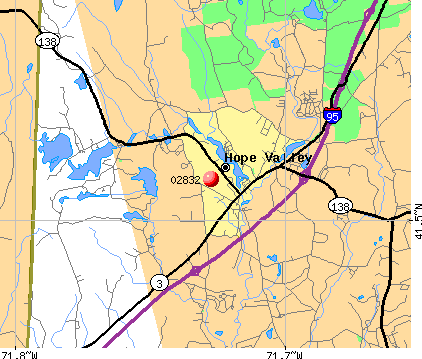
Land area: 22.3 sq. mi. Water area: 0.6 sq. mi.
Population density: 219 people per square mile
(very low).
OSM Map
Google Map
MSN Map
OSM Map
General Map
Google Map
MSN Map
OSM Map
Google Map
MSN Map
OSM Map
Google Map
MSN Map
Please wait while loading the map...
Real estate property taxes paid for housing units in 2022:
This zip code:
1.4% ($6,105)
Rhode Island:
1.2% ($4,726)
Median real estate property taxes paid for housing units with mortgages in 2022: $6,060 (1.4%) Median real estate property taxes paid for housing units with no mortgage in 2022: $6,201 (1.3%)
Business Search- 14 Million verified businesses
Males: 2,527
(51.7%)
Females: 2,356
(48.3%)
For population 25 years and over in 02832:
High school or higher: 92.9%
Bachelor's degree or higher: 39.2%
Graduate or professional degree: 9.1%
Unemployed: 3.5%
Mean travel time to work (commute): 34.6 minutes
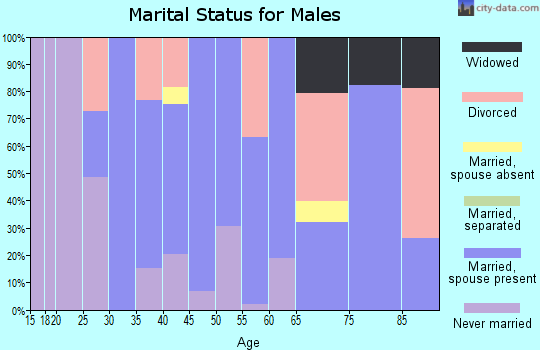
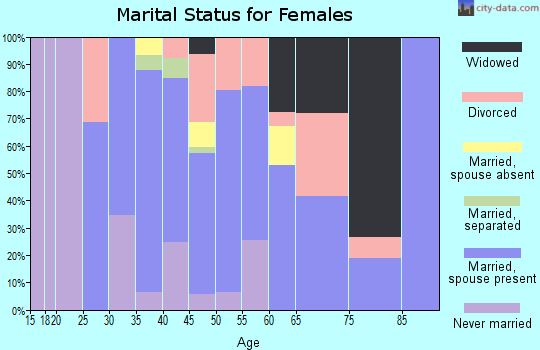
For population 15 years and over in 02832:
Never married: 28.7%
Now married: 61.2%
Separated: 0.7%
Widowed: 2.1%
Divorced: 7.3%
Zip code 02832 compared to state average:
Black race population percentage significantly below state average.
Hispanic race population percentage significantly below state average.
Foreign-born population percentage significantly below state average.
Renting percentage below state average.
Length of stay since moving in above state average.
Estimated median house/condo value in 2022: $449,916
02832:
$449,916
Rhode Island:
$383,900
According to our research of Rhode Island and other state lists, there were 5 registered sex offenders living in 02832 zip code as of May 21, 2024. The ratio of all residents to sex offenders in zip code 02832 is 982 to 1. The ratio of registered sex offenders to all residents in this zip code is near the state average.
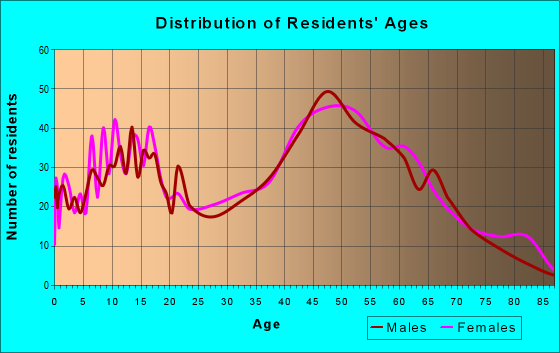
Median resident age:
This zip code:
40.2 years
Rhode Island median age:
40.7 years
Average household size:
This zip code:
2.6 people
Rhode Island:
2.4 people
Averages for the 2020 tax year for zip code 02832, filed in 2021:
Average Adjusted Gross Income (AGI) in 2020: $71,113 (Individual Income Tax Returns)
Here:
$71,113
State:
$74,300
Salary/wage: $64,982 (reported on 81.2% of returns)
Here:
$64,982
State:
$60,330
(% of AGI for various income ranges: 1025.6% for AGIs below $25k, 3301.4% for AGIs $25k-50k, 6356.8% for AGIs $50k-75k, 9261.6% for AGIs $75k-100k, 19300.3% for AGIs $100k-200k, 67310.0% for AGIs over 200k)
Taxable interest for individuals: $861 (reported on 34.5% of returns)
This zip code:
$861
Rhode Island:
$1,971
(% of AGI for various income ranges: 23.3% for AGIs below $25k, 15.7% for AGIs $25k-50k, 33.6% for AGIs $50k-75k, 73.7% for AGIs $75k-100k, 80.0% for AGIs $100k-200k, 353.3% for AGIs over 200k)
Ordinary dividends: $3,390 (reported on 22.2% of returns)
Here:
$3,390
State:
$7,621
(% of AGI for various income ranges: 44.2% for AGIs below $25k, 22.4% for AGIs $25k-50k, 58.9% for AGIs $50k-75k, 154.7% for AGIs $75k-100k, 213.9% for AGIs $100k-200k, 1693.3% for AGIs over 200k)
Net capital gain/loss in AGI: +$10,074 (reported on 18.0% of returns)
Here:
+$10,074
State:
+$26,041
(% of AGI for various income ranges: 10.9% for AGIs below $25k, 31.9% for AGIs $25k-50k, 83.6% for AGIs $50k-75k, 187.9% for AGIs $75k-100k, 493.9% for AGIs $100k-200k, 7770.0% for AGIs over 200k)
Profit/loss from business: +$13,943 (reported on 14.2% of returns)
Here:
+$13,943
State:
+$15,775
(% of AGI for various income ranges: 112.7% for AGIs below $25k, 185.5% for AGIs $25k-50k, 359.6% for AGIs $50k-75k, 440.5% for AGIs $75k-100k, 365.5% for AGIs $100k-200k, 2743.3% for AGIs over 200k)
Taxable individual retirement arrangement distribution: $14,511 (reported on 10.7% of returns)
02832:
$14,511
Rhode Island:
$18,801
(% of AGI for various income ranges: 91.3% for AGIs below $25k, 114.0% for AGIs $25k-50k, 180.0% for AGIs $50k-75k, 380.0% for AGIs $75k-100k, 590.0% for AGIs $100k-200k)
Total itemized deductions: $24,903 (reported on 11.5% of returns)
Here:
$24,903
State:
$29,550
(% of AGI for various income ranges: 270.7% for AGIs $25k-50k, 350.4% for AGIs $50k-75k, 623.7% for AGIs $75k-100k, 927.6% for AGIs $100k-200k, 3690.0% for AGIs over 200k)
Charity contributions: $3,090 (reported on 8.0% of returns)
Here:
$3,090
State:
$7,826
(% of AGI for various income ranges: 10.5% for AGIs $25k-50k, 13.6% for AGIs $50k-75k, 34.7% for AGIs $75k-100k, 112.4% for AGIs $100k-200k, 433.3% for AGIs over 200k)
Taxes paid: $8,673 (reported on 11.5% of returns)
02832:
$8,673
State:
$8,398
(% of AGI for various income ranges: 73.1% for AGIs $25k-50k, 150.4% for AGIs $50k-75k, 274.2% for AGIs $75k-100k, 324.2% for AGIs $100k-200k, 943.3% for AGIs over 200k)
Earned income credit: $1,687 (reported on 8.8% of returns)
Here:
$1,687
State:
$2,059
(% of AGI for various income ranges: 50.4% for AGIs below $25k, 38.3% for AGIs $25k-50k)
Percentage of individuals using paid preparers for their 2020 taxes: 91.6%
Here:
92%
State:
94%
(% for various income ranges: 90.0% for AGIs below $25k, 94.4% for AGIs $25k-50k, 92.3% for AGIs $50k-75k, 90.0% for AGIs $75k-100k, 89.7% for AGIs $100k-200k, 100.0% for AGIs over 200k)
Averages for the 2012 tax year for zip code 02832, filed in 2013:
Average Adjusted Gross Income (AGI) in 2012: $61,497 (Individual Income Tax Returns)
Here:
$61,497
State:
$60,628
Salary/wage: $54,761 (reported on 85.6% of returns)
Here:
$54,761
State:
$50,029
(% of AGI for various income ranges: 72.7% for AGIs below $25k, 77.3% for AGIs $25k-50k, 75.3% for AGIs $50k-75k, 76.2% for AGIs $75k-100k, 82.9% for AGIs $100k-200k, 59.2% for AGIs over 200k)
Taxable interest for individuals: $868 (reported on 39.0% of returns)
This zip code:
$868
Rhode Island:
$1,640
(% of AGI for various income ranges: 0.9% for AGIs below $25k, 0.4% for AGIs $25k-50k, 0.7% for AGIs $50k-75k, 0.7% for AGIs $75k-100k, 0.4% for AGIs $100k-200k, 0.4% for AGIs over 200k)
Ordinary dividends: $2,978 (reported on 23.3% of returns)
Here:
$2,978
State:
$6,396
(% of AGI for various income ranges: 1.1% for AGIs below $25k, 0.7% for AGIs $25k-50k, 1.6% for AGIs $50k-75k, 0.7% for AGIs $75k-100k, 0.8% for AGIs $100k-200k, 2.5% for AGIs over 200k)
Net capital gain/loss in AGI: +$4,214 (reported on 15.3% of returns)
Here:
+$4,214
State:
+$15,680
(% of AGI for various income ranges: 0.9% for AGIs $50k-75k, 0.8% for AGIs $75k-100k, 1.1% for AGIs $100k-200k, 3.0% for AGIs over 200k)
Profit/loss from business: +$11,306 (reported on 14.8% of returns)
Here:
+$11,306
State:
+$15,678
(% of AGI for various income ranges: 7.5% for AGIs below $25k, 5.6% for AGIs $25k-50k, 2.6% for AGIs $50k-75k, 2.0% for AGIs $75k-100k, 2.2% for AGIs $100k-200k)
Taxable individual retirement arrangement distribution: $15,100 (reported on 9.7% of returns)
02832:
$15,100
Rhode Island:
$14,081
(% of AGI for various income ranges: 3.5% for AGIs below $25k, 1.9% for AGIs $25k-50k, 2.5% for AGIs $50k-75k, 1.9% for AGIs $75k-100k, 3.4% for AGIs $100k-200k)
Total itemized deductions: $21,428 (22% of AGI, reported on 45.8% of returns)
Here:
$21,428
State:
$24,445
Here:
21.8% of AGI
State:
20.5% of AGI
(% of AGI for various income ranges: 11.5% for AGIs below $25k, 12.4% for AGIs $25k-50k, 18.9% for AGIs $50k-75k, 17.2% for AGIs $75k-100k, 17.0% for AGIs $100k-200k, 13.3% for AGIs over 200k)
Charity contributions: $1,857 (reported on 37.3% of returns)
Here:
$1,857
State:
$2,961
(% of AGI for various income ranges: 0.3% for AGIs below $25k, 0.6% for AGIs $25k-50k, 1.1% for AGIs $50k-75k, 1.1% for AGIs $75k-100k, 1.3% for AGIs $100k-200k, 1.6% for AGIs over 200k)
Taxes paid: $10,311 (reported on 45.8% of returns)
02832:
$10,311
State:
$11,235
(% of AGI for various income ranges: 3.4% for AGIs below $25k, 5.0% for AGIs $25k-50k, 7.9% for AGIs $50k-75k, 8.5% for AGIs $75k-100k, 8.7% for AGIs $100k-200k, 8.1% for AGIs over 200k)
Earned income credit: $1,782 (reported on 11.9% of returns)
Here:
$1,782
State:
$2,170
(% of AGI for various income ranges: 4.3% for AGIs below $25k, 0.6% for AGIs $25k-50k)
Percentage of individuals using paid preparers for their 2012 taxes: 50.0%
Here:
50%
State:
60%
(% for various income ranges: 39.7% for AGIs below $25k, 49.0% for AGIs $25k-50k, 56.8% for AGIs $50k-75k, 59.3% for AGIs $75k-100k, 56.4% for AGIs $100k-200k, 66.7% for AGIs over 200k)
Averages for the 2004 tax year for zip code 02832, filed in 2005:
Average Adjusted Gross Income (AGI) in 2004: $52,599 (Individual Income Tax Returns)
Here:
$52,599
State:
$51,090
Salary/wage: $47,668 (reported on 88.5% of returns)
Here:
$47,668
State:
$43,690
(% of AGI for various income ranges: 101.9% for AGIs below $10k, 78.0% for AGIs $10k-25k, 79.6% for AGIs $25k-50k, 84.4% for AGIs $50k-75k, 85.0% for AGIs $75k-100k, 75.2% for AGIs over 100k)
Taxable interest for individuals: $960 (reported on 58.5% of returns)
This zip code:
$960
Rhode Island:
$1,567
(% of AGI for various income ranges: 6.1% for AGIs below $10k, 2.4% for AGIs $10k-25k, 0.9% for AGIs $25k-50k, 0.7% for AGIs $50k-75k, 0.6% for AGIs $75k-100k, 1.2% for AGIs over 100k)
Taxable dividends: $2,270 (reported on 26.7% of returns)
Here:
$2,270
State:
$3,896
(% of AGI for various income ranges: 5.7% for AGIs below $10k, 1.3% for AGIs $10k-25k, 0.8% for AGIs $25k-50k, 0.9% for AGIs $50k-75k, 0.5% for AGIs $75k-100k, 1.7% for AGIs over 100k)
Net capital gain/loss: +$9,267 (reported on 19.6% of returns)
Here:
+$9,267
State:
+$15,829
(% of AGI for various income ranges: -2.1% for AGIs below $10k, 0.2% for AGIs $10k-25k, 0.5% for AGIs $25k-50k, 0.5% for AGIs $50k-75k, 1.2% for AGIs $75k-100k, 8.3% for AGIs over 100k)
Profit/loss from business: +$11,648 (reported on 14.1% of returns)
Here:
+$11,648
State:
+$15,557
(% of AGI for various income ranges: -7.7% for AGIs below $10k, 4.6% for AGIs $10k-25k, 5.8% for AGIs $25k-50k, 2.8% for AGIs $50k-75k, 2.2% for AGIs $75k-100k, 2.7% for AGIs over 100k)
IRA payment deduction: $3,042 (reported on 3.2% of returns)
02832:
$3,042
Rhode Island:
$3,092
(% of AGI for various income ranges: 0.5% for AGIs $25k-50k, 0.2% for AGIs $50k-75k, 0.1% for AGIs $75k-100k, 0.1% for AGIs over 100k)
Self-employed pension: $10,714 (reported on 0.6% of returns)
Here:
$10,714
Rhode Island:
$14,597
Total itemized deductions: $18,447 (22% of AGI, reported on 47.7% of returns)
Here:
$18,447
State:
$20,228
Here:
21.7% of AGI
State:
21.1% of AGI
(% of AGI for various income ranges: 12.7% for AGIs below $10k, 11.5% for AGIs $10k-25k, 14.9% for AGIs $25k-50k, 20.0% for AGIs $50k-75k, 18.2% for AGIs $75k-100k, 16.0% for AGIs over 100k)
Charity contributions deductions: $1,757 (2% of AGI, reported on 43.1% of returns)
Here:
$1,757
State:
$2,620
Here:
2.0% of AGI
State:
2.6% of AGI
(% of AGI for various income ranges: 0.6% for AGIs $10k-25k, 0.9% for AGIs $25k-50k, 1.8% for AGIs $50k-75k, 1.7% for AGIs $75k-100k, 1.5% for AGIs over 100k)
Total tax: $7,274 (reported on 81.3% of returns)
02832:
$7,274
State:
$8,437
(% of AGI for various income ranges: 2.7% for AGIs below $10k, 4.5% for AGIs $10k-25k, 7.9% for AGIs $25k-50k, 8.3% for AGIs $50k-75k, 10.1% for AGIs $75k-100k, 16.4% for AGIs over 100k)
Earned income credit: $1,589 (reported on 9.3% of returns)
Here:
$1,589
State:
$1,659
Percentage of individuals using paid preparers for their 2004 taxes: 50.2%
Here:
50%
State:
63%
(% for various income ranges: 36.2% for AGIs below $10k, 49.9% for AGIs $10k-25k, 51.7% for AGIs $25k-50k, 56.1% for AGIs $50k-75k, 54.0% for AGIs $75k-100k, 55.6% for AGIs over 100k)
Household received Food Stamps/SNAP in the past 12 months: 147 Household did not receive Food Stamps/SNAP in the past 12 months: 1,726
Women who had a birth in the past 12 months: 31 (31 now married, 0 unmarried) Women who did not have a birth in the past 12 months: 826 (362 now married, 466 unmarried)
Housing units in zip code 02832 with a mortgage: 1,006 (153 second mortgage, 159 both second mortgage and home equity loan) Houses without a mortgage: 48
Median monthly owner costs for units with a mortgage: $2,388 Median monthly owner costs for units without a mortgage: $922
Residents with income below the poverty level in 2022:
This zip code:
6.6%
Whole state:
10.8%
Residents with income below 50% of the poverty level in 2022:
This zip code:
1.5%
Whole state:
5.6%
Median number of rooms in houses and condos:
Here:
6.3
State:
6.2
Median number of rooms in apartments:
Here:
4.0
State:
4.1
Notable locations in this zip code not listed on our city pages
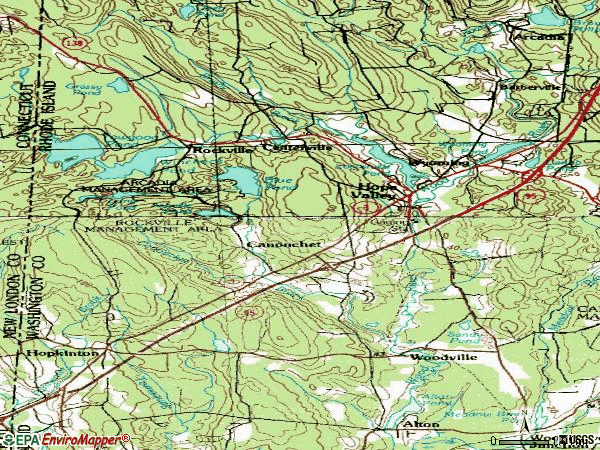
Notable locations in zip code 02832: Canochet Station (A), Lindhbrook Country Club (B), Richmond Country Club (C), Locustville Pond Public Fishing Area (D), Langworthy Public Library (E), Hope Valley Ambulance Squad (F), Hope Valley - Wyoming Fire District Station 1 (G). Display/hide their locations on the map
Churches in zip code 02832 include: Saint Josephs Chapel Roman Catholic Church (A), Rockville Seventh Day Baptist Church (B), New Hope Chapel (C). Display/hide their locations on the map
Cemeteries: Fenner Lot (1), Foster-Spencer Lot (2), Henry Maryott Lot (3), Hezekiah Collins Lot (4), Hoxie Family Lot (5), Kenyon Lot (6), Larkin Lot (7). Display/hide their locations on the map
Lakes, reservoirs, and swamps: Moscow Ponds (A), Plain Pond (B), Sandy Pond (C), Diamond Pond (D), Blue Pond (E), Locustville Pond (F), Frying Pan Pond (G), Wyoming Pond (H). Display/hide their locations on the map
Streams, rivers, and creeks: Brushy Brook (A), Moscow Brook (B), Log House Brook (C), Baker Brook (D), Roaring Brook (E), Diamond Brook (F), Canonchet Brook (G). Display/hide their locations on the map
Parks in zip code 02832 include: Enchanted Forest (1), Rockville Management and Public Fishing Area (2), Rockville State Management Area (3), Black Farm State Management Area (4). Display/hide their locations on the map
In group quarters: 20 (-1 institutionalized population)
Size of family households: 662 2-persons, 333 3-persons, 346 4-persons, 48 5-persons, 33 6-persons, 25 7-or-more-persons
Size of nonfamily households: 348 1-person, 36 2-persons
688 married couples with children.
318 single-parent households (116 men, 202 women).
96.2% of residents of 02832 zip code speak English at home.
1.2% of residents speak Spanish at home (16% very well, 84% well).
0.9% of residents speak other Indo-European language at home (100% very well).
2.9% of residents speak Asian or Pacific Island language at home (15% very well, 85% well).
Foreign born population: 154 (3.2%) (20.5% of them are naturalized citizens)
This zip code:
3.2%
Whole state:
14.4%
42%Taiwan
13%El Salvador
18%Irish
13%Italian
12%English
12%French Canadian
11%European
6%German
4%Norwegian
Year of entry for the foreign-born population
492010 or later
412000 to 2009
01990 to 1999
81Before 1990
Major facilities with environmental interests located in this zip code:
GREEN PLASTICS CORPORATION (105 CANONCHET ROAD in HOPE VALLEY, RI)
AIR MINOR (AIRS/AFS) National Pollutant Discharge Elimination System NON-MAJOR (Tracking pollutant discharge elimination systems) - permit Small Quantity Generators, between 100 kg and 1000 kg of hazardous waste/month (Resource Conservation and Recovery Act (tracking hazardous waste)) - notification Business SIC classification: PLASTICS PRODUCTS Business NAICS classification: ALL OTHER PLASTICS PRODUCT MANUFACTURING. Organizations: GREENE PLASTICS CORPORATION (CONTACT/OPERATOR)
, OWNERNAME (CONTACT/OWNER)
Alternative names: GREENE PLASTICS CORP.
COASTAL PLASTICS INC (35 MECHANIC ST. in HOPE VALLEY, RI)
National Pollutant Discharge Elimination System NON-MAJOR (Tracking pollutant discharge elimination systems) - permit National Pollutant Discharge Elimination System NON-MAJOR (Tracking pollutant discharge elimination systems) - permit National Pollutant Discharge Elimination System NON-MAJOR (Tracking pollutant discharge elimination systems) - permit TRI REPORTER (Tracking of toxic chemicals releasing facilities) Business SIC classification: PLASTICS PRODUCTS Organizations: COASTAL PLASTICS, INC. (CONTACT/OWNER)
HOPE VALLEY ELEMENTARY SCHOOL (MAIN STREET in HOPE VALLEY, RI)
(Geographic Names Information System) (National Center for Education Statistics) - STATE ID-98107 Organizations: CHARIHO REG DIST (SCHOOL DISTRICT)
MOBIL SERVICE STATION #14619 (1214 MAIN STREET in RICHMOND, RI)
National Pollutant Discharge Elimination System NON-MAJOR (Tracking pollutant discharge elimination systems) - permit Business SIC classification: GASOLINE SERVICE STATIONS Organizations: EXXON MOBIL CORPORATION (CONTACT/OWNER)
Alternative names: MOBIL BUSINESS RESOURCES CORP.
AURALUX CORP (MAIN ST in HOPKINTON, RI)
(Resource Conservation and Recovery Act (tracking hazardous waste)) Business NAICS classification: PLASTICS MATERIAL AND RESIN MANUFACTURING. Organizations: AURAIUX CORPORATION (CONTACT/OWNER)
C O O P AUTO BODY (240 SPRING ST in HOPKINTON, RI)
(Resource Conservation and Recovery Act (tracking hazardous waste))
FULLERS PRINTING SERVICE (26B WOODY HILL RD in HOPE VALLEY, RI)
(Resource Conservation and Recovery Act (tracking hazardous waste)) Organizations: ROBERT FULLER (CONTACT/OWNER)
HOPE VALLEY AUTO BODY (894 MAIN ST in HOPKINTON, RI)
Small Quantity Generators, between 100 kg and 1000 kg of hazardous waste/month (Resource Conservation and Recovery Act (tracking hazardous waste)) Organizations: JEFFREY CHALIFOUX (CONTACT/OWNER)
PERREAULT FARMS INC (321 SWITCH RD RR2 in HOPE VALLEY, RI)
ENFORCEMENT/COMPLIANCE ACTIVITY (Integrated Compliance Information System) Small Quantity Generators, between 100 kg and 1000 kg of hazardous waste/month (Resource Conservation and Recovery Act (tracking hazardous waste)) - notification Business NAICS classification: ALL OTHER MISCELLANEOUS CROP FARMING.
BERKMAN LAWRENCE E DMD INC (1111 MAIN ST in HOPKINTON, RI)
Small Quantity Generators, between 100 kg and 1000 kg of hazardous waste/month (Resource Conservation and Recovery Act (tracking hazardous waste)) - notification Organizations: DR. LAWRENCE E. BERKMAN DMD (CONTACT/OWNER)
CHARIHO AUTO SALES (1100 MAIN ST in HOPE VALLEY, RI)
Conditionally Exempt Small Quantity Generators, less than 100 kg/month of hazardous waste (Resource Conservation and Recovery Act (tracking hazardous waste)) - notification Organizations: DENNIS ALLESANDRO (CONTACT/OWNER)
EDWARDS GARAGE INC (835 MAIN ST in HOPKINTON, RI)
Small Quantity Generators, between 100 kg and 1000 kg of hazardous waste/month (Resource Conservation and Recovery Act (tracking hazardous waste)) - notification Organizations: EDWARES GARAGE INC P A EDWARDS JR (CONTACT/OWNER)
FENNER HILL GOLF COURSE (33 WHEELER LANE in HOPKINTON, RI)
Small Quantity Generators, between 100 kg and 1000 kg of hazardous waste/month (Resource Conservation and Recovery Act (tracking hazardous waste)) - notification Organizations: RONALD LEVESQUE (CONTACT/OWNER)
67.1%Fuel oil, kerosene, etc.
9.8%Wood
9.1%Electricity
8.0%Bottled, tank, or LP gas
3.5%Other fuel
2.7%Utility gas
Population in 1990: 3,466. Population change in the 1990s: +1,165 (+33.6%).
Place of birth for U.S.-born residents:
This state: 3,102
Northeast: 1,298
Midwest: 23
South: 118
West: 142
63% of the 02832 zip code residents lived in the same house 5 years ago. Out of people who lived in different houses, 53% lived in this county. Out of people who lived in different counties, 50% lived in Rhode Island.
95% of the 02832 zip code residents lived in the same house 1 year ago. Out of people who lived in different houses, 92% moved from this county. Out of people who lived in different houses, 5% moved from different county within same state.
Private vs. public school enrollment:
Students in private schools in grades 1 to 8 (elementary and middle school): 5
Here:
0.9%
Rhode Island:
12.2%
Students in private schools in grades 9 to 12 (high school):
Here:
0.6%
Rhode Island:
11.6%
Students in private undergraduate colleges: 32
Here:
18.8%
Rhode Island:
41.1%
Occupation by median earnings in the past 12 months ($)
150,914Architecture and engineering occupations
95,309Management occupations
89,485Business and financial operations occupations
75,926Education, training, and library occupations
72,178Sales and related occupations
63,383Health diagnosing and treating practitioners and other technical occupations
Companies with federal contracts located in this zip code:
LEAN ENTERPRISE TECHNOLOGIES, (35 WOOD RIVER DRIVE in HOPE VALLEY, RI; small business)
$83,057 with Navy for Other Professional Services. Signed on 2002-02-08. Completion date: 2002-03-31.
Top industries in this zip code by the number of employees in 2005:
Health Care and Social Assistance: All Other Outpatient Care Centers (50-99 employees: 1 establishment)
Arts, Entertainment, and Recreation: Golf Courses and Country Clubs (20-49: 1, 10-19: 1, 5-9: 1, 1-4: 1)
Information: Radio Stations (20-49: 1)
Health Care and Social Assistance: Residential Mental Retardation Facilities (10-19: 2)
Other Services (except Public Administration): Religious Organizations (5-9: 3, 1-4: 1)
Other Services (except Public Administration): Other Personal and Household Goods Repair and Maintenance (10-19: 1, 1-4: 1)
Health Care and Social Assistance: Ambulance Services (10-19: 1)
People in group quarters in 2010:
18 people in group homes intended for adults
People in group quarters in 2000:
10 people in homes for the mentally retarded
4 people in other noninstitutional group quarters
Fatal accident statistics in 2012:
Fatal accident count: 1
Vehicles involved in fatal accidents: 1
Fatal accidents caused by drunken drivers: 0
Fatalities: 1
Persons involved in fatal accidents: 1
Pedestrians involved in fatal accidents: 0
Fatal accident statistics in 2010:
Fatal accident count: 1
Vehicles involved in fatal accidents: 2
Fatal accidents caused by drunken drivers: 0
Fatalities: 1
Persons involved in fatal accidents: 4
Pedestrians involved in fatal accidents: 0
Home Mortgage Disclosure Act Aggregated Statistics For Year 2009 (Based on 4 partial tracts)
A) FHA, FSA/RHS & VA Home Purchase Loans
B) Conventional Home Purchase Loans
C) Refinancings
D) Home Improvement Loans
F) Non-occupant Loans on < 5 Family Dwellings (A B C & D)
G) Loans On Manufactured Home Dwelling (A B C & D)
Number
Average Value
Number
Average Value
Number
Average Value
Number
Average Value
Number
Average Value
Number
Average Value
LOANS ORIGINATED
39
$219,328
44
$204,146
356
$186,603
16
$78,472
9
$133,306
4
$59,712
APPLICATIONS APPROVED, NOT ACCEPTED
1
$126,870
0
$0
26
$234,097
3
$34,043
1
$129,870
1
$39,960
APPLICATIONS DENIED
12
$151,652
9
$160,220
133
$220,951
8
$55,295
8
$180,372
2
$113,965
APPLICATIONS WITHDRAWN
2
$217,285
2
$217,855
59
$220,640
4
$145,865
1
$105,890
1
$56,940
FILES CLOSED FOR INCOMPLETENESS
3
$218,177
1
$346,190
12
$206,540
1
$91,660
0
$0
0
$0
Aggregated Statistics For Year 2008 (Based on 4 partial tracts)
A) FHA, FSA/RHS & VA Home Purchase Loans
B) Conventional Home Purchase Loans
C) Refinancings
D) Home Improvement Loans
F) Non-occupant Loans on < 5 Family Dwellings (A B C & D)
G) Loans On Manufactured Home Dwelling (A B C & D)
Number
Average Value
Number
Average Value
Number
Average Value
Number
Average Value
Number
Average Value
Number
Average Value
LOANS ORIGINATED
20
$238,938
55
$244,769
199
$188,496
45
$46,752
10
$210,682
2
$88,515
APPLICATIONS APPROVED, NOT ACCEPTED
1
$430,570
4
$161,110
30
$200,647
8
$47,764
2
$199,085
1
$121,880
APPLICATIONS DENIED
5
$228,378
14
$202,639
112
$223,896
16
$61,256
6
$133,103
5
$135,324
APPLICATIONS WITHDRAWN
5
$232,368
9
$223,269
48
$198,195
4
$77,285
1
$359,640
2
$104,395
FILES CLOSED FOR INCOMPLETENESS
2
$291,210
1
$482,990
15
$216,488
1
$49,950
0
$0
0
$0
Aggregated Statistics For Year 2007 (Based on 4 partial tracts)
A) FHA, FSA/RHS & VA Home Purchase Loans
B) Conventional Home Purchase Loans
C) Refinancings
D) Home Improvement Loans
E) Loans on Dwellings For 5+ Families
F) Non-occupant Loans on < 5 Family Dwellings (A B C & D)
G) Loans On Manufactured Home Dwelling (A B C & D)
Number
Average Value
Number
Average Value
Number
Average Value
Number
Average Value
Number
Average Value
Number
Average Value
Number
Average Value
LOANS ORIGINATED
4
$301,738
119
$202,031
270
$180,558
92
$66,909
2
$1,218,280
26
$189,912
4
$75,902
APPLICATIONS APPROVED, NOT ACCEPTED
0
$0
13
$147,592
37
$194,065
8
$78,860
0
$0
1
$131,320
0
$0
APPLICATIONS DENIED
1
$352,420
16
$256,688
174
$227,829
42
$90,906
0
$0
4
$210,912
5
$126,038
APPLICATIONS WITHDRAWN
0
$0
12
$214,898
101
$210,593
13
$79,689
0
$0
2
$221,765
1
$63,940
FILES CLOSED FOR INCOMPLETENESS
0
$0
3
$211,317
19
$240,309
2
$37,940
0
$0
2
$159,840
0
$0
Aggregated Statistics For Year 2006 (Based on 4 partial tracts)
A) FHA, FSA/RHS & VA Home Purchase Loans
B) Conventional Home Purchase Loans
C) Refinancings
D) Home Improvement Loans
F) Non-occupant Loans on < 5 Family Dwellings (A B C & D)
G) Loans On Manufactured Home Dwelling (A B C & D)
Number
Average Value
Number
Average Value
Number
Average Value
Number
Average Value
Number
Average Value
Number
Average Value
LOANS ORIGINATED
4
$261,065
176
$187,099
354
$177,414
132
$57,698
19
$148,760
7
$57,840
APPLICATIONS APPROVED, NOT ACCEPTED
0
$0
27
$221,144
70
$188,042
10
$57,390
2
$162,480
0
$0
APPLICATIONS DENIED
1
$271,730
45
$156,431
165
$190,344
42
$67,612
7
$96,226
7
$56,881
APPLICATIONS WITHDRAWN
0
$0
18
$171,010
147
$189,700
6
$91,602
1
$249,750
2
$40,460
FILES CLOSED FOR INCOMPLETENESS
0
$0
1
$290,710
36
$242,851
3
$139,267
1
$265,730
0
$0
Aggregated Statistics For Year 2005 (Based on 4 partial tracts)
A) FHA, FSA/RHS & VA Home Purchase Loans
B) Conventional Home Purchase Loans
C) Refinancings
D) Home Improvement Loans
F) Non-occupant Loans on < 5 Family Dwellings (A B C & D)
G) Loans On Manufactured Home Dwelling (A B C & D)
Number
Average Value
Number
Average Value
Number
Average Value
Number
Average Value
Number
Average Value
Number
Average Value
LOANS ORIGINATED
5
$237,664
216
$203,390
440
$176,407
91
$72,859
21
$209,000
4
$63,198
APPLICATIONS APPROVED, NOT ACCEPTED
0
$0
11
$216,276
69
$175,914
9
$72,351
2
$197,160
0
$0
APPLICATIONS DENIED
1
$170,350
53
$170,278
164
$193,431
35
$67,981
4
$210,388
0
$0
APPLICATIONS WITHDRAWN
1
$284,720
30
$175,261
238
$199,803
23
$146,404
10
$180,352
3
$78,257
FILES CLOSED FOR INCOMPLETENESS
0
$0
9
$218,480
52
$236,780
3
$58,007
0
$0
0
$0
Aggregated Statistics For Year 2004 (Based on 4 partial tracts)
A) FHA, FSA/RHS & VA Home Purchase Loans
B) Conventional Home Purchase Loans
C) Refinancings
D) Home Improvement Loans
F) Non-occupant Loans on < 5 Family Dwellings (A B C & D)
G) Loans On Manufactured Home Dwelling (A B C & D)
Number
Average Value
Number
Average Value
Number
Average Value
Number
Average Value
Number
Average Value
Number
Average Value
LOANS ORIGINATED
8
$222,622
214
$187,258
508
$164,436
96
$73,531
30
$159,767
6
$58,150
APPLICATIONS APPROVED, NOT ACCEPTED
0
$0
24
$171,106
52
$163,555
14
$57,646
5
$139,206
1
$77,560
APPLICATIONS DENIED
3
$202,797
38
$160,145
165
$171,808
42
$80,953
6
$108,383
1
$155,610
APPLICATIONS WITHDRAWN
0
$0
34
$167,775
219
$172,695
11
$68,114
5
$135,962
2
$140,360
FILES CLOSED FOR INCOMPLETENESS
0
$0
8
$203,626
63
$200,303
3
$39,930
1
$238,270
0
$0
Aggregated Statistics For Year 2003 (Based on 4 partial tracts)
A) FHA, FSA/RHS & VA Home Purchase Loans
B) Conventional Home Purchase Loans
C) Refinancings
D) Home Improvement Loans
F) Non-occupant Loans on < 5 Family Dwellings (A B C & D)
Number
Average Value
Number
Average Value
Number
Average Value
Number
Average Value
Number
Average Value
LOANS ORIGINATED
11
$199,165
163
$181,456
917
$138,680
81
$77,604
32
$133,132
APPLICATIONS APPROVED, NOT ACCEPTED
2
$197,305
21
$190,464
110
$131,440
15
$51,904
7
$133,010
APPLICATIONS DENIED
3
$157,953
30
$178,201
252
$143,548
26
$41,164
4
$119,310
APPLICATIONS WITHDRAWN
1
$328,370
19
$141,056
252
$146,942
7
$25,910
5
$159,672
FILES CLOSED FOR INCOMPLETENESS
0
$0
3
$214,783
16
$165,096
5
$66,578
2
$81,420
Aggregated Statistics For Year 2002 (Based on 4 partial tracts)
A) FHA, FSA/RHS & VA Home Purchase Loans
B) Conventional Home Purchase Loans
C) Refinancings
D) Home Improvement Loans
F) Non-occupant Loans on < 5 Family Dwellings (A B C & D)
Number
Average Value
Number
Average Value
Number
Average Value
Number
Average Value
Number
Average Value
LOANS ORIGINATED
15
$162,359
171
$160,194
548
$126,530
57
$43,015
26
$109,551
APPLICATIONS APPROVED, NOT ACCEPTED
2
$174,110
17
$142,586
82
$109,942
15
$37,661
1
$176,930
APPLICATIONS DENIED
1
$86,090
19
$151,249
121
$115,613
25
$31,279
4
$67,472
APPLICATIONS WITHDRAWN
2
$165,420
14
$125,994
116
$122,608
15
$26,977
5
$110,562
FILES CLOSED FOR INCOMPLETENESS
0
$0
0
$0
26
$132,773
0
$0
0
$0
Aggregated Statistics For Year 2001 (Based on 4 partial tracts)
A) FHA, FSA/RHS & VA Home Purchase Loans
B) Conventional Home Purchase Loans
C) Refinancings
D) Home Improvement Loans
F) Non-occupant Loans on < 5 Family Dwellings (A B C & D)
Number
Average Value
Number
Average Value
Number
Average Value
Number
Average Value
Number
Average Value
LOANS ORIGINATED
20
$143,286
148
$132,647
421
$115,803
61
$29,468
19
$98,594
APPLICATIONS APPROVED, NOT ACCEPTED
1
$197,880
19
$114,421
48
$97,670
14
$27,326
3
$99,117
APPLICATIONS DENIED
0
$0
17
$101,893
150
$90,672
36
$32,673
4
$53,450
APPLICATIONS WITHDRAWN
3
$123,543
12
$108,733
98
$114,475
19
$24,389
2
$85,640
FILES CLOSED FOR INCOMPLETENESS
1
$122,880
0
$0
11
$85,395
1
$9,990
0
$0
Aggregated Statistics For Year 2000 (Based on 4 partial tracts)
A) FHA, FSA/RHS & VA Home Purchase Loans
B) Conventional Home Purchase Loans
C) Refinancings
D) Home Improvement Loans
E) Loans on Dwellings For 5+ Families
F) Non-occupant Loans on < 5 Family Dwellings (A B C & D)
Number
Average Value
Number
Average Value
Number
Average Value
Number
Average Value
Number
Average Value
Number
Average Value
LOANS ORIGINATED
24
$128,050
127
$129,523
102
$88,223
75
$29,992
0
$0
13
$78,668
APPLICATIONS APPROVED, NOT ACCEPTED
1
$91,390
12
$128,622
25
$77,409
13
$25,662
0
$0
5
$87,312
APPLICATIONS DENIED
1
$109,890
26
$115,713
104
$65,043
43
$29,805
0
$0
7
$110,213
APPLICATIONS WITHDRAWN
7
$104,626
11
$136,635
74
$85,848
9
$25,422
1
$34,970
3
$114,350
FILES CLOSED FOR INCOMPLETENESS
0
$0
5
$128,272
8
$102,561
0
$0
0
$0
0
$0
Aggregated Statistics For Year 1999 (Based on 2 partial tracts)
A) FHA, FSA/RHS & VA Home Purchase Loans
B) Conventional Home Purchase Loans
C) Refinancings
D) Home Improvement Loans
E) Loans on Dwellings For 5+ Families
F) Non-occupant Loans on < 5 Family Dwellings (A B C & D)


 Nearest zip codes: 02833, 02873, 02898, 02894, 02812, 02804.