Estimated zip code population in 2022: 1,113 Zip code population in 2010: 1,023 Zip code population in 2000: 881
Houses and condos: 388 Renter-occupied apartments: 167
% of renters here:
48%
State:
46%
March 2022 cost of living index in zip code 10931: 136.7 (high, U.S. average is 100)
Land area: 6.4 sq. mi. Water area: 0.0 sq. mi.
Population density: 174 people per square mile
(very low).
OSM Map
General Map
Google Map
MSN Map
OSM Map
General Map
Google Map
MSN Map
OSM Map
General Map
Google Map
MSN Map
OSM Map
General Map
Google Map
MSN Map
Please wait while loading the map...
Real estate property taxes paid for housing units in 2022:
This zip code:
2.2% ($9,805)
New York:
1.5% ($6,180)
Median real estate property taxes paid for housing units with mortgages in 2022: $9,858 (1.9%) Median real estate property taxes paid for housing units with no mortgage in 2022: $8,756 (2.1%)
Estimated median house/condo value in 2022: $454,294
10931:
$454,294
New York:
$400,400
Median resident age:
This zip code:
33.2 years
New York median age:
40.0 years
Average household size:
This zip code:
3.1 people
New York:
2.5 people
Averages for the 2012 tax year for zip code 10931, filed in 2013:
Average Adjusted Gross Income (AGI) in 2012: $52,154 (Individual Income Tax Returns)
Here:
$52,154
State:
$77,088
Salary/wage: $48,265 (reported on 89.6% of returns)
Here:
$48,265
State:
$60,593
(% of AGI for various income ranges: 81.5% for AGIs below $25k, 88.4% for AGIs $25k-50k, 75.5% for AGIs $50k-75k, 80.1% for AGIs $75k-100k, 85.6% for AGIs $100k-200k)
Taxable interest for individuals: $254 (reported on 27.1% of returns)
This zip code:
$254
New York:
$3,125
(% of AGI for various income ranges: 0.3% for AGIs below $25k, 0.3% for AGIs $75k-100k, 0.1% for AGIs $100k-200k)
Ordinary dividends: $520 (reported on 10.4% of returns)
Here:
$520
State:
$10,299
Profit/loss from business: +$3,175 (reported on 8.3% of returns)
Here:
+$3,175
State:
+$16,168
Taxable individual retirement arrangement distribution: $11,350 (reported on 4.2% of returns)
10931:
$11,350
New York:
$17,621
Total itemized deductions: $24,056 (27% of AGI, reported on 33.3% of returns)
Here:
$24,056
State:
$34,985
Here:
27.3% of AGI
State:
21.3% of AGI
(% of AGI for various income ranges: 23.0% for AGIs below $25k, 14.6% for AGIs $50k-75k, 17.5% for AGIs $75k-100k, 21.0% for AGIs $100k-200k)
Charity contributions: $3,533 (reported on 25.0% of returns)
Here:
$3,533
State:
$5,572
(% of AGI for various income ranges: 2.8% for AGIs below $25k, 1.0% for AGIs $50k-75k, 2.6% for AGIs $75k-100k, 2.1% for AGIs $100k-200k)
Taxes paid: $11,144 (reported on 33.3% of returns)
10931:
$11,144
State:
$18,656
(% of AGI for various income ranges: 8.1% for AGIs below $25k, 6.8% for AGIs $50k-75k, 8.0% for AGIs $75k-100k, 10.4% for AGIs $100k-200k)
Earned income credit: $2,233 (reported on 12.5% of returns)
Here:
$2,233
State:
$2,230
(% of AGI for various income ranges: 6.8% for AGIs below $25k)
Percentage of individuals using paid preparers for their 2012 taxes: 60.4%
Here:
60%
State:
66%
(% for various income ranges: 56.2% for AGIs below $25k, 53.8% for AGIs $25k-50k, 57.1% for AGIs $50k-75k, 66.7% for AGIs $75k-100k, 83.3% for AGIs $100k-200k)
Averages for the 2004 tax year for zip code 10931, filed in 2005:
Average Adjusted Gross Income (AGI) in 2004: $42,285 (Individual Income Tax Returns)
Here:
$42,285
State:
$59,519
Salary/wage: $41,104 (reported on 88.2% of returns)
Here:
$41,104
State:
$50,673
(% of AGI for various income ranges: 82.6% for AGIs below $10k, 79.0% for AGIs $10k-25k, 86.3% for AGIs $25k-50k, 87.6% for AGIs $50k-75k, 87.0% for AGIs $75k-100k, 85.1% for AGIs over 100k)
Taxable interest for individuals: $293 (reported on 40.4% of returns)
This zip code:
$293
New York:
$2,377
(% of AGI for various income ranges: 0.8% for AGIs $10k-25k, 0.4% for AGIs $25k-50k, 0.2% for AGIs $50k-75k, 0.1% for AGIs $75k-100k, 0.2% for AGIs over 100k)
Taxable dividends: $425 (reported on 17.5% of returns)
Here:
$425
State:
$5,394
(% of AGI for various income ranges: 0.4% for AGIs $10k-25k, 0.2% for AGIs $25k-50k, 0.1% for AGIs $50k-75k, 0.1% for AGIs $75k-100k, 0.2% for AGIs over 100k)
Net capital gain/loss: +$778 (reported on 7.9% of returns)
Here:
+$778
State:
+$23,581
Profit/loss from business: +$3,368 (reported on 8.3% of returns)
Here:
+$3,368
State:
+$13,809
(% of AGI for various income ranges: 11.6% for AGIs below $10k, 5.1% for AGIs $10k-25k, -0.1% for AGIs $50k-75k)
Total itemized deductions: $20,068 (27% of AGI, reported on 32.0% of returns)
Here:
$20,068
State:
$25,864
Here:
27.0% of AGI
State:
21.9% of AGI
(% of AGI for various income ranges: 13.9% for AGIs $25k-50k, 16.3% for AGIs $50k-75k, 18.4% for AGIs $75k-100k, 20.5% for AGIs over 100k)
Charity contributions deductions: $2,609 (3% of AGI, reported on 29.2% of returns)
Here:
$2,609
State:
$4,439
Here:
3.5% of AGI
State:
3.6% of AGI
(% of AGI for various income ranges: 1.6% for AGIs $25k-50k, 2.1% for AGIs $50k-75k, 2.3% for AGIs $75k-100k, 2.3% for AGIs over 100k)
Total tax: $5,152 (reported on 74.8% of returns)
10931:
$5,152
State:
$11,730
(% of AGI for various income ranges: 2.2% for AGIs below $10k, 4.0% for AGIs $10k-25k, 7.7% for AGIs $25k-50k, 8.6% for AGIs $50k-75k, 10.0% for AGIs $75k-100k, 13.3% for AGIs over 100k)
Earned income credit: $1,625 (reported on 14.0% of returns)
Here:
$1,625
State:
$1,757
Percentage of individuals using paid preparers for their 2004 taxes: 71.7%
Here:
72%
State:
67%
(% for various income ranges: 71.2% for AGIs below $10k, 71.2% for AGIs $10k-25k, 73.2% for AGIs $25k-50k, 69.6% for AGIs $50k-75k, 82.9% for AGIs $75k-100k, 58.1% for AGIs over 100k)
Household received Food Stamps/SNAP in the past 12 months: 55 Household did not receive Food Stamps/SNAP in the past 12 months: 294
Women who had a birth in the past 12 months: 5 (5 now married, 0 unmarried) Women who did not have a birth in the past 12 months: 213 (105 now married, 106 unmarried)
Housing units in zip code 10931 with a mortgage: 95 (20 second mortgage, 20 both second mortgage and home equity loan) Median monthly owner costs for units with a mortgage: $2,718 Median monthly owner costs for units without a mortgage: $1,267
Residents with income below the poverty level in 2022:
This zip code:
12.6%
Whole state:
14.3%
Residents with income below 50% of the poverty level in 2022:
This zip code:
8.0%
Whole state:
6.8%
Median number of rooms in houses and condos:
Here:
6.4
State:
6.3
Median number of rooms in apartments:
Here:
4.6
State:
3.8
Notable locations in this zip code not listed on our city pages
In group quarters: 9 (-1 institutionalized population)
Size of family households: 46 2-persons, 75 3-persons, 65 4-persons, 17 5-persons, 19 6-persons, 19 7-or-more-persons
Size of nonfamily households: 71 1-person, 23 2-persons, 8 4-persons
167 married couples with children.
138 single-parent households (17 men, 121 women).
60.2% of residents of 10931 zip code speak English at home.
26.3% of residents speak Spanish at home (53% very well, 31% well, 16% not well).
10.9% of residents speak other Indo-European language at home (67% very well, 27% well, 1% not well, 5% not at all).
0.6% of residents speak Asian or Pacific Island language at home (100% very well).
0.7% of residents speak other language at home (100% very well).
Foreign born population: 234 (21.1%) (63.2% of them are naturalized citizens)
This zip code:
21.1%
Whole state:
22.7%
17%El Salvador
17%Honduras
15%Grenada
12%Nepal
12%North Macedonia (Macedonia)
9%Colombia
5%Jordan
12%American
10%Polish
4%Irish
4%Italian
3%European
1%Russian
1%Canadian
Year of entry for the foreign-born population
292010 or later
892000 to 2009
731990 to 1999
58Before 1990
Facilities with environmental interests located in this zip code:
HILLBURN GAS TURBINE FACILITY (4TH ST in HILLBURN, NY)
AIR MAJOR (AIRS/AFS) AIR PROGRAM (Clean Air Markets Division Business System) STATE MASTER (New York facility tracking) - AIR MAJOR CRITERIA AND HAZARDOUS AIR POLLUTANT INVENTORY (Inventory of air pollution sources) Business SIC classification: ELECTRIC SERVICES Business NAICS classification: FOSSIL FUEL ELECTRIC POWER GENERATION. Organizations: SOUTHERN ENERGY NEW YORK (LEGALLY RESPONSIBLE PARTY)
, ORANGE & ROCKLAND UTILITIES INC (LEGALLY RESPONSIBLE PARTY)
, MIRANT NY-GEN LLC (LEGALLY RESPONSIBLE PARTY)
, MIRANT NY-GEN, LLC (OWNER/OPERATOR)
Alternative names: ORANGE & ROCKLND UTILS
HUDSON TECHNOLOGIES INCORPORATED (25 TONE VALLEY ROAD in HILLBURN, NY)
SUPERFUND NPL (Superfund database) COMPLIANCE ACTIVITY (Tracking inspections of insecticide, fungicide, and rodenticide, and toxic substances) Conditionally Exempt Small Quantity Generators, less than 100 kg/month of hazardous waste (Resource Conservation and Recovery Act (tracking hazardous waste)) - notification TRI REPORTER (Tracking of toxic chemicals releasing facilities) Business SIC classification: INDUSTRIAL ORGANIC CHEMICALS Organizations: RAMAPO LAND CO INC (CONTACT/OWNER)
HILLBURN SUBSTATION - O & R (FOURTH ST in HILLBURN, NY)
HAZARDOUS WASTE BIENNIAL REPORTER (Resource Conservation and Recovery Act (tracking hazardous waste)) (Resource Conservation and Recovery Act (tracking hazardous waste))
HUBBARD MILLING CO (RTE 59 & 4TH ST in HILLBURN, NY)
(Resource Conservation and Recovery Act (tracking hazardous waste))
CON EDISON - RAMAPO SUBSTATION (RTE 59 & TORN VALLEY RD in RAMAPO, NY)
Small Quantity Generators, between 100 kg and 1000 kg of hazardous waste/month (Resource Conservation and Recovery Act (tracking hazardous waste))
CHESTNUT RIDGE TRANSPORT (401 ROUTE 17 in HILLBURN, NY)
ENFORCEMENT/COMPLIANCE ACTIVITY (Integrated Compliance Information System) Business SIC classification: SCHOOL BUSES
Housing units lacking complete plumbing facilities: 1.4% Housing units lacking complete kitchen facilities: 3.6%
92.9%Utility gas
2.9%Fuel oil, kerosene, etc.
2.6%Bottled, tank, or LP gas
1.8%Electricity
Population in 1990: 892.
Place of birth for U.S.-born residents:
This state: 736
Northeast: 52
Midwest: 24
South: 26
West: 14
60% of the 10931 zip code residents lived in the same house 5 years ago. Out of people who lived in different houses, 86% lived in this county. Out of people who lived in different counties, 50% lived in New York.
95% of the 10931 zip code residents lived in the same house 1 year ago. Out of people who lived in different houses, 26% moved from this county. Out of people who lived in different houses, 52% moved from different county within same state. Out of people who lived in different houses, 19% moved from different state.
Private vs. public school enrollment:
Students in private schools in grades 1 to 8 (elementary and middle school):
Here:
0.0%
New York:
15.6%
Students in private schools in grades 9 to 12 (high school): 3
Here:
4.7%
New York:
15.0%
Students in private undergraduate colleges: 7
Here:
51.6%
New York:
39.2%
Occupation by median earnings in the past 12 months ($)
101,572Arts, design, entertainment, sports, and media occupations
99,695Education, training, and library occupations
96,947Law enforcement workers including supervisors
77,424Building and grounds cleaning and maintenance occupations
74,667Installation, maintenance, and repair occupations
69,450Business and financial operations occupations
Top industries in this zip code by the number of employees in 2005:
Accommodation and Food Services: Full-Service Restaurants (50-99 employees: 1 establishment)
Accommodation and Food Services: Food Service Contractors (20-49: 1)
Wholesale Trade: Home Furnishing Merchant Wholesalers (20-49: 1)
Wholesale Trade: Recyclable Material Merchant Wholesalers (20-49: 1)
Construction: Plumbing, Heating, and Air-Conditioning Contractors (20-49: 1)
Administrative and Support and Waste Management and Remediation Services: Landscaping Services (5-9: 1, 1-4: 1)
Home Mortgage Disclosure Act Aggregated Statistics For Year 2009 (Based on 2 full tracts)
A) FHA, FSA/RHS & VA Home Purchase Loans
B) Conventional Home Purchase Loans
C) Refinancings
D) Home Improvement Loans
F) Non-occupant Loans on < 5 Family Dwellings (A B C & D)
Number
Average Value
Number
Average Value
Number
Average Value
Number
Average Value
Number
Average Value
LOANS ORIGINATED
8
$250,181
8
$182,739
20
$193,004
0
$0
0
$0
APPLICATIONS APPROVED, NOT ACCEPTED
0
$0
2
$174,555
0
$0
0
$0
0
$0
APPLICATIONS DENIED
2
$225,140
6
$237,702
2
$194,395
4
$133,892
2
$247,950
APPLICATIONS WITHDRAWN
0
$0
0
$0
4
$137,860
0
$0
0
$0
FILES CLOSED FOR INCOMPLETENESS
0
$0
0
$0
0
$0
0
$0
0
$0
Aggregated Statistics For Year 2008 (Based on 2 full tracts)
A) FHA, FSA/RHS & VA Home Purchase Loans
B) Conventional Home Purchase Loans
C) Refinancings
D) Home Improvement Loans
F) Non-occupant Loans on < 5 Family Dwellings (A B C & D)
Number
Average Value
Number
Average Value
Number
Average Value
Number
Average Value
Number
Average Value
LOANS ORIGINATED
0
$0
4
$301,012
18
$183,703
0
$0
2
$233,075
APPLICATIONS APPROVED, NOT ACCEPTED
0
$0
2
$151,745
2
$56,535
0
$0
2
$151,745
APPLICATIONS DENIED
0
$0
4
$163,648
14
$153,446
4
$173,070
0
$0
APPLICATIONS WITHDRAWN
0
$0
0
$0
6
$181,500
0
$0
0
$0
FILES CLOSED FOR INCOMPLETENESS
2
$272,745
0
$0
4
$201,335
2
$34,715
0
$0
Aggregated Statistics For Year 2007 (Based on 2 full tracts)
B) Conventional Home Purchase Loans
C) Refinancings
D) Home Improvement Loans
F) Non-occupant Loans on < 5 Family Dwellings (A B C & D)
Number
Average Value
Number
Average Value
Number
Average Value
Number
Average Value
LOANS ORIGINATED
12
$241,834
36
$246,738
6
$26,778
0
$0
APPLICATIONS APPROVED, NOT ACCEPTED
4
$205,798
6
$84,965
0
$0
0
$0
APPLICATIONS DENIED
6
$298,862
8
$170,094
14
$141,544
2
$162,655
APPLICATIONS WITHDRAWN
0
$0
12
$185,962
0
$0
0
$0
FILES CLOSED FOR INCOMPLETENESS
2
$284,645
0
$0
0
$0
0
$0
Aggregated Statistics For Year 2006 (Based on 2 full tracts)
B) Conventional Home Purchase Loans
C) Refinancings
D) Home Improvement Loans
E) Loans on Dwellings For 5+ Families
F) Non-occupant Loans on < 5 Family Dwellings (A B C & D)
G) Loans On Manufactured Home Dwelling (A B C & D)
Number
Average Value
Number
Average Value
Number
Average Value
Number
Average Value
Number
Average Value
Number
Average Value
LOANS ORIGINATED
20
$234,263
38
$225,817
6
$54,548
2
$1,507,535
6
$298,532
0
$0
APPLICATIONS APPROVED, NOT ACCEPTED
8
$216,212
4
$192,410
2
$32,730
0
$0
0
$0
0
$0
APPLICATIONS DENIED
14
$253,192
18
$282,773
16
$33,721
0
$0
2
$396,720
2
$79,345
APPLICATIONS WITHDRAWN
6
$380,520
18
$243,983
2
$242,990
0
$0
2
$198,360
0
$0
FILES CLOSED FOR INCOMPLETENESS
2
$266,795
4
$462,675
0
$0
0
$0
0
$0
0
$0
Aggregated Statistics For Year 2005 (Based on 2 full tracts)
B) Conventional Home Purchase Loans
C) Refinancings
D) Home Improvement Loans
E) Loans on Dwellings For 5+ Families
F) Non-occupant Loans on < 5 Family Dwellings (A B C & D)
Number
Average Value
Number
Average Value
Number
Average Value
Number
Average Value
Number
Average Value
LOANS ORIGINATED
22
$204,311
38
$200,448
12
$70,418
2
$945,185
14
$179,941
APPLICATIONS APPROVED, NOT ACCEPTED
0
$0
4
$222,162
2
$198,360
0
$0
2
$277,705
APPLICATIONS DENIED
12
$250,099
12
$218,692
10
$35,110
2
$1,140,570
0
$0
APPLICATIONS WITHDRAWN
2
$345,145
26
$257,639
2
$247,950
0
$0
2
$345,145
FILES CLOSED FOR INCOMPLETENESS
2
$489,950
4
$368,452
0
$0
0
$0
0
$0
Aggregated Statistics For Year 2004 (Based on 2 full tracts)
B) Conventional Home Purchase Loans
C) Refinancings
D) Home Improvement Loans
E) Loans on Dwellings For 5+ Families
F) Non-occupant Loans on < 5 Family Dwellings (A B C & D)
Number
Average Value
Number
Average Value
Number
Average Value
Number
Average Value
Number
Average Value
LOANS ORIGINATED
30
$212,510
48
$168,606
4
$69,425
0
$0
14
$221,880
APPLICATIONS APPROVED, NOT ACCEPTED
14
$217,063
6
$142,820
8
$109,841
0
$0
2
$226,130
APPLICATIONS DENIED
18
$242,881
22
$197,188
6
$130,587
0
$0
10
$198,558
APPLICATIONS WITHDRAWN
4
$210,758
26
$196,224
4
$104,140
2
$771,620
0
$0
FILES CLOSED FOR INCOMPLETENESS
0
$0
6
$256,215
2
$24,795
0
$0
0
$0
Aggregated Statistics For Year 2003 (Based on 2 full tracts)
A) FHA, FSA/RHS & VA Home Purchase Loans
B) Conventional Home Purchase Loans
C) Refinancings
D) Home Improvement Loans
F) Non-occupant Loans on < 5 Family Dwellings (A B C & D)
Number
Average Value
Number
Average Value
Number
Average Value
Number
Average Value
Number
Average Value
LOANS ORIGINATED
6
$219,518
16
$232,329
89
$177,677
10
$24,597
12
$170,093
APPLICATIONS APPROVED, NOT ACCEPTED
0
$0
4
$198,855
6
$189,765
0
$0
0
$0
APPLICATIONS DENIED
0
$0
2
$86,285
26
$172,039
2
$10,910
2
$175,550
APPLICATIONS WITHDRAWN
0
$0
2
$205,305
34
$166,797
2
$39,670
4
$89,758
FILES CLOSED FOR INCOMPLETENESS
0
$0
0
$0
4
$107,610
0
$0
0
$0
Aggregated Statistics For Year 2002 (Based on 2 full tracts)
A) FHA, FSA/RHS & VA Home Purchase Loans
B) Conventional Home Purchase Loans
C) Refinancings
D) Home Improvement Loans
F) Non-occupant Loans on < 5 Family Dwellings (A B C & D)
Number
Average Value
Number
Average Value
Number
Average Value
Number
Average Value
Number
Average Value
LOANS ORIGINATED
2
$278,695
14
$161,946
30
$153,927
12
$75,708
8
$142,075
APPLICATIONS APPROVED, NOT ACCEPTED
0
$0
0
$0
10
$110,090
4
$23,308
0
$0
APPLICATIONS DENIED
2
$138,850
6
$143,812
18
$131,909
4
$6,448
6
$121,992
APPLICATIONS WITHDRAWN
0
$0
2
$268,780
20
$140,736
8
$43,391
0
$0
FILES CLOSED FOR INCOMPLETENESS
0
$0
0
$0
4
$146,788
0
$0
0
$0
Aggregated Statistics For Year 2001 (Based on 2 full tracts)
A) FHA, FSA/RHS & VA Home Purchase Loans
B) Conventional Home Purchase Loans
C) Refinancings
D) Home Improvement Loans
F) Non-occupant Loans on < 5 Family Dwellings (A B C & D)
Number
Average Value
Number
Average Value
Number
Average Value
Number
Average Value
Number
Average Value
LOANS ORIGINATED
2
$201,335
20
$171,780
28
$138,002
8
$39,672
0
$0
APPLICATIONS APPROVED, NOT ACCEPTED
0
$0
2
$392,755
12
$145,795
0
$0
0
$0
APPLICATIONS DENIED
0
$0
6
$236,048
28
$107,539
6
$40,995
2
$142,820
APPLICATIONS WITHDRAWN
0
$0
0
$0
22
$77,450
0
$0
0
$0
FILES CLOSED FOR INCOMPLETENESS
0
$0
0
$0
2
$155,715
0
$0
0
$0
Aggregated Statistics For Year 2000 (Based on 2 full tracts)
A) FHA, FSA/RHS & VA Home Purchase Loans
B) Conventional Home Purchase Loans
C) Refinancings
D) Home Improvement Loans
E) Loans on Dwellings For 5+ Families
F) Non-occupant Loans on < 5 Family Dwellings (A B C & D)
Number
Average Value
Number
Average Value
Number
Average Value
Number
Average Value
Number
Average Value
Number
Average Value
LOANS ORIGINATED
4
$175,052
16
$157,076
14
$92,096
10
$13,885
0
$0
2
$109,100
APPLICATIONS APPROVED, NOT ACCEPTED
0
$0
0
$0
2
$80,335
0
$0
0
$0
2
$80,335
APPLICATIONS DENIED
0
$0
6
$30,415
14
$107,964
8
$16,116
2
$148,770
0
$0
APPLICATIONS WITHDRAWN
2
$109,100
0
$0
22
$132,180
0
$0
0
$0
0
$0
FILES CLOSED FOR INCOMPLETENESS
0
$0
0
$0
8
$107,859
0
$0
0
$0
0
$0
Aggregated Statistics For Year 1999 (Based on 1 full tract)
A) FHA, FSA/RHS & VA Home Purchase Loans
B) Conventional Home Purchase Loans
C) Refinancings
D) Home Improvement Loans
E) Loans on Dwellings For 5+ Families
F) Non-occupant Loans on < 5 Family Dwellings (A B C & D)
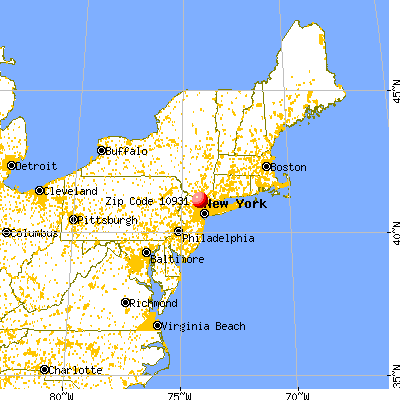


 Nearest zip codes: 10974, 07495, 10901, 07430, 10970, 10987.