Estimated zip code population in 2022: 3,961 Zip code population in 2010: 4,047 Zip code population in 2000: 4,100
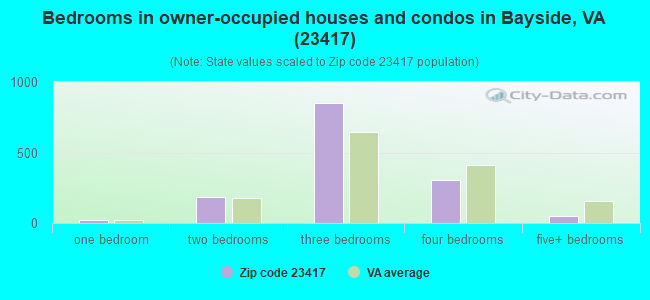
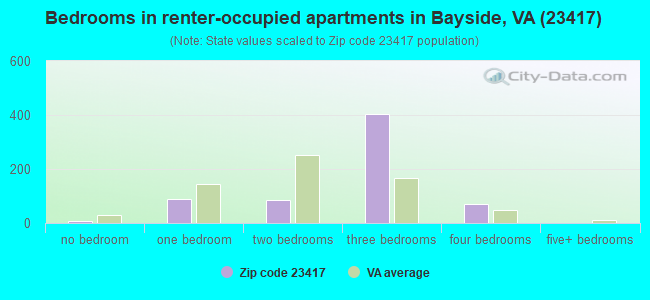
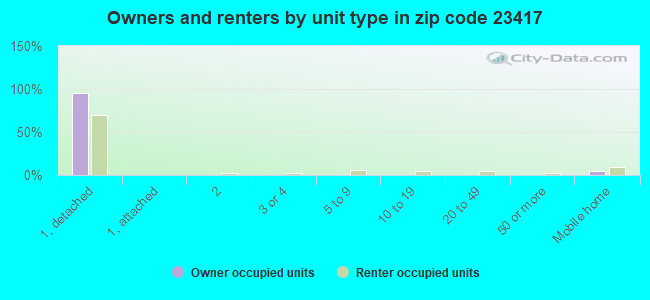
Houses and condos: 2,595 Renter-occupied apartments: 656
% of renters here:
32%
State:
33%
March 2022 cost of living index in zip code 23417: 85.2 (less than average, U.S. average is 100)
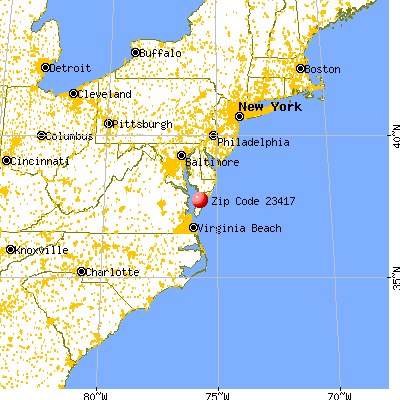
Land area: 49.3 sq. mi. Water area: 39.6 sq. mi.
Population density: 80 people per square mile
(very low).
OSM Map
General Map
Google Map
MSN Map
OSM Map
General Map
Google Map
MSN Map
OSM Map
General Map
Google Map
MSN Map
OSM Map
General Map
Google Map
MSN Map
Please wait while loading the map...
Real estate property taxes paid for housing units in 2022:
This zip code:
0.5% ($1,301)
Virginia:
0.7% ($2,617)
Median real estate property taxes paid for housing units with mortgages in 2022: $1,326 (0.5%) Median real estate property taxes paid for housing units with no mortgage in 2022: $1,316 (0.5%)
Averages for the 2020 tax year for zip code 23417, filed in 2021:
Average Adjusted Gross Income (AGI) in 2020: $65,789 (Individual Income Tax Returns)
Here:
$65,789
State:
$86,446
Salary/wage: $47,602 (reported on 73.9% of returns)
Here:
$47,602
State:
$71,185
(% of AGI for various income ranges: 1217.7% for AGIs below $25k, 3458.8% for AGIs $25k-50k, 5692.7% for AGIs $50k-75k, 7606.7% for AGIs $75k-100k, 13340.8% for AGIs $100k-200k, 68580.0% for AGIs over 200k)
Taxable interest for individuals: $2,347 (reported on 34.1% of returns)
This zip code:
$2,347
Virginia:
$1,805
(% of AGI for various income ranges: 16.1% for AGIs below $25k, 30.3% for AGIs $25k-50k, 75.3% for AGIs $50k-75k, 271.1% for AGIs $75k-100k, 469.2% for AGIs $100k-200k, 1585.0% for AGIs over 200k)
Ordinary dividends: $11,053 (reported on 25.6% of returns)
Here:
$11,053
State:
$8,327
(% of AGI for various income ranges: 41.4% for AGIs below $25k, 70.3% for AGIs $25k-50k, 324.0% for AGIs $50k-75k, 410.0% for AGIs $75k-100k, 1563.3% for AGIs $100k-200k, 9145.0% for AGIs over 200k)
Net capital gain/loss in AGI: +$11,738 (reported on 22.7% of returns)
Here:
+$11,738
State:
+$24,644
(% of AGI for various income ranges: 6.4% for AGIs below $25k, 62.1% for AGIs $25k-50k, 149.3% for AGIs $50k-75k, 240.0% for AGIs $75k-100k, 1676.7% for AGIs $100k-200k, 10050.0% for AGIs over 200k)
Profit/loss from business: +$11,255 (reported on 18.8% of returns)
Here:
+$11,255
State:
+$12,836
(% of AGI for various income ranges: 55.9% for AGIs below $25k, 90.3% for AGIs $25k-50k, 283.3% for AGIs $50k-75k, 408.9% for AGIs $75k-100k, 570.0% for AGIs $100k-200k, 8465.0% for AGIs over 200k)
Taxable individual retirement arrangement distribution: $19,688 (reported on 14.2% of returns)
23417:
$19,688
Virginia:
$21,535
(% of AGI for various income ranges: 47.5% for AGIs below $25k, 164.5% for AGIs $25k-50k, 403.3% for AGIs $50k-75k, 781.1% for AGIs $75k-100k, 2385.0% for AGIs $100k-200k)
Total itemized deductions: $31,953 (reported on 9.7% of returns)
Here:
$31,953
State:
$33,287
(% of AGI for various income ranges: 195.2% for AGIs $25k-50k, 506.0% for AGIs $50k-75k, 630.0% for AGIs $75k-100k, 1407.5% for AGIs $100k-200k, 8865.0% for AGIs over 200k)
Charity contributions: $11,950 (reported on 8.0% of returns)
Here:
$11,950
State:
$10,381
(% of AGI for various income ranges: 30.5% for AGIs below $25k, 88.7% for AGIs $50k-75k, 140.0% for AGIs $75k-100k, 362.5% for AGIs $100k-200k, 4225.0% for AGIs over 200k)
Taxes paid: $7,024 (reported on 9.7% of returns)
23417:
$7,024
State:
$8,284
(% of AGI for various income ranges: 23.3% for AGIs $25k-50k, 86.7% for AGIs $50k-75k, 185.6% for AGIs $75k-100k, 400.8% for AGIs $100k-200k, 1695.0% for AGIs over 200k)
Earned income credit: $2,197 (reported on 17.6% of returns)
Here:
$2,197
State:
$2,214
(% of AGI for various income ranges: 106.8% for AGIs below $25k, 63.9% for AGIs $25k-50k)
Percentage of individuals using paid preparers for their 2020 taxes: 93.2%
Here:
93%
State:
92%
(% for various income ranges: 93.3% for AGIs below $25k, 91.3% for AGIs $25k-50k, 91.7% for AGIs $50k-75k, 92.9% for AGIs $75k-100k, 95.8% for AGIs $100k-200k, 100.0% for AGIs over 200k)
Averages for the 2012 tax year for zip code 23417, filed in 2013:
Average Adjusted Gross Income (AGI) in 2012: $51,740 (Individual Income Tax Returns)
Here:
$51,740
State:
$71,192
Salary/wage: $38,378 (reported on 75.0% of returns)
Here:
$38,378
State:
$59,229
(% of AGI for various income ranges: 71.5% for AGIs below $25k, 66.5% for AGIs $25k-50k, 56.6% for AGIs $50k-75k, 55.8% for AGIs $75k-100k, 57.7% for AGIs $100k-200k, 33.8% for AGIs over 200k)
Taxable interest for individuals: $2,668 (reported on 36.6% of returns)
This zip code:
$2,668
Virginia:
$1,600
(% of AGI for various income ranges: 2.2% for AGIs below $25k, 2.8% for AGIs $25k-50k, 2.7% for AGIs $50k-75k, 1.4% for AGIs $75k-100k, 0.7% for AGIs $100k-200k, 2.0% for AGIs over 200k)
Ordinary dividends: $8,309 (reported on 27.3% of returns)
Here:
$8,309
State:
$6,959
(% of AGI for various income ranges: 3.3% for AGIs below $25k, 3.0% for AGIs $25k-50k, 3.5% for AGIs $50k-75k, 3.7% for AGIs $75k-100k, 3.0% for AGIs $100k-200k, 9.1% for AGIs over 200k)
Net capital gain/loss in AGI: +$7,872 (reported on 20.9% of returns)
Here:
+$7,872
State:
+$16,672
(% of AGI for various income ranges: 0.3% for AGIs below $25k, 0.7% for AGIs $50k-75k, 3.0% for AGIs $100k-200k, 12.4% for AGIs over 200k)
Profit/loss from business: +$10,947 (reported on 17.4% of returns)
Here:
+$10,947
State:
+$14,116
(% of AGI for various income ranges: 7.4% for AGIs below $25k, 4.2% for AGIs $25k-50k, 2.2% for AGIs $50k-75k, 2.1% for AGIs $75k-100k, 6.7% for AGIs $100k-200k)
Taxable individual retirement arrangement distribution: $14,796 (reported on 14.5% of returns)
23417:
$14,796
Virginia:
$16,667
(% of AGI for various income ranges: 3.1% for AGIs below $25k, 2.3% for AGIs $25k-50k, 5.1% for AGIs $50k-75k, 5.0% for AGIs $75k-100k, 8.4% for AGIs $100k-200k)
Total itemized deductions: $21,466 (24% of AGI, reported on 34.3% of returns)
Here:
$21,466
State:
$26,596
Here:
23.7% of AGI
State:
20.1% of AGI
(% of AGI for various income ranges: 16.5% for AGIs below $25k, 14.5% for AGIs $25k-50k, 14.5% for AGIs $50k-75k, 13.6% for AGIs $75k-100k, 16.5% for AGIs $100k-200k, 10.3% for AGIs over 200k)
Charity contributions: $3,626 (reported on 29.1% of returns)
Here:
$3,626
State:
$4,443
(% of AGI for various income ranges: 1.4% for AGIs below $25k, 2.0% for AGIs $25k-50k, 2.2% for AGIs $50k-75k, 2.0% for AGIs $75k-100k, 2.6% for AGIs $100k-200k, 1.6% for AGIs over 200k)
Taxes paid: $5,997 (reported on 33.7% of returns)
23417:
$5,997
State:
$9,951
(% of AGI for various income ranges: 2.1% for AGIs below $25k, 2.2% for AGIs $25k-50k, 3.2% for AGIs $50k-75k, 4.1% for AGIs $75k-100k, 5.7% for AGIs $100k-200k, 4.8% for AGIs over 200k)
Earned income credit: $2,097 (reported on 18.0% of returns)
Here:
$2,097
State:
$2,211
(% of AGI for various income ranges: 5.8% for AGIs below $25k, 0.7% for AGIs $25k-50k)
Percentage of individuals using paid preparers for their 2012 taxes: 61.0%
Here:
61%
State:
46%
(% for various income ranges: 58.3% for AGIs below $25k, 60.5% for AGIs $25k-50k, 66.7% for AGIs $50k-75k, 64.3% for AGIs $75k-100k, 60.0% for AGIs $100k-200k, 75.0% for AGIs over 200k)
Averages for the 2004 tax year for zip code 23417, filed in 2005:
Average Adjusted Gross Income (AGI) in 2004: $42,530 (Individual Income Tax Returns)
Here:
$42,530
State:
$56,704
Salary/wage: $31,771 (reported on 73.4% of returns)
Here:
$31,771
State:
$48,441
(% of AGI for various income ranges: 87.2% for AGIs below $10k, 67.1% for AGIs $10k-25k, 61.3% for AGIs $25k-50k, 60.7% for AGIs $50k-75k, 55.0% for AGIs $75k-100k, 42.4% for AGIs over 100k)
Taxable interest for individuals: $3,081 (reported on 46.7% of returns)
This zip code:
$3,081
Virginia:
$1,688
(% of AGI for various income ranges: 8.0% for AGIs below $10k, 3.8% for AGIs $10k-25k, 2.9% for AGIs $25k-50k, 4.0% for AGIs $50k-75k, 4.5% for AGIs $75k-100k, 2.5% for AGIs over 100k)
Taxable dividends: $6,616 (reported on 32.5% of returns)
Here:
$6,616
State:
$4,028
(% of AGI for various income ranges: 6.0% for AGIs below $10k, 3.1% for AGIs $10k-25k, 3.7% for AGIs $25k-50k, 4.0% for AGIs $50k-75k, 6.1% for AGIs $75k-100k, 6.5% for AGIs over 100k)
Net capital gain/loss: +$13,331 (reported on 26.0% of returns)
Here:
+$13,331
State:
+$14,375
(% of AGI for various income ranges: -1.1% for AGIs below $10k, 1.6% for AGIs $10k-25k, 1.8% for AGIs $25k-50k, 3.2% for AGIs $50k-75k, 5.3% for AGIs $75k-100k, 17.7% for AGIs over 100k)
Profit/loss from business: +$12,722 (reported on 16.5% of returns)
Here:
+$12,722
State:
+$13,342
(% of AGI for various income ranges: 9.7% for AGIs below $10k, 5.1% for AGIs $10k-25k, 5.0% for AGIs $25k-50k, 2.8% for AGIs $50k-75k, 2.7% for AGIs $75k-100k, 6.4% for AGIs over 100k)
Profit/loss from farming: +$1,000 (reported on 1.1% of returns)
Here:
+$1,000
State:
-$5,267
IRA payment deduction: $3,431 (reported on 3.1% of returns)
23417:
$3,431
Virginia:
$2,943
(% of AGI for various income ranges: 0.4% for AGIs $10k-25k, 0.3% for AGIs $25k-50k, 0.3% for AGIs $50k-75k, 0.3% for AGIs over 100k)
Total itemized deductions: $17,186 (21% of AGI, reported on 29.5% of returns)
Here:
$17,186
State:
$21,492
Here:
21.1% of AGI
State:
21.0% of AGI
(% of AGI for various income ranges: 11.4% for AGIs below $10k, 9.8% for AGIs $10k-25k, 12.6% for AGIs $25k-50k, 12.1% for AGIs $50k-75k, 14.4% for AGIs $75k-100k, 11.2% for AGIs over 100k)
Charity contributions deductions: $3,852 (4% of AGI, reported on 26.5% of returns)
Here:
$3,852
State:
$3,794
Here:
4.5% of AGI
State:
3.5% of AGI
(% of AGI for various income ranges: 0.5% for AGIs below $10k, 1.3% for AGIs $10k-25k, 2.1% for AGIs $25k-50k, 2.6% for AGIs $50k-75k, 2.7% for AGIs $75k-100k, 2.8% for AGIs over 100k)
Total tax: $6,400 (reported on 73.8% of returns)
23417:
$6,400
State:
$9,537
(% of AGI for various income ranges: 2.8% for AGIs below $10k, 3.3% for AGIs $10k-25k, 6.8% for AGIs $25k-50k, 9.0% for AGIs $50k-75k, 10.2% for AGIs $75k-100k, 17.8% for AGIs over 100k)
Earned income credit: $1,891 (reported on 17.7% of returns)
Here:
$1,891
State:
$1,734
Percentage of individuals using paid preparers for their 2004 taxes: 60.1%
Here:
60%
State:
52%
(% for various income ranges: 51.0% for AGIs below $10k, 63.1% for AGIs $10k-25k, 57.0% for AGIs $25k-50k, 66.2% for AGIs $50k-75k, 71.2% for AGIs $75k-100k, 62.9% for AGIs over 100k)
Household received Food Stamps/SNAP in the past 12 months: 231 Household did not receive Food Stamps/SNAP in the past 12 months: 1,847
Women who had a birth in the past 12 months: 23 (0 now married, 21 unmarried) Women who did not have a birth in the past 12 months: 648 (197 now married, 453 unmarried)
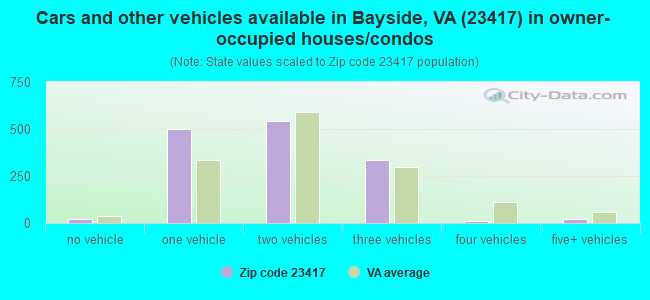
Housing units in zip code 23417 with a mortgage: 429 (48 second mortgage, 47 both second mortgage and home equity loan) Houses without a mortgage: 20
Median monthly owner costs for units with a mortgage: $1,414 Median monthly owner costs for units without a mortgage: $554
Residents with income below the poverty level in 2022:
This zip code:
11.6%
Whole state:
10.6%
Residents with income below 50% of the poverty level in 2022:
This zip code:
7.2%
Whole state:
5.2%
Median number of rooms in houses and condos:
Here:
6.7
State:
7.0
Median number of rooms in apartments:
Here:
5.4
State:
4.3
Notable locations in this zip code not listed on our city pages
Notable locations in zip code 23417: Poplar Cove (A), Poplar Cove Wharf (B), The Oaks (C), Finneys Wharf (D), Evans Wharf (E), Broadway Landing (F), Dinglers Mill (G), Poplar Cove Wharf (H), Scott Store (I), Town of Onancock Wastewater Treatment Facility (J), Onancock Volunteer Fire Department (K), Onancock Police Department (L), Hermitage on the Eastern Shore Assisted Living Facility (M). Display/hide their locations on the map
Churches in zip code 23417 include: Andrew Chapel (A), Broadway Church (B), Gaskin Chapel (C), Wise Chapel (D), Leatherbury Church (E), New Testament Church (F). Display/hide their locations on the map
Streams, rivers, and creeks: Warrington Branch (A), Underhill Creek (B), Titlow Creek (C), Thicket Creek (D), Tarkill Creek (E), South Branch Onancock Creek (F), Pungoteague Creek (G), Pompco Creek (H), Pakers Creek (I). Display/hide their locations on the map
In group quarters: 49 (-1 institutionalized population)
Size of family households: 704 2-persons, 268 3-persons, 155 4-persons, 31 5-persons, 30 6-persons
Size of nonfamily households: 851 1-person, 33 2-persons, 1 3-persons
68 married couples with children.
495 single-parent households (93 men, 402 women).
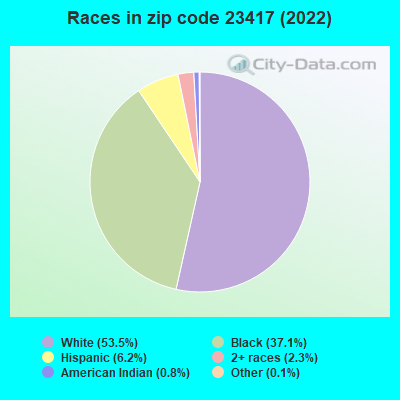
93.8% of residents of 23417 zip code speak English at home.
4.8% of residents speak Spanish at home (83% very well, 15% well, 2% not well).
2.3% of residents speak other Indo-European language at home (90% very well, 10% not well).
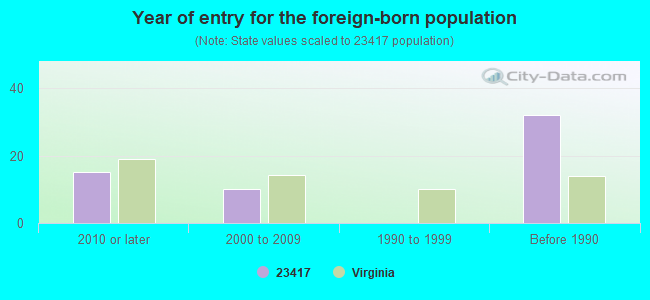
Foreign born population: 38 (1.0%) (52.7% of them are naturalized citizens)
This zip code:
1.0%
Whole state:
12.7%
29%Bolivia
26%Grenada
13%France
5%Sweden
5%United Kingdom, excluding England and Scotland
5%Italy
5%Honduras
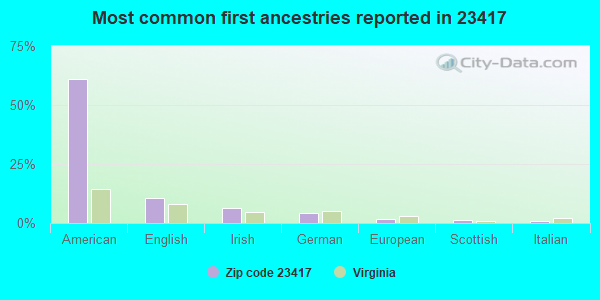
61%American
11%English
6%Irish
4%German
2%European
1%Scottish
1%Italian
Year of entry for the foreign-born population
152010 or later
102000 to 2009
01990 to 1999
32Before 1990
Facilities with environmental interests located in this zip code:
CHESAPEAKE & POTOMAC TELEPHONE CO (150 MARKET ST in ONANCOCK, VA)
(Resource Conservation and Recovery Act (tracking hazardous waste)) Organizations: OPERNAME (CONTACT/OPERATOR)
, CHESAPEAKE & POTOMAC TELEPHONE COMPANY (CONTACT/OWNER)
CHESAPEAKE & POTOMAC TELEPHONE CO (ONANCOCK RADIO HUT in ONANCOCK, VA)
C & P TELEPHONE OF VA-ONANCOCK (KERR & PINE ST in ONANCOCK, VA)
Small Quantity Generators, between 100 kg and 1000 kg of hazardous waste/month (Resource Conservation and Recovery Act (tracking hazardous waste)) - notification Organizations: MARY M JOHNSON & POLLY B DIZE (CONTACT/OWNER)
Housing units lacking complete plumbing facilities: 3.4% Housing units lacking complete kitchen facilities: 3.2%
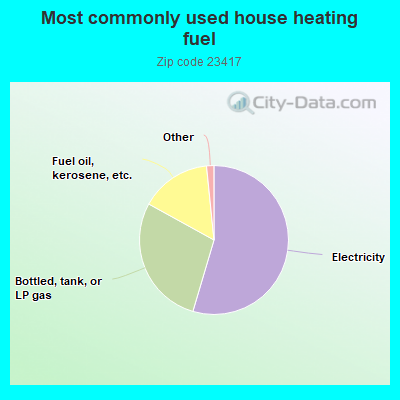
54.7%Electricity
28.5%Bottled, tank, or LP gas
15.4%Fuel oil, kerosene, etc.
0.9%Wood
0.7%No fuel used
Population in 1990: 3,914. Population change in the 1990s: +186 (+4.8%).
Place of birth for U.S.-born residents:
This state: 2,418
Northeast: 578
Midwest: 137
South: 695
West: 58
62% of the 23417 zip code residents lived in the same house 5 years ago. Out of people who lived in different houses, 55% lived in this county. Out of people who lived in different counties, 50% lived in Virginia.
95% of the 23417 zip code residents lived in the same house 1 year ago. Out of people who lived in different houses, 48% moved from this county. Out of people who lived in different houses, 34% moved from different county within same state. Out of people who lived in different houses, 22% moved from different state.
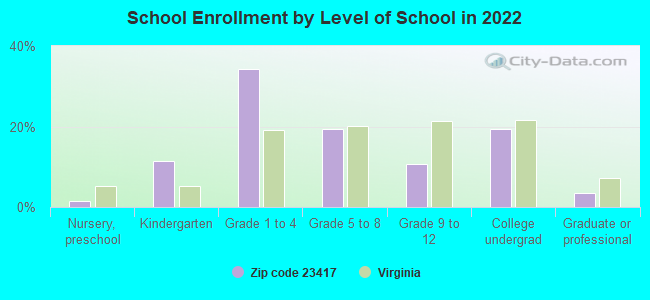
Private vs. public school enrollment:
Students in private schools in grades 1 to 8 (elementary and middle school): 4
Here:
1.7%
Virginia:
13.2%
Students in private schools in grades 9 to 12 (high school):
Here:
0.0%
Virginia:
10.2%
Students in private undergraduate colleges:
Here:
0.0%
Virginia:
18.7%
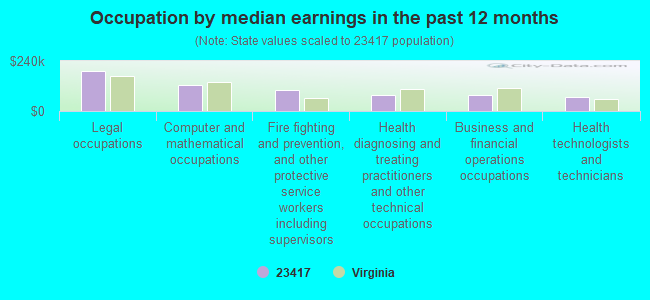
Occupation by median earnings in the past 12 months ($)
192,754Legal occupations
127,129Computer and mathematical occupations
102,043Fire fighting and prevention, and other protective service workers including supervisors
78,975Health diagnosing and treating practitioners and other technical occupations
74,445Business and financial operations occupations
67,271Health technologists and technicians
Companies with federal contracts located in this zip code:
BAGWELL OIL CO INC (33 MARKET ST in ONANCOCK, VA; small business) : $5,393 in 2 contractsin 2006
$8,456 with Navy for Fuel Oils. Signed on 2006-03-17. Completion date: 2006-05-12.
-$3,063, same as above.Signed on 2006-05-17. Completion date: 2006-05-18.
SMITH SEAFOOD (18370 CASHVILLE ROAD in ONANCOCK, VA; small business) : $4,125 in 2 contractsin 2003
$3,000 with Army for Communications Services. Signed on 2003-05-01. Completion date: 2003-05-31.
$1,125, same as above.Signed on 2003-06-23. Completion date: 2003-05-31.
Top industries in this zip code by the number of employees in 2005:
Health Care and Social Assistance: Continuing Care Retirement Communities (100-249 employees: 1 establishment)
Health Care and Social Assistance: Services for the Elderly and Persons with Disabilities (100-249: 1)
Health Care and Social Assistance: Home Health Care Services (50-99: 2)
Arts, Entertainment, and Recreation: Fitness and Recreational Sports Centers (50-99: 1)
Health Care and Social Assistance: All Other Outpatient Care Centers (20-49: 1)
Other Services (except Public Administration): Religious Organizations (10-19: 1, 5-9: 1, 1-4: 3)
People in group quarters in 2010:
25 people in nursing facilities/skilled-nursing facilities
6 people in group homes intended for adults
People in group quarters in 2000:
86 people in nursing homes
77 people in other noninstitutional group quarters
5 people in homes for the mentally retarded
Fatal accident statistics in 2014:
Fatal accident count: 1
Vehicles involved in fatal accidents: 1
Fatal accidents caused by drunken drivers: 0
Fatalities: 1
Persons involved in fatal accidents: 1
Pedestrians involved in fatal accidents: 1
Fatal accident statistics in 2011:
Fatal accident count: 1
Vehicles involved in fatal accidents: 1
Fatal accidents caused by drunken drivers: 1
Fatalities: 1
Persons involved in fatal accidents: 2
Pedestrians involved in fatal accidents: 0
2002 - 2018 National Fire Incident Reporting System (NFIRS) incidents
Based on the data from the years 2002 - 2018 the average number of fire incidents per year is 51. The highest number of reported fire incidents - 123 took place in 2011, and the least - 14 in 2009. The data has a rising trend.
When looking into fire subcategories, the most incidents belonged to: Structure Fires (61.5%), and Outside Fires (25.7%).
Fire incident types reported to NFIRS in Zip Code 23417


+$1,000
-$5,267
 Nearest zip codes: 23441, 23357, 23389, 23358, 23422, 23410.


 Based on the data from the years 2002 - 2018 the average number of fire incidents per year is 51. The highest number of reported fire incidents - 123 took place in 2011, and the least - 14 in 2009. The data has a rising trend.
 When looking into fire subcategories, the most incidents belonged to: Structure Fires (61.5%), and Outside Fires (25.7%).