Estimated zip code population in 2022: 8,407
Zip code population in 2010: 6,531
Zip code population in 2000: 6,782
Houses and condos: 10,295
Renter-occupied apartments: 529
% of renters here:
13%State:
33%
March 2022 cost of living index in zip code 28465: 94.5
(less than average, U.S. average is 100)
Land area: 10.6
sq. mi.
Water area: 3.4
sq. mi.
Population density: 794 people per square mile (low).
OSM Map
General Map
Google Map
MSN Map
OSM Map
General Map
Google Map
MSN Map
OSM Map
General Map
Google Map
MSN Map
OSM Map
General Map
Google Map
MSN Map
Please wait while loading the map...
Real estate property taxes paid for housing units in 2022:
This zip code:
0.6% ($2,798)North Carolina:
0.6% ($1,769)
Median real estate property taxes paid for housing units with mortgages in 2022: $2,631 (0.6%)
Median real estate property taxes paid for housing units with no mortgage in 2022: $3,141 (0.7%)
Profiles of local businesses
Business Search - 14 Million verified businesses
Males: 4,036 Females: 4,371
For population 25 years and over in 28465:
High school or higher: 97.6%Bachelor's degree or higher: 46.1%Graduate or professional degree: 17.9%Unemployed: 2.6%Mean travel time to work (commute): 25.7 minutes
For population 15 years and over in 28465:
Never married: 15.0%Now married: 66.2%Separated: 0.6%Widowed: 5.3%Divorced: 12.8%
Zip code 28465 compared to state average:
Median house value above state average. Black race population percentage significantly below state average. Hispanic race population percentage significantly below state average. Median age significantly above state average. Foreign-born population percentage significantly below state average. Renting percentage significantly below state average. Length of stay since moving in below state average. House age below state average. Number of college students below state average. Percentage of population with a bachelor's degree or higher above state average. 8,003 95.2% White 198 2.4% Two or more races 115 1.4% Hispanic or Latino 45 0.5% Asian 37 0.4% Black 7 0.08% American Indian
Data:
Median household income ($)
Median household income (% change since 2000)
Household income diversity
Ratio of average income to average house value (%)
Ratio of average income to average rent
Median household income ($) - White
Median household income ($) - Black or African American
Median household income ($) - Asian
Median household income ($) - Hispanic or Latino
Median household income ($) - American Indian and Alaska Native
Median household income ($) - Multirace
Median household income ($) - Other Race
Median household income for houses/condos with a mortgage ($)
Median household income for apartments without a mortgage ($)
Races - White alone (%)
Races - White alone (% change since 2000)
Races - Black alone (%)
Races - Black alone (% change since 2000)
Races - American Indian alone (%)
Races - American Indian alone (% change since 2000)
Races - Asian alone (%)
Races - Asian alone (% change since 2000)
Races - Hispanic (%)
Races - Hispanic (% change since 2000)
Races - Native Hawaiian and Other Pacific Islander alone (%)
Races - Native Hawaiian and Other Pacific Islander alone (% change since 2000)
Races - Two or more races (%)
Races - Two or more races (% change since 2000)
Races - Other race alone (%)
Races - Other race alone (% change since 2000)
Racial diversity
Unemployment (%)
Unemployment (% change since 2000)
Unemployment (%) - White
Unemployment (%) - Black or African American
Unemployment (%) - Asian
Unemployment (%) - Hispanic or Latino
Unemployment (%) - American Indian and Alaska Native
Unemployment (%) - Multirace
Unemployment (%) - Other Race
Population density (people per square mile)
Population - Males (%)
Population - Females (%)
Population - Males (%) - White
Population - Males (%) - Black or African American
Population - Males (%) - Asian
Population - Males (%) - Hispanic or Latino
Population - Males (%) - American Indian and Alaska Native
Population - Males (%) - Multirace
Population - Males (%) - Other Race
Population - Females (%) - White
Population - Females (%) - Black or African American
Population - Females (%) - Asian
Population - Females (%) - Hispanic or Latino
Population - Females (%) - American Indian and Alaska Native
Population - Females (%) - Multirace
Population - Females (%) - Other Race
Coronavirus confirmed cases (May 08, 2024)
Deaths caused by coronavirus (May 08, 2024)
Coronavirus confirmed cases (per 100k population) (May 08, 2024)
Deaths caused by coronavirus (per 100k population) (May 08, 2024)
Daily increase in number of cases (May 08, 2024)
Weekly increase in number of cases (May 08, 2024)
Cases doubled (in days) (May 08, 2024)
Hospitalized patients (Apr 18, 2022)
Negative test results (Apr 18, 2022)
Total test results (Apr 18, 2022)
COVID Vaccine doses distributed (per 100k population) (Sep 19, 2023)
COVID Vaccine doses administered (per 100k population) (Sep 19, 2023)
COVID Vaccine doses distributed (Sep 19, 2023)
COVID Vaccine doses administered (Sep 19, 2023)
Likely homosexual households (%)
Likely homosexual households (% change since 2000)
Likely homosexual households - Lesbian couples (%)
Likely homosexual households - Lesbian couples (% change since 2000)
Likely homosexual households - Gay men (%)
Likely homosexual households - Gay men (% change since 2000)
Cost of living index
Median gross rent ($)
Median contract rent ($)
Median monthly housing costs ($)
Median house or condo value ($)
Median house or condo value ($ change since 2000)
Mean house or condo value by units in structure - 1, detached ($)
Mean house or condo value by units in structure - 1, attached ($)
Mean house or condo value by units in structure - 2 ($)
Mean house or condo value by units in structure by units in structure - 3 or 4 ($)
Mean house or condo value by units in structure - 5 or more ($)
Mean house or condo value by units in structure - Boat, RV, van, etc. ($)
Mean house or condo value by units in structure - Mobile home ($)
Median house or condo value ($) - White
Median house or condo value ($) - Black or African American
Median house or condo value ($) - Asian
Median house or condo value ($) - Hispanic or Latino
Median house or condo value ($) - American Indian and Alaska Native
Median house or condo value ($) - Multirace
Median house or condo value ($) - Other Race
Median resident age
Resident age diversity
Median resident age - Males
Median resident age - Females
Median resident age - White
Median resident age - Black or African American
Median resident age - Asian
Median resident age - Hispanic or Latino
Median resident age - American Indian and Alaska Native
Median resident age - Multirace
Median resident age - Other Race
Median resident age - Males - White
Median resident age - Males - Black or African American
Median resident age - Males - Asian
Median resident age - Males - Hispanic or Latino
Median resident age - Males - American Indian and Alaska Native
Median resident age - Males - Multirace
Median resident age - Males - Other Race
Median resident age - Females - White
Median resident age - Females - Black or African American
Median resident age - Females - Asian
Median resident age - Females - Hispanic or Latino
Median resident age - Females - American Indian and Alaska Native
Median resident age - Females - Multirace
Median resident age - Females - Other Race
Commute - mean travel time to work (minutes)
Travel time to work - Less than 5 minutes (%)
Travel time to work - Less than 5 minutes (% change since 2000)
Travel time to work - 5 to 9 minutes (%)
Travel time to work - 5 to 9 minutes (% change since 2000)
Travel time to work - 10 to 19 minutes (%)
Travel time to work - 10 to 19 minutes (% change since 2000)
Travel time to work - 20 to 29 minutes (%)
Travel time to work - 20 to 29 minutes (% change since 2000)
Travel time to work - 30 to 39 minutes (%)
Travel time to work - 30 to 39 minutes (% change since 2000)
Travel time to work - 40 to 59 minutes (%)
Travel time to work - 40 to 59 minutes (% change since 2000)
Travel time to work - 60 to 89 minutes (%)
Travel time to work - 60 to 89 minutes (% change since 2000)
Travel time to work - 90 or more minutes (%)
Travel time to work - 90 or more minutes (% change since 2000)
Marital status - Never married (%)
Marital status - Now married (%)
Marital status - Separated (%)
Marital status - Widowed (%)
Marital status - Divorced (%)
Median family income ($)
Median family income (% change since 2000)
Median non-family income ($)
Median non-family income (% change since 2000)
Median per capita income ($)
Median per capita income (% change since 2000)
Median family income ($) - White
Median family income ($) - Black or African American
Median family income ($) - Asian
Median family income ($) - Hispanic or Latino
Median family income ($) - American Indian and Alaska Native
Median family income ($) - Multirace
Median family income ($) - Other Race
Median year house/condo built
Median year apartment built
Year house built - Built 2005 or later (%)
Year house built - Built 2000 to 2004 (%)
Year house built - Built 1990 to 1999 (%)
Year house built - Built 1980 to 1989 (%)
Year house built - Built 1970 to 1979 (%)
Year house built - Built 1960 to 1969 (%)
Year house built - Built 1950 to 1959 (%)
Year house built - Built 1940 to 1949 (%)
Year house built - Built 1939 or earlier (%)
Average household size
Household density (households per square mile)
Average household size - White
Average household size - Black or African American
Average household size - Asian
Average household size - Hispanic or Latino
Average household size - American Indian and Alaska Native
Average household size - Multirace
Average household size - Other Race
Occupied housing units (%)
Vacant housing units (%)
Owner occupied housing units (%)
Renter occupied housing units (%)
Vacancy status - For rent (%)
Vacancy status - For sale only (%)
Vacancy status - Rented or sold, not occupied (%)
Vacancy status - For seasonal, recreational, or occasional use (%)
Vacancy status - For migrant workers (%)
Vacancy status - Other vacant (%)
Residents with income below the poverty level (%)
Residents with income below 50% of the poverty level (%)
Children below poverty level (%)
Poor families by family type - Married-couple family (%)
Poor families by family type - Male, no wife present (%)
Poor families by family type - Female, no husband present (%)
Poverty status for native-born residents (%)
Poverty status for foreign-born residents (%)
Poverty among high school graduates not in families (%)
Poverty among people who did not graduate high school not in families (%)
Residents with income below the poverty level (%) - White
Residents with income below the poverty level (%) - Black or African American
Residents with income below the poverty level (%) - Asian
Residents with income below the poverty level (%) - Hispanic or Latino
Residents with income below the poverty level (%) - American Indian and Alaska Native
Residents with income below the poverty level (%) - Multirace
Residents with income below the poverty level (%) - Other Race
Air pollution - Air Quality Index (AQI)
Air pollution - CO
Air pollution - NO2
Air pollution - SO2
Air pollution - Ozone
Air pollution - PM10
Air pollution - PM25
Air pollution - Pb
Crime - Murders per 100,000 population
Crime - Rapes per 100,000 population
Crime - Robberies per 100,000 population
Crime - Assaults per 100,000 population
Crime - Burglaries per 100,000 population
Crime - Thefts per 100,000 population
Crime - Auto thefts per 100,000 population
Crime - Arson per 100,000 population
Crime - City-data.com crime index
Crime - Violent crime index
Crime - Property crime index
Crime - Murders per 100,000 population (5 year average)
Crime - Rapes per 100,000 population (5 year average)
Crime - Robberies per 100,000 population (5 year average)
Crime - Assaults per 100,000 population (5 year average)
Crime - Burglaries per 100,000 population (5 year average)
Crime - Thefts per 100,000 population (5 year average)
Crime - Auto thefts per 100,000 population (5 year average)
Crime - Arson per 100,000 population (5 year average)
Crime - City-data.com crime index (5 year average)
Crime - Violent crime index (5 year average)
Crime - Property crime index (5 year average)
1996 Presidential Elections Results (%) - Democratic Party (Clinton)
1996 Presidential Elections Results (%) - Republican Party (Dole)
1996 Presidential Elections Results (%) - Other
2000 Presidential Elections Results (%) - Democratic Party (Gore)
2000 Presidential Elections Results (%) - Republican Party (Bush)
2000 Presidential Elections Results (%) - Other
2004 Presidential Elections Results (%) - Democratic Party (Kerry)
2004 Presidential Elections Results (%) - Republican Party (Bush)
2004 Presidential Elections Results (%) - Other
2008 Presidential Elections Results (%) - Democratic Party (Obama)
2008 Presidential Elections Results (%) - Republican Party (McCain)
2008 Presidential Elections Results (%) - Other
2012 Presidential Elections Results (%) - Democratic Party (Obama)
2012 Presidential Elections Results (%) - Republican Party (Romney)
2012 Presidential Elections Results (%) - Other
2016 Presidential Elections Results (%) - Democratic Party (Clinton)
2016 Presidential Elections Results (%) - Republican Party (Trump)
2016 Presidential Elections Results (%) - Other
2020 Presidential Elections Results (%) - Democratic Party (Biden)
2020 Presidential Elections Results (%) - Republican Party (Trump)
2020 Presidential Elections Results (%) - Other
Ancestries Reported - Arab (%)
Ancestries Reported - Czech (%)
Ancestries Reported - Danish (%)
Ancestries Reported - Dutch (%)
Ancestries Reported - English (%)
Ancestries Reported - French (%)
Ancestries Reported - French Canadian (%)
Ancestries Reported - German (%)
Ancestries Reported - Greek (%)
Ancestries Reported - Hungarian (%)
Ancestries Reported - Irish (%)
Ancestries Reported - Italian (%)
Ancestries Reported - Lithuanian (%)
Ancestries Reported - Norwegian (%)
Ancestries Reported - Polish (%)
Ancestries Reported - Portuguese (%)
Ancestries Reported - Russian (%)
Ancestries Reported - Scotch-Irish (%)
Ancestries Reported - Scottish (%)
Ancestries Reported - Slovak (%)
Ancestries Reported - Subsaharan African (%)
Ancestries Reported - Swedish (%)
Ancestries Reported - Swiss (%)
Ancestries Reported - Ukrainian (%)
Ancestries Reported - United States (%)
Ancestries Reported - Welsh (%)
Ancestries Reported - West Indian (%)
Ancestries Reported - Other (%)
Educational Attainment - No schooling completed (%)
Educational Attainment - Less than high school (%)
Educational Attainment - High school or equivalent (%)
Educational Attainment - Less than 1 year of college (%)
Educational Attainment - 1 or more years of college (%)
Educational Attainment - Associate degree (%)
Educational Attainment - Bachelor's degree (%)
Educational Attainment - Master's degree (%)
Educational Attainment - Professional school degree (%)
Educational Attainment - Doctorate degree (%)
School Enrollment - Nursery, preschool (%)
School Enrollment - Kindergarten (%)
School Enrollment - Grade 1 to 4 (%)
School Enrollment - Grade 5 to 8 (%)
School Enrollment - Grade 9 to 12 (%)
School Enrollment - College undergrad (%)
School Enrollment - Graduate or professional (%)
School Enrollment - Not enrolled in school (%)
School enrollment - Public schools (%)
School enrollment - Private schools (%)
School enrollment - Not enrolled (%)
Median number of rooms in houses and condos
Median number of rooms in apartments
Housing units lacking complete plumbing facilities (%)
Housing units lacking complete kitchen facilities (%)
Density of houses
Urban houses (%)
Rural houses (%)
Households with people 60 years and over (%)
Households with people 65 years and over (%)
Households with people 75 years and over (%)
Households with one or more nonrelatives (%)
Households with no nonrelatives (%)
Population in households (%)
Family households (%)
Nonfamily households (%)
Population in families (%)
Family households with own children (%)
Median number of bedrooms in owner occupied houses
Mean number of bedrooms in owner occupied houses
Median number of bedrooms in renter occupied houses
Mean number of bedrooms in renter occupied houses
Median number of vehichles in owner occupied houses
Mean number of vehichles in owner occupied houses
Median number of vehichles in renter occupied houses
Mean number of vehichles in renter occupied houses
Mortgage status - with mortgage (%)
Mortgage status - with second mortgage (%)
Mortgage status - with home equity loan (%)
Mortgage status - with both second mortgage and home equity loan (%)
Mortgage status - without a mortgage (%)
Average family size
Average family size - White
Average family size - Black or African American
Average family size - Asian
Average family size - Hispanic or Latino
Average family size - American Indian and Alaska Native
Average family size - Multirace
Average family size - Other Race
Geographical mobility - Same house 1 year ago (%)
Geographical mobility - Moved within same county (%)
Geographical mobility - Moved from different county within same state (%)
Geographical mobility - Moved from different state (%)
Geographical mobility - Moved from abroad (%)
Place of birth - Born in state of residence (%)
Place of birth - Born in other state (%)
Place of birth - Native, outside of US (%)
Place of birth - Foreign born (%)
Housing units in structures - 1, detached (%)
Housing units in structures - 1, attached (%)
Housing units in structures - 2 (%)
Housing units in structures - 3 or 4 (%)
Housing units in structures - 5 to 9 (%)
Housing units in structures - 10 to 19 (%)
Housing units in structures - 20 to 49 (%)
Housing units in structures - 50 or more (%)
Housing units in structures - Mobile home (%)
Housing units in structures - Boat, RV, van, etc. (%)
House/condo owner moved in on average (years ago)
Renter moved in on average (years ago)
Year householder moved into unit - Moved in 1999 to March 2000 (%)
Year householder moved into unit - Moved in 1995 to 1998 (%)
Year householder moved into unit - Moved in 1990 to 1994 (%)
Year householder moved into unit - Moved in 1980 to 1989 (%)
Year householder moved into unit - Moved in 1970 to 1979 (%)
Year householder moved into unit - Moved in 1969 or earlier (%)
Means of transportation to work - Drove car alone (%)
Means of transportation to work - Carpooled (%)
Means of transportation to work - Public transportation (%)
Means of transportation to work - Bus or trolley bus (%)
Means of transportation to work - Streetcar or trolley car (%)
Means of transportation to work - Subway or elevated (%)
Means of transportation to work - Railroad (%)
Means of transportation to work - Ferryboat (%)
Means of transportation to work - Taxicab (%)
Means of transportation to work - Motorcycle (%)
Means of transportation to work - Bicycle (%)
Means of transportation to work - Walked (%)
Means of transportation to work - Other means (%)
Working at home (%)
Industry diversity
Most Common Industries - Agriculture, forestry, fishing and hunting, and mining (%)
Most Common Industries - Agriculture, forestry, fishing and hunting (%)
Most Common Industries - Mining, quarrying, and oil and gas extraction (%)
Most Common Industries - Construction (%)
Most Common Industries - Manufacturing (%)
Most Common Industries - Wholesale trade (%)
Most Common Industries - Retail trade (%)
Most Common Industries - Transportation and warehousing, and utilities (%)
Most Common Industries - Transportation and warehousing (%)
Most Common Industries - Utilities (%)
Most Common Industries - Information (%)
Most Common Industries - Finance and insurance, and real estate and rental and leasing (%)
Most Common Industries - Finance and insurance (%)
Most Common Industries - Real estate and rental and leasing (%)
Most Common Industries - Professional, scientific, and management, and administrative and waste management services (%)
Most Common Industries - Professional, scientific, and technical services (%)
Most Common Industries - Management of companies and enterprises (%)
Most Common Industries - Administrative and support and waste management services (%)
Most Common Industries - Educational services, and health care and social assistance (%)
Most Common Industries - Educational services (%)
Most Common Industries - Health care and social assistance (%)
Most Common Industries - Arts, entertainment, and recreation, and accommodation and food services (%)
Most Common Industries - Arts, entertainment, and recreation (%)
Most Common Industries - Accommodation and food services (%)
Most Common Industries - Other services, except public administration (%)
Most Common Industries - Public administration (%)
Occupation diversity
Most Common Occupations - Management, business, science, and arts occupations (%)
Most Common Occupations - Management, business, and financial occupations (%)
Most Common Occupations - Management occupations (%)
Most Common Occupations - Business and financial operations occupations (%)
Most Common Occupations - Computer, engineering, and science occupations (%)
Most Common Occupations - Computer and mathematical occupations (%)
Most Common Occupations - Architecture and engineering occupations (%)
Most Common Occupations - Life, physical, and social science occupations (%)
Most Common Occupations - Education, legal, community service, arts, and media occupations (%)
Most Common Occupations - Community and social service occupations (%)
Most Common Occupations - Legal occupations (%)
Most Common Occupations - Education, training, and library occupations (%)
Most Common Occupations - Arts, design, entertainment, sports, and media occupations (%)
Most Common Occupations - Healthcare practitioners and technical occupations (%)
Most Common Occupations - Health diagnosing and treating practitioners and other technical occupations (%)
Most Common Occupations - Health technologists and technicians (%)
Most Common Occupations - Service occupations (%)
Most Common Occupations - Healthcare support occupations (%)
Most Common Occupations - Protective service occupations (%)
Most Common Occupations - Fire fighting and prevention, and other protective service workers including supervisors (%)
Most Common Occupations - Law enforcement workers including supervisors (%)
Most Common Occupations - Food preparation and serving related occupations (%)
Most Common Occupations - Building and grounds cleaning and maintenance occupations (%)
Most Common Occupations - Personal care and service occupations (%)
Most Common Occupations - Sales and office occupations (%)
Most Common Occupations - Sales and related occupations (%)
Most Common Occupations - Office and administrative support occupations (%)
Most Common Occupations - Natural resources, construction, and maintenance occupations (%)
Most Common Occupations - Farming, fishing, and forestry occupations (%)
Most Common Occupations - Construction and extraction occupations (%)
Most Common Occupations - Installation, maintenance, and repair occupations (%)
Most Common Occupations - Production, transportation, and material moving occupations (%)
Most Common Occupations - Production occupations (%)
Most Common Occupations - Transportation occupations (%)
Most Common Occupations - Material moving occupations (%)
People in Group quarters - Institutionalized population (%)
People in Group quarters - Correctional institutions (%)
People in Group quarters - Federal prisons and detention centers (%)
People in Group quarters - Halfway houses (%)
People in Group quarters - Local jails and other confinement facilities (including police lockups) (%)
People in Group quarters - Military disciplinary barracks (%)
People in Group quarters - State prisons (%)
People in Group quarters - Other types of correctional institutions (%)
People in Group quarters - Nursing homes (%)
People in Group quarters - Hospitals/wards, hospices, and schools for the handicapped (%)
People in Group quarters - Hospitals/wards and hospices for chronically ill (%)
People in Group quarters - Hospices or homes for chronically ill (%)
People in Group quarters - Military hospitals or wards for chronically ill (%)
People in Group quarters - Other hospitals or wards for chronically ill (%)
People in Group quarters - Hospitals or wards for drug/alcohol abuse (%)
People in Group quarters - Mental (Psychiatric) hospitals or wards (%)
People in Group quarters - Schools, hospitals, or wards for the mentally retarded (%)
People in Group quarters - Schools, hospitals, or wards for the physically handicapped (%)
People in Group quarters - Institutions for the deaf (%)
People in Group quarters - Institutions for the blind (%)
People in Group quarters - Orthopedic wards and institutions for the physically handicapped (%)
People in Group quarters - Wards in general hospitals for patients who have no usual home elsewhere (%)
People in Group quarters - Wards in military hospitals for patients who have no usual home elsewhere (%)
People in Group quarters - Juvenile institutions (%)
People in Group quarters - Long-term care (%)
People in Group quarters - Homes for abused, dependent, and neglected children (%)
People in Group quarters - Residential treatment centers for emotionally disturbed children (%)
People in Group quarters - Training schools for juvenile delinquents (%)
People in Group quarters - Short-term care, detention or diagnostic centers for delinquent children (%)
People in Group quarters - Type of juvenile institution unknown (%)
People in Group quarters - Noninstitutionalized population (%)
People in Group quarters - College dormitories (includes college quarters off campus) (%)
People in Group quarters - Military quarters (%)
People in Group quarters - On base (%)
People in Group quarters - Barracks, unaccompanied personnel housing (UPH), (Enlisted/Officer), ;and similar group living quarters for military personnel (%)
People in Group quarters - Transient quarters for temporary residents (%)
People in Group quarters - Military ships (%)
People in Group quarters - Group homes (%)
People in Group quarters - Homes or halfway houses for drug/alcohol abuse (%)
People in Group quarters - Homes for the mentally ill (%)
People in Group quarters - Homes for the mentally retarded (%)
People in Group quarters - Homes for the physically handicapped (%)
People in Group quarters - Other group homes (%)
People in Group quarters - Religious group quarters (%)
People in Group quarters - Dormitories (%)
People in Group quarters - Agriculture workers' dormitories on farms (%)
People in Group quarters - Job Corps and vocational training facilities (%)
People in Group quarters - Other workers' dormitories (%)
People in Group quarters - Crews of maritime vessels (%)
People in Group quarters - Other nonhousehold living situations (%)
People in Group quarters - Other noninstitutional group quarters (%)
Residents speaking English at home (%)
Residents speaking English at home - Born in the United States (%)
Residents speaking English at home - Native, born elsewhere (%)
Residents speaking English at home - Foreign born (%)
Residents speaking Spanish at home (%)
Residents speaking Spanish at home - Born in the United States (%)
Residents speaking Spanish at home - Native, born elsewhere (%)
Residents speaking Spanish at home - Foreign born (%)
Residents speaking other language at home (%)
Residents speaking other language at home - Born in the United States (%)
Residents speaking other language at home - Native, born elsewhere (%)
Residents speaking other language at home - Foreign born (%)
Class of Workers - Employee of private company (%)
Class of Workers - Self-employed in own incorporated business (%)
Class of Workers - Private not-for-profit wage and salary workers (%)
Class of Workers - Local government workers (%)
Class of Workers - State government workers (%)
Class of Workers - Federal government workers (%)
Class of Workers - Self-employed workers in own not incorporated business and Unpaid family workers (%)
House heating fuel used in houses and condos - Utility gas (%)
House heating fuel used in houses and condos - Bottled, tank, or LP gas (%)
House heating fuel used in houses and condos - Electricity (%)
House heating fuel used in houses and condos - Fuel oil, kerosene, etc. (%)
House heating fuel used in houses and condos - Coal or coke (%)
House heating fuel used in houses and condos - Wood (%)
House heating fuel used in houses and condos - Solar energy (%)
House heating fuel used in houses and condos - Other fuel (%)
House heating fuel used in houses and condos - No fuel used (%)
House heating fuel used in apartments - Utility gas (%)
House heating fuel used in apartments - Bottled, tank, or LP gas (%)
House heating fuel used in apartments - Electricity (%)
House heating fuel used in apartments - Fuel oil, kerosene, etc. (%)
House heating fuel used in apartments - Coal or coke (%)
House heating fuel used in apartments - Wood (%)
House heating fuel used in apartments - Solar energy (%)
House heating fuel used in apartments - Other fuel (%)
House heating fuel used in apartments - No fuel used (%)
Armed forces status - In Armed Forces (%)
Armed forces status - Civilian (%)
Armed forces status - Civilian - Veteran (%)
Armed forces status - Civilian - Nonveteran (%)
Fatal accidents locations in years 2005-2021
Fatal accidents locations in 2005
Fatal accidents locations in 2006
Fatal accidents locations in 2007
Fatal accidents locations in 2008
Fatal accidents locations in 2009
Fatal accidents locations in 2010
Fatal accidents locations in 2011
Fatal accidents locations in 2012
Fatal accidents locations in 2013
Fatal accidents locations in 2014
Fatal accidents locations in 2015
Fatal accidents locations in 2016
Fatal accidents locations in 2017
Fatal accidents locations in 2018
Fatal accidents locations in 2019
Fatal accidents locations in 2020
Fatal accidents locations in 2021
Alcohol use - People drinking some alcohol every month (%)
Alcohol use - People not drinking at all (%)
Alcohol use - Average days/month drinking alcohol
Alcohol use - Average drinks/week
Alcohol use - Average days/year people drink much
Audiometry - Average condition of hearing (%)
Audiometry - People that can hear a whisper from across a quiet room (%)
Audiometry - People that can hear normal voice from across a quiet room (%)
Audiometry - Ears ringing, roaring, buzzing (%)
Audiometry - Had a job exposure to loud noise (%)
Audiometry - Had off-work exposure to loud noise (%)
Blood Pressure & Cholesterol - Has high blood pressure (%)
Blood Pressure & Cholesterol - Checking blood pressure at home (%)
Blood Pressure & Cholesterol - Frequently checking blood cholesterol (%)
Blood Pressure & Cholesterol - Has high cholesterol level (%)
Consumer Behavior - Money monthly spent on food at supermarket/grocery store
Consumer Behavior - Money monthly spent on food at other stores
Consumer Behavior - Money monthly spent on eating out
Consumer Behavior - Money monthly spent on carryout/delivered foods
Consumer Behavior - Income spent on food at supermarket/grocery store (%)
Consumer Behavior - Income spent on food at other stores (%)
Consumer Behavior - Income spent on eating out (%)
Consumer Behavior - Income spent on carryout/delivered foods (%)
Current Health Status - General health condition (%)
Current Health Status - Blood donors (%)
Current Health Status - Has blood ever tested for HIV virus (%)
Current Health Status - Left-handed people (%)
Dermatology - People using sunscreen (%)
Diabetes - Diabetics (%)
Diabetes - Had a blood test for high blood sugar (%)
Diabetes - People taking insulin (%)
Diet Behavior & Nutrition - Diet health (%)
Diet Behavior & Nutrition - Milk product consumption (# of products/month)
Diet Behavior & Nutrition - Meals not home prepared (#/week)
Diet Behavior & Nutrition - Meals from fast food or pizza place (#/week)
Diet Behavior & Nutrition - Ready-to-eat foods (#/month)
Diet Behavior & Nutrition - Frozen meals/pizza (#/month)
Drug Use - People that ever used marijuana or hashish (%)
Drug Use - Ever used hard drugs (%)
Drug Use - Ever used any form of cocaine (%)
Drug Use - Ever used heroin (%)
Drug Use - Ever used methamphetamine (%)
Health Insurance - People covered by health insurance (%)
Kidney Conditions-Urology - Avg. # of times urinating at night
Medical Conditions - People with asthma (%)
Medical Conditions - People with anemia (%)
Medical Conditions - People with psoriasis (%)
Medical Conditions - People with overweight (%)
Medical Conditions - Elderly people having difficulties in thinking or remembering (%)
Medical Conditions - People who ever received blood transfusion (%)
Medical Conditions - People having trouble seeing even with glass/contacts (%)
Medical Conditions - People with arthritis (%)
Medical Conditions - People with gout (%)
Medical Conditions - People with congestive heart failure (%)
Medical Conditions - People with coronary heart disease (%)
Medical Conditions - People with angina pectoris (%)
Medical Conditions - People who ever had heart attack (%)
Medical Conditions - People who ever had stroke (%)
Medical Conditions - People with emphysema (%)
Medical Conditions - People with thyroid problem (%)
Medical Conditions - People with chronic bronchitis (%)
Medical Conditions - People with any liver condition (%)
Medical Conditions - People who ever had cancer or malignancy (%)
Mental Health - People who have little interest in doing things (%)
Mental Health - People feeling down, depressed, or hopeless (%)
Mental Health - People who have trouble sleeping or sleeping too much (%)
Mental Health - People feeling tired or having little energy (%)
Mental Health - People with poor appetite or overeating (%)
Mental Health - People feeling bad about themself (%)
Mental Health - People who have trouble concentrating on things (%)
Mental Health - People moving or speaking slowly or too fast (%)
Mental Health - People having thoughts they would be better off dead (%)
Oral Health - Average years since last visit a dentist
Oral Health - People embarrassed because of mouth (%)
Oral Health - People with gum disease (%)
Oral Health - General health of teeth and gums (%)
Oral Health - Average days a week using dental floss/device
Oral Health - Average days a week using mouthwash for dental problem
Oral Health - Average number of teeth
Pesticide Use - Households using pesticides to control insects (%)
Pesticide Use - Households using pesticides to kill weeds (%)
Physical Activity - People doing vigorous-intensity work activities (%)
Physical Activity - People doing moderate-intensity work activities (%)
Physical Activity - People walking or bicycling (%)
Physical Activity - People doing vigorous-intensity recreational activities (%)
Physical Activity - People doing moderate-intensity recreational activities (%)
Physical Activity - Average hours a day doing sedentary activities
Physical Activity - Average hours a day watching TV or videos
Physical Activity - Average hours a day using computer
Physical Functioning - People having limitations keeping them from working (%)
Physical Functioning - People limited in amount of work they can do (%)
Physical Functioning - People that need special equipment to walk (%)
Physical Functioning - People experiencing confusion/memory problems (%)
Physical Functioning - People requiring special healthcare equipment (%)
Prescription Medications - Average number of prescription medicines taking
Preventive Aspirin Use - Adults 40+ taking low-dose aspirin (%)
Reproductive Health - Vaginal deliveries (%)
Reproductive Health - Cesarean deliveries (%)
Reproductive Health - Deliveries resulted in a live birth (%)
Reproductive Health - Pregnancies resulted in a delivery (%)
Reproductive Health - Women breastfeeding newborns (%)
Reproductive Health - Women that had a hysterectomy (%)
Reproductive Health - Women that had both ovaries removed (%)
Reproductive Health - Women that have ever taken birth control pills (%)
Reproductive Health - Women taking birth control pills (%)
Reproductive Health - Women that have ever used Depo-Provera or injectables (%)
Reproductive Health - Women that have ever used female hormones (%)
Sexual Behavior - People 18+ that ever had sex (vaginal, anal, or oral) (%)
Sexual Behavior - Males 18+ that ever had vaginal sex with a woman (%)
Sexual Behavior - Males 18+ that ever performed oral sex on a woman (%)
Sexual Behavior - Males 18+ that ever had anal sex with a woman (%)
Sexual Behavior - Males 18+ that ever had any sex with a man (%)
Sexual Behavior - Females 18+ that ever had vaginal sex with a man (%)
Sexual Behavior - Females 18+ that ever performed oral sex on a man (%)
Sexual Behavior - Females 18+ that ever had anal sex with a man (%)
Sexual Behavior - Females 18+ that ever had any kind of sex with a woman (%)
Sexual Behavior - Average age people first had sex
Sexual Behavior - Average number of female sex partners in lifetime (males 18+)
Sexual Behavior - Average number of female vaginal sex partners in lifetime (males 18+)
Sexual Behavior - Average age people first performed oral sex on a woman (18+)
Sexual Behavior - Average number of woman performed oral sex on in lifetime (18+)
Sexual Behavior - Average number of male sex partners in lifetime (males 18+)
Sexual Behavior - Average number of male anal sex partners in lifetime (males 18+)
Sexual Behavior - Average age people first performed oral sex on a man (18+)
Sexual Behavior - Average number of male oral sex partners in lifetime (18+)
Sexual Behavior - People using protection when performing oral sex (%)
Sexual Behavior - Average number of times people have vaginal or anal sex a year
Sexual Behavior - People having sex without condom (%)
Sexual Behavior - Average number of male sex partners in lifetime (females 18+)
Sexual Behavior - Average number of male vaginal sex partners in lifetime (females 18+)
Sexual Behavior - Average number of female sex partners in lifetime (females 18+)
Sexual Behavior - Circumcised males 18+ (%)
Sleep Disorders - Average hours sleeping at night
Sleep Disorders - People that has trouble sleeping (%)
Smoking-Cigarette Use - People smoking cigarettes (%)
Taste & Smell - People 40+ having problems with smell (%)
Taste & Smell - People 40+ having problems with taste (%)
Taste & Smell - People 40+ that ever had wisdom teeth removed (%)
Taste & Smell - People 40+ that ever had tonsils teeth removed (%)
Taste & Smell - People 40+ that ever had a loss of consciousness because of a head injury (%)
Taste & Smell - People 40+ that ever had a broken nose or other serious injury to face or skull (%)
Taste & Smell - People 40+ that ever had two or more sinus infections (%)
Weight - Average height (inches)
Weight - Average weight (pounds)
Weight - Average BMI
Weight - People that are obese (%)
Weight - People that ever were obese (%)
Weight - People trying to lose weight (%)
Urban population: 7,897
Rural population: 509
Estimated median house/condo value in 2022: $456,916
28465:
$456,916North Carolina:
$280,600
According to our research of North Carolina and other state lists, there were 13 registered sex offenders living in 28465 zip code as of May 08, 2024 . The ratio of all residents to sex offenders in zip code 28465 is 540 to 1.The ratio of registered sex offenders to all residents in this zip code is near the state average.
Median resident age: This zip code:
60.2 yearsNorth Carolina median age:
39.2 years
Average household size: This zip code:
2.1 peopleNorth Carolina:
2.4 people
Averages for the 2020 tax year for zip code 28465, filed in 2021:
Average Adjusted Gross Income (AGI) in 2020: $85,120 (Individual Income Tax Returns) Here:
$85,120State:
$70,020
Salary/wage: $65,907 (reported on 63.7% of returns )Here:
$65,907State:
$58,387
(% of AGI for various income ranges: 1000.1% for AGIs below $25k , 3003.0% for AGIs $25k-50k , 5745.0% for AGIs $50k-75k , 6521.0% for AGIs $75k-100k , 16157.0% for AGIs $100k-200k , 82832.5% for AGIs over 200k ) Taxable interest for individuals: $1,432 (reported on 50.2% of returns )This zip code:
$1,432North Carolina:
$1,479
(% of AGI for various income ranges: 40.0% for AGIs below $25k , 51.4% for AGIs $25k-50k , 92.5% for AGIs $50k-75k , 131.7% for AGIs $75k-100k , 257.5% for AGIs $100k-200k , 1233.8% for AGIs over 200k ) Ordinary dividends: $5,875 (reported on 34.3% of returns )(% of AGI for various income ranges: 80.2% for AGIs below $25k , 108.4% for AGIs $25k-50k , 325.0% for AGIs $50k-75k , 359.3% for AGIs $75k-100k , 782.5% for AGIs $100k-200k , 3517.5% for AGIs over 200k ) Net capital gain/loss in AGI: +$23,127 (reported on 30.2% of returns )Here:
+$23,127State:
+$23,652
(% of AGI for various income ranges: 15.9% for AGIs below $25k , 108.4% for AGIs $25k-50k , 298.1% for AGIs $50k-75k , 436.6% for AGIs $75k-100k , 1342.0% for AGIs $100k-200k , 29778.8% for AGIs over 200k ) Profit/loss from business: +$18,987 (reported on 18.3% of returns )Here:
+$18,987State:
+$11,710
(% of AGI for various income ranges: 166.0% for AGIs below $25k , 255.7% for AGIs $25k-50k , 279.4% for AGIs $50k-75k , 494.1% for AGIs $75k-100k , 836.8% for AGIs $100k-200k , 9372.5% for AGIs over 200k ) Taxable individual retirement arrangement distribution: $25,702 (reported on 23.5% of returns )28465:
$25,702North Carolina:
$20,247
(% of AGI for various income ranges: 181.1% for AGIs below $25k , 466.2% for AGIs $25k-50k , 896.2% for AGIs $50k-75k , 1481.4% for AGIs $75k-100k , 2734.2% for AGIs $100k-200k , 6973.8% for AGIs over 200k ) Self-employed (Keogh) retirement plans: $28,233 (reported on 0.7% of returns )28465:
$28,233North Carolina:
$26,749
(% of AGI for various income ranges: 211.8% for AGIs $100k-200k ) Total itemized deductions: $29,819 (reported on 14.8% of returns )Here:
$29,819State:
$34,549
(% of AGI for various income ranges: 126.2% for AGIs below $25k , 277.7% for AGIs $25k-50k , 788.4% for AGIs $50k-75k , 994.8% for AGIs $75k-100k , 1563.2% for AGIs $100k-200k , 7548.8% for AGIs over 200k ) Charity contributions: $6,604 (reported on 12.4% of returns )(% of AGI for various income ranges: 8.8% for AGIs below $25k , 24.8% for AGIs $25k-50k , 81.9% for AGIs $50k-75k , 132.4% for AGIs $75k-100k , 308.2% for AGIs $100k-200k , 2093.8% for AGIs over 200k ) Taxes paid: $7,857 (reported on 14.1% of returns )(% of AGI for various income ranges: 22.7% for AGIs below $25k , 56.2% for AGIs $25k-50k , 171.6% for AGIs $50k-75k , 235.9% for AGIs $75k-100k , 463.5% for AGIs $100k-200k , 1901.2% for AGIs over 200k ) Earned income credit: $1,732 (reported on 8.3% of returns )(% of AGI for various income ranges: 57.3% for AGIs below $25k , 34.6% for AGIs $25k-50k ) Percentage of individuals using paid preparers for their 2020 taxes: 92.0%(% for various income ranges: 90.9% for AGIs below $25k , 89.8% for AGIs $25k-50k , 91.8% for AGIs $50k-75k , 92.3% for AGIs $75k-100k , 93.5% for AGIs $100k-200k , 97.1% for AGIs over 200k )
Averages for the 2012 tax year for zip code 28465, filed in 2013:
Average Adjusted Gross Income (AGI) in 2012: $53,815 (Individual Income Tax Returns) Here:
$53,815State:
$54,937
Salary/wage: $41,828 (reported on 69.0% of returns )Here:
$41,828State:
$46,336
(% of AGI for various income ranges: 61.0% for AGIs below $25k , 57.0% for AGIs $25k-50k , 46.9% for AGIs $50k-75k , 50.8% for AGIs $75k-100k , 57.4% for AGIs $100k-200k , 48.3% for AGIs over 200k ) Taxable interest for individuals: $1,239 (reported on 45.6% of returns )This zip code:
$1,239North Carolina:
$1,298
(% of AGI for various income ranges: 1.8% for AGIs below $25k , 1.3% for AGIs $25k-50k , 1.0% for AGIs $50k-75k , 1.0% for AGIs $75k-100k , 0.9% for AGIs $100k-200k , 0.9% for AGIs over 200k ) Ordinary dividends: $5,647 (reported on 29.2% of returns )(% of AGI for various income ranges: 2.8% for AGIs below $25k , 2.2% for AGIs $25k-50k , 2.5% for AGIs $50k-75k , 2.6% for AGIs $75k-100k , 2.4% for AGIs $100k-200k , 6.3% for AGIs over 200k ) Net capital gain/loss in AGI: +$4,138 (reported on 24.0% of returns )Here:
+$4,138State:
+$12,740
(% of AGI for various income ranges: 0.4% for AGIs $25k-50k , 1.1% for AGIs $50k-75k , 1.4% for AGIs $75k-100k , 1.8% for AGIs $100k-200k , 6.0% for AGIs over 200k ) Profit/loss from business: +$10,508 (reported on 18.8% of returns )Here:
+$10,508State:
+$10,311
(% of AGI for various income ranges: 9.3% for AGIs below $25k , 4.2% for AGIs $25k-50k , 3.2% for AGIs $50k-75k , 2.8% for AGIs $75k-100k , 3.0% for AGIs $100k-200k , 2.6% for AGIs over 200k ) Taxable individual retirement arrangement distribution: $17,516 (reported on 20.4% of returns )28465:
$17,516North Carolina:
$15,575
(% of AGI for various income ranges: 6.0% for AGIs below $25k , 6.8% for AGIs $25k-50k , 7.5% for AGIs $50k-75k , 7.4% for AGIs $75k-100k , 6.9% for AGIs $100k-200k , 4.7% for AGIs over 200k ) Total itemized deductions: $21,721 (25% of AGI, reported on 41.9% of returns )Here:
$21,721State:
$23,438
Here:
24.8% of AGIState:
21.5% of AGI
(% of AGI for various income ranges: 21.2% for AGIs below $25k , 16.7% for AGIs $25k-50k , 16.8% for AGIs $50k-75k , 19.1% for AGIs $75k-100k , 16.3% for AGIs $100k-200k , 13.6% for AGIs over 200k ) Charity contributions: $3,092 (reported on 35.3% of returns )(% of AGI for various income ranges: 1.4% for AGIs below $25k , 1.8% for AGIs $25k-50k , 2.3% for AGIs $50k-75k , 2.2% for AGIs $75k-100k , 2.2% for AGIs $100k-200k , 1.7% for AGIs over 200k ) Taxes paid: $7,701 (reported on 41.6% of returns )(% of AGI for various income ranges: 4.0% for AGIs below $25k , 3.9% for AGIs $25k-50k , 4.9% for AGIs $50k-75k , 6.3% for AGIs $75k-100k , 7.1% for AGIs $100k-200k , 7.7% for AGIs over 200k ) Earned income credit: $1,906 (reported on 14.9% of returns )(% of AGI for various income ranges: 4.7% for AGIs below $25k , 0.7% for AGIs $25k-50k ) Percentage of individuals using paid preparers for their 2012 taxes: 53.5%(% for various income ranges: 46.2% for AGIs below $25k , 52.7% for AGIs $25k-50k , 56.8% for AGIs $50k-75k , 65.6% for AGIs $75k-100k , 61.5% for AGIs $100k-200k , 75.0% for AGIs over 200k )
Averages for the 2004 tax year for zip code 28465, filed in 2005:
Average Adjusted Gross Income (AGI) in 2004: $47,752 (Individual Income Tax Returns) Here:
$47,752State:
$45,376
Salary/wage: $36,078 (reported on 70.8% of returns )Here:
$36,078State:
$39,442
(% of AGI for various income ranges: 82.4% for AGIs below $10k , 57.8% for AGIs $10k-25k , 57.6% for AGIs $25k-50k , 57.9% for AGIs $50k-75k , 60.5% for AGIs $75k-100k , 45.1% for AGIs over 100k ) Taxable interest for individuals: $1,655 (reported on 54.7% of returns )This zip code:
$1,655North Carolina:
$1,515
(% of AGI for various income ranges: 6.1% for AGIs below $10k , 3.1% for AGIs $10k-25k , 1.7% for AGIs $25k-50k , 1.9% for AGIs $50k-75k , 1.2% for AGIs $75k-100k , 1.7% for AGIs over 100k ) Taxable dividends: $4,243 (reported on 33.4% of returns )(% of AGI for various income ranges: 4.3% for AGIs below $10k , 2.4% for AGIs $10k-25k , 2.6% for AGIs $25k-50k , 1.9% for AGIs $50k-75k , 1.3% for AGIs $75k-100k , 4.3% for AGIs over 100k ) Net capital gain/loss: +$14,149 (reported on 28.6% of returns )Here:
+$14,149State:
+$11,152
(% of AGI for various income ranges: -0.1% for AGIs below $10k , 0.6% for AGIs $10k-25k , 1.3% for AGIs $25k-50k , 2.3% for AGIs $50k-75k , 3.3% for AGIs $75k-100k , 18.6% for AGIs over 100k ) Profit/loss from business: +$13,613 (reported on 21.6% of returns )Here:
+$13,613State:
+$9,490
(% of AGI for various income ranges: 7.0% for AGIs below $10k , 9.8% for AGIs $10k-25k , 5.8% for AGIs $25k-50k , 2.1% for AGIs $50k-75k , 3.9% for AGIs $75k-100k , 8.1% for AGIs over 100k ) IRA payment deduction: $3,425 (reported on 3.3% of returns )28465:
$3,425North Carolina:
$2,967
(% of AGI for various income ranges: 0.2% for AGIs $10k-25k , 0.4% for AGIs $25k-50k , 0.3% for AGIs $50k-75k , 0.2% for AGIs $75k-100k , 0.2% for AGIs over 100k ) Self-employed pension: $17,724 (reported on 0.9% of returns )Here:
$17,724North Carolina:
$14,754
Total itemized deductions: $17,959 (23% of AGI, reported on 44.4% of returns )Here:
$17,959State:
$19,464
Here:
23.3% of AGIState:
22.7% of AGI
(% of AGI for various income ranges: 28.3% for AGIs below $10k , 19.5% for AGIs $10k-25k , 18.3% for AGIs $25k-50k , 18.6% for AGIs $50k-75k , 18.6% for AGIs $75k-100k , 13.3% for AGIs over 100k ) Charity contributions deductions: $2,792 (3% of AGI, reported on 38.7% of returns )Here:
3.5% of AGIState:
4.5% of AGI
(% of AGI for various income ranges: 1.1% for AGIs below $10k , 2.0% for AGIs $10k-25k , 2.1% for AGIs $25k-50k , 2.5% for AGIs $50k-75k , 2.9% for AGIs $75k-100k , 2.1% for AGIs over 100k ) Total tax: $7,215 (reported on 78.7% of returns )(% of AGI for various income ranges: 3.8% for AGIs below $10k , 4.4% for AGIs $10k-25k , 7.1% for AGIs $25k-50k , 9.1% for AGIs $50k-75k , 11.0% for AGIs $75k-100k , 17.8% for AGIs over 100k ) Earned income credit: $1,544 (reported on 12.1% of returns )Percentage of individuals using paid preparers for their 2004 taxes: 61.2%(% for various income ranges: 52.3% for AGIs below $10k , 63.9% for AGIs $10k-25k , 60.6% for AGIs $25k-50k , 65.0% for AGIs $50k-75k , 58.7% for AGIs $75k-100k , 68.4% for AGIs over 100k )
Estimated median household income in 2022: This zip code:
$88,133North Carolina:
$67,481
Nearest zip codes: 28461 ,
28422 ,
28449 ,
28479 ,
28462 ,
28428 .
Oak Island Zip Code Map
Percentage of family households: This zip code:
33.5%North Carolina:
46.1%
Percentage of households with unmarried partners: This zip code:
7.4%North Carolina:
47.9%
Likely homosexual households (counted as self-reported same-sex unmarried-partner households)
Lesbian couples: 0.2% of all households Gay men: 0.0% of all households
Household received Food Stamps/SNAP in the past 12 months: 172Household did not receive Food Stamps/SNAP in the past 12 months: 3,830
Women who had a birth in the past 12 months: 66 (9 now married , 54 unmarried) Women who did not have a birth in the past 12 months: 919 (514 now married , 407 unmarried)
Housing units in zip code 28465 with a mortgage: 2,159 (211
second mortgage , 200
both second mortgage and home equity loan )
Houses without a mortgage: 152
Median monthly owner costs for units with a mortgage: $1,823
Median monthly owner costs for units without a mortgage: $722
Residents with income below the poverty level in 2022:
This zip code:
8.6%Whole state:
12.8%
Residents with income below 50% of the poverty level in 2022:
This zip code:
4.0%Whole state:
6.8%
Median number of rooms in houses and condos: Median number of rooms in apartments: Notable locations in this zip code not listed on our city pages
Click to draw/clear zip code borders Notable locations in zip code 28465: (A) , Oak Island Police Department (B) , Yaupon Police Department (C) , Caswell Beach Police Department (D) . Display/hide their locations on the map
Rivers and creeks: (A) , Dutchman Creek (B) , Doshers Creek (C) , Coward Creek (D) , Boathouse Creek (E) , Smokehouse Creek (F) , Piney Point Creek (G) , Molasses Creek (H) , Lockwoods Folly River (I) . Display/hide their locations on the map
Park in zip code 28465: (1) . Display/hide its location on the map
Beach: (A) . Display/hide its location on the map
Year house built (houses)
142 2020 or later1,953 2010 to 20192,144 2000 to 20091,722 1990 to 19992,451 1980 to 19891,117 1970 to 1979476 1960 to 1969165 1950 to 195920 1940 to 19497 1939 or earlier
Zip code 28465 household income distribution in 2022 250 Less than $10,000143 $10,000 to $14,99940 $15,000 to $19,999118 $20,000 to $24,999105 $25,000 to $29,999117 $30,000 to $34,99988 $35,000 to $39,999136 $40,000 to $44,99970 $45,000 to $49,999269 $50,000 to $59,999358 $60,000 to $74,999559 $75,000 to $99,999454 $100,000 to $124,999281 $125,000 to $149,999476 $150,000 to $199,999602 $200,000 or moreEstimate of home value of owner-occupied houses/condos in 2022 in zip code 28465 31 Less than $10,0005 $20,000 to $24,99920 $25,000 to $29,99933 $40,000 to $49,9996 $50,000 to $59,9999 $80,000 to $89,99955 $125,000 to $149,999103 $150,000 to $174,99978 $175,000 to $199,999333 $200,000 to $249,999425 $250,000 to $299,999755 $300,000 to $399,999593 $400,000 to $499,999932 $500,000 to $749,999553 $750,000 to $999,99982 $1,000,000 to $1,499,99947 $1,500,000 to $1,999,99944 $2,000,000 or moreRent paid by renters in 2022 in zip code 28465 19 $500 to $54940 $550 to $5995 $600 to $64951 $650 to $69914 $700 to $7497 $750 to $79916 $800 to $89952 $900 to $999143 $1,000 to $1,24916 $1,250 to $1,49923 $1,500 to $1,99963 $2,000 to $2,4992 $3,500 or more69 No cash rent
Median gross rent in 2022: $1,306.
Median price asked for vacant for-sale houses and condos in 2022: $410,259.
Estimated median house (or condo) value in 2022 for: White Non-Hispanic householders: $463,607Black or African American householders: $511,195American Indian or Alaska Native householders: $102,239Asian householders: $641,317Two or more races householders: $845,795Hispanic or Latino householders: $241,655Estimated median house or condo value in 2022: $456,916
28465:
$456,916North Carolina:
$280,600
Lower value quartile - upper value quartile: $304,160 - $709,049
Mean price in 2022: Detached houses: $515,491Here:
$515,491State:
$375,326
Townhouses or other attached units: $427,895Here:
$427,895State:
$317,935
In 3-to-4-unit structures: $443,487Here:
$443,487State:
$254,939
In 5-or-more-unit structures: $632,439Here:
$632,439State:
$329,290
Mobile homes: $238,750Here:
$238,750State:
$124,933
Housing units in structures:
One, detached: 8,623One, attached: 143Two: 1003 or 4: 845 to 9: 15810 to 19: 25320 to 49: 21650 or more: 65Mobile homes: 648Unemployment : 2.6%
Means of transportation to work in zip code 28465 67.9% 2,523 Drove a car alone2.2% 81 Carpooled1.4% 51 Ferryboat0.2% 6 Motorcycle0.7% 27 Bicycle0.9% 34 Walked0.8% 31 Other means29.8% 1,108 Worked at homeTravel time to work (commute) in zip code 28465 135 Less than 5 minutes326 5 to 9 minutes372 10 to 14 minutes517 15 to 19 minutes447 20 to 24 minutes273 25 to 29 minutes124 30 to 34 minutes9 35 to 39 minutes120 40 to 44 minutes226 45 to 59 minutes42 60 to 89 minutes153 90 or more minutes
Percentage of zip code residents living and working in this county: 83.6%
Household type by relationship:
Households: 8,407
Male householders: 2,001 (381 living alone ), Female householders: 2,036 (694 living alone )2,415 spouses (2,390 opposite-sex spouses ), 270 unmarried partners , (238 opposite-sex unmarried partners ), 1,084 children (1,041 natural , 17 adopted , 25 stepchildren ), 253 grandchildren , 26 brothers or sisters , 99 parents , 0 foster children , 114 other relatives , 202 non-relatives In group quarters: 4 (-1 institutionalized population )
Size of family households: 2,065 2-persons , 376 3-persons , 170 4-persons , 104 5-persons , 4 6-persons , 10 7-or-more-persons
Size of nonfamily households: 1,074 1-person , 257 2-persons
346 married couples with children. single-parent households (75 men , 76 women ).
98.8% of residents of 28465 zip code speak English at home. of residents speak Spanish at home (51% very well, 33% well, 16% not at all ).of residents speak other Indo-European language at home (100% very well ).of residents speak Asian or Pacific Island language at home (7% very well, 93% well ).
Foreign born population: 174 (2.1%)
(80.7%
of them are naturalized citizens )
This zip code:
2.1%Whole state:
8.6%
17% Ecuador 16% Singapore 15% Peru 8% Sweden 8% England 8% Thailand 6% France 20% German 19% English 16% Irish 11% American 6% Italian 3% European 3% Scotch-Irish
Year of entry for the foreign-born population
88 2010 or later 48 2000 to 2009 28 1990 to 1999 130 Before 1990
Housing units lacking complete plumbing facilities: 0.6%
Housing units lacking complete kitchen facilities: 0.7%
89.6% Electricity 5.7% Bottled, tank, or LP gas 2.7% Utility gas 1.7% Fuel oil, kerosene, etc.
Population in 1990: 4,752. Population change in the 1990s: +2,030 (+42.7%).
Place of birth for U.S.-born residents:
This state: 3,422Northeast: 1,664Midwest: 1,000South: 1,723West: 344
44% of the 28465 zip code residents lived in the same house 5 years ago.
Out of people who lived in different houses, 28% lived in this county.
Out of people who lived in different counties, 50% lived in North Carolina.
88% of the 28465 zip code residents lived in the same house 1 year ago.
Out of people who lived in different houses, 11% moved from this county.
Out of people who lived in different houses, 64% moved from different county within same state.
Out of people who lived in different houses, 31% moved from different state.
Private vs. public school enrollment:
Students in private schools in grades 1 to 8 (elementary and middle school): 150
Here:
34.2%North Carolina:
13.8%
Students in private schools in grades 9 to 12 (high school): 114
Here:
52.8%North Carolina:
11.9%
Students in private undergraduate colleges: 20
Here:
15.8%North Carolina:
19.3%
Occupation by median earnings in the past 12 months ($)
115,554 Management occupations 113,729 Computer and mathematical occupations 94,385 Installation, maintenance, and repair occupations 72,552 Health diagnosing and treating practitioners and other technical occupations 68,481 Business and financial operations occupations 68,372 Health technologists and technicians
Companies with federal contracts located in this zip code (OAK ISLAND, NC):
MARGARET RUDD & ASSOCIATES (210 COUNTRY CLUB DR; small business) in 8 contracts from 2001 to 2006
Contracts for Lease or Rental of Facilities -- Family Housing Facilities, Lodging - Hotel/Motel by Air Force, NavySigned by year: 2000: $0; 2001: $152,928; 2002: $338,629; 2003: $514,621; 2004: $0; 2005: -$177,316; 2006: -$38,589.
Biggest contracts: with Air Force for Lease or Rental of Facilities -- Family Housing Facilities. Signed on 2003-06-04. Completion date: 2003-10-31.
with Navy for Lodging - Hotel/Motel. Signed on 2002-05-17. Completion date: 2002-10-31.
with Air Force for Lease or Rental of Facilities -- Family Housing Facilities. Signed on 2003-08-26. Completion date: 2003-12-31.
with Navy for Lodging - Hotel/Motel. Taking place in IA. Signed on 2001-01-08. Completion date: 2001-03-15.
CAROLINA MAP INC (300 COUNTRY CLUB DRIVE; small business)
$308,610 with Army for Other Housekeeping Services. Signed on 2000-10-12. Completion date: 2001-07-14.
THE SOUTHWINDS INC (700 OCEAN DRIVE; small business) in 11 contracts from 2003 to 2004
Contracts for Lodging - Hotel/Motel by ArmySigned by year: 2000: $0; 2001: $0; 2002: $0; 2003: $4,640; 2004: $48,741; 2005: $0; 2006: $0.
Biggest contracts: with Army for Lodging - Hotel/Motel. Signed on 2004-03-11. Completion date: 2004-06-30.
, same as above. Signed on 2004-02-05. Completion date: 2004-06-03.
, same as above. Signed on 2004-01-21. Completion date: 2004-04-10.
, same as above. Signed on 2004-02-18. Completion date: 2004-05-07.
KELLETT SERVICES (5414 EAST OAK ISLAND DR; small business)
$4,600 with Army for Insect and Rodent Control Services. Signed on 2001-11-13. Completion date: 2001-11-13.
Top industries in this zip code by the number of employees in 2005:
Accommodation and Food Services: Full-Service Restaurants (20-49 employees: 1 establishment, 10-19 employees: 6 establishments, 5-9 employees: 2 establishments, 1-4 employees: 7 establishments)Construction: Plumbing, Heating, and Air-Conditioning Contractors (20-49: 3, 10-19: 1, 5-9: 1, 1-4: 1)Construction: New Single-Family Housing Construction (except Operative Builders) (10-19: 2, 5-9: 3, 1-4: 10)Accommodation and Food Services: Hotels (except Casino Hotels) and Motels (20-49: 1, 5-9: 3, 1-4: 2)Real Estate and Rental and Leasing: Offices of Real Estate Agents and Brokers (5-9: 2, 1-4: 21)Real Estate and Rental and Leasing: Nonresidential Property Managers (20-49: 1, 1-4: 1)Arts, Entertainment, and Recreation: Golf Courses and Country Clubs (20-49: 1)Other Services (except Public Administration): Religious Organizations (10-19: 1, 5-9: 2)Accommodation and Food Services: Limited-Service Restaurants (10-19: 1, 5-9: 1, 1-4: 3)
People in group quarters in 2010:
4 people in military barracks and dormitories (nondisciplinary)
People in group quarters in 2000:
5 people in military barracks, etc.
Fatal accident statistics in 2012:
Fatal accident count: 1Vehicles involved in fatal accidents: 1Fatal accidents caused by drunken drivers: 1Fatalities: 1Persons involved in fatal accidents: 1Pedestrians involved in fatal accidents: 0
Fatal accident statistics in 2011:
Fatal accident count: 1Vehicles involved in fatal accidents: 2Fatal accidents caused by drunken drivers: 0Fatalities: 1Persons involved in fatal accidents: 2Pedestrians involved in fatal accidents: 0
Home Mortgage Disclosure Act Aggregated Statistics For Year 2009(Based on 8 partial tracts) A) FHA, FSA/RHS & VA B) Conventional C) Refinancings D) Home Improvement Loans F) Non-occupant Loans on G) Loans On Manufactured Number Average Value Number Average Value Number Average Value Number Average Value Number Average Value Number Average Value
LOANS ORIGINATED 17 $164,954 287 $196,657 717 $216,070 21 $111,136 637 $207,075 5 $112,710 APPLICATIONS APPROVED, NOT ACCEPTED 0 $0 21 $318,951 60 $221,337 5 $96,480 51 $242,216 0 $0 APPLICATIONS DENIED 9 $158,128 42 $170,174 281 $262,423 9 $72,636 197 $266,202 3 $89,167 APPLICATIONS WITHDRAWN 3 $132,747 48 $178,833 132 $237,283 3 $41,077 92 $232,836 0 $0 FILES CLOSED FOR INCOMPLETENESS 3 $143,267 6 $207,637 53 $210,902 5 $101,288 39 $184,112 0 $0
Aggregated Statistics For Year 2008(Based on 8 partial tracts) A) FHA, FSA/RHS & VA B) Conventional C) Refinancings D) Home Improvement Loans F) Non-occupant Loans on G) Loans On Manufactured Number Average Value Number Average Value Number Average Value Number Average Value Number Average Value Number Average Value
LOANS ORIGINATED 6 $153,537 287 $259,361 415 $214,317 24 $96,805 458 $239,218 5 $55,002 APPLICATIONS APPROVED, NOT ACCEPTED 2 $114,965 33 $233,071 68 $249,421 9 $25,714 62 $254,991 0 $0 APPLICATIONS DENIED 0 $0 72 $281,483 155 $290,913 8 $61,051 119 $284,585 6 $148,527 APPLICATIONS WITHDRAWN 3 $165,810 44 $292,021 92 $270,488 3 $20,037 77 $272,729 0 $0 FILES CLOSED FOR INCOMPLETENESS 0 $0 8 $364,992 39 $262,027 2 $240,450 30 $260,335 0 $0
Aggregated Statistics For Year 2007(Based on 8 partial tracts) A) FHA, FSA/RHS & VA B) Conventional C) Refinancings D) Home Improvement Loans F) Non-occupant Loans on G) Loans On Manufactured Number Average Value Number Average Value Number Average Value Number Average Value Number Average Value Number Average Value
LOANS ORIGINATED 3 $222,413 407 $267,749 514 $272,106 36 $111,374 588 $265,354 8 $86,411 APPLICATIONS APPROVED, NOT ACCEPTED 2 $175,075 48 $289,195 57 $371,772 6 $115,465 56 $353,775 3 $109,203 APPLICATIONS DENIED 0 $0 119 $328,659 182 $296,225 23 $70,109 144 $345,331 5 $91,972 APPLICATIONS WITHDRAWN 0 $0 57 $283,766 108 $365,598 6 $109,453 95 $356,401 0 $0 FILES CLOSED FOR INCOMPLETENESS 0 $0 12 $269,502 29 $236,924 3 $103,693 21 $268,715 0 $0
Aggregated Statistics For Year 2006(Based on 8 partial tracts) A) FHA, FSA/RHS & VA B) Conventional C) Refinancings D) Home Improvement Loans E) Loans on Dwellings For 5+ Families F) Non-occupant Loans on G) Loans On Manufactured Number Average Value Number Average Value Number Average Value Number Average Value Number Average Value Number Average Value Number Average Value
LOANS ORIGINATED 0 $0 571 $272,465 651 $282,561 44 $137,984 3 $220,410 783 $284,231 2 $20,290 APPLICATIONS APPROVED, NOT ACCEPTED 0 $0 56 $237,791 56 $346,959 9 $54,268 0 $0 68 $318,837 3 $86,660 APPLICATIONS DENIED 2 $131,495 74 $300,641 147 $359,282 20 $160,574 0 $0 117 $344,925 8 $80,588 APPLICATIONS WITHDRAWN 0 $0 56 $305,900 78 $248,251 6 $103,943 0 $0 66 $258,413 2 $77,395 FILES CLOSED FOR INCOMPLETENESS 0 $0 14 $395,129 21 $249,751 2 $214,150 0 $0 14 $258,374 0 $0
Aggregated Statistics For Year 2005(Based on 8 partial tracts) A) FHA, FSA/RHS & VA B) Conventional C) Refinancings D) Home Improvement Loans F) Non-occupant Loans on G) Loans On Manufactured Number Average Value Number Average Value Number Average Value Number Average Value Number Average Value Number Average Value
LOANS ORIGINATED 2 $114,965 1,091 $261,454 685 $219,053 63 $165,833 1,202 $260,521 5 $109,404 APPLICATIONS APPROVED, NOT ACCEPTED 0 $0 89 $231,701 66 $189,694 2 $59,360 105 $234,995 3 $50,093 APPLICATIONS DENIED 0 $0 177 $301,367 144 $253,055 20 $126,761 182 $352,299 20 $79,423 APPLICATIONS WITHDRAWN 2 $172,820 110 $308,347 110 $198,629 9 $267,999 119 $288,714 3 $75,640 FILES CLOSED FOR INCOMPLETENESS 0 $0 30 $240,047 44 $213,193 3 $40,073 30 $218,257 0 $0
Aggregated Statistics For Year 2004(Based on 8 partial tracts) A) FHA, FSA/RHS & VA B) Conventional C) Refinancings D) Home Improvement Loans E) Loans on Dwellings For 5+ Families F) Non-occupant Loans on G) Loans On Manufactured Number Average Value Number Average Value Number Average Value Number Average Value Number Average Value Number Average Value Number Average Value
LOANS ORIGINATED 3 $124,230 917 $193,687 673 $163,423 59 $95,007 3 $430,803 989 $195,408 9 $83,489 APPLICATIONS APPROVED, NOT ACCEPTED 3 $159,797 71 $209,694 44 $163,464 6 $7,513 0 $0 56 $237,684 2 $53,350 APPLICATIONS DENIED 0 $0 107 $200,027 87 $145,029 21 $88,308 0 $0 81 $212,062 9 $67,793 APPLICATIONS WITHDRAWN 0 $0 68 $211,652 108 $142,627 9 $51,096 0 $0 83 $209,849 0 $0 FILES CLOSED FOR INCOMPLETENESS 0 $0 20 $233,686 20 $140,587 6 $154,788 0 $0 20 $162,904 0 $0
Aggregated Statistics For Year 2003(Based on 8 partial tracts) A) FHA, FSA/RHS & VA B) Conventional C) Refinancings D) Home Improvement Loans F) Non-occupant Loans on Number Average Value Number Average Value Number Average Value Number Average Value Number Average Value
LOANS ORIGINATED 24 $107,951 914 $152,279 1,214 $135,200 11 $68,035 1,207 $150,673 APPLICATIONS APPROVED, NOT ACCEPTED 0 $0 56 $151,676 86 $128,454 3 $3,007 56 $141,746 APPLICATIONS DENIED 6 $113,712 72 $176,892 171 $137,950 12 $31,433 92 $174,668 APPLICATIONS WITHDRAWN 2 $76,645 62 $183,657 98 $118,031 2 $48,840 59 $161,666 FILES CLOSED FOR INCOMPLETENESS 0 $0 12 $185,847 26 $123,808 0 $0 14 $142,444
Aggregated Statistics For Year 2002(Based on 8 partial tracts) A) FHA, FSA/RHS & VA B) Conventional C) Refinancings D) Home Improvement Loans F) Non-occupant Loans on Number Average Value Number Average Value Number Average Value Number Average Value Number Average Value
LOANS ORIGINATED 23 $99,773 576 $137,879 784 $130,719 17 $31,028 711 $137,695 APPLICATIONS APPROVED, NOT ACCEPTED 0 $0 33 $121,636 60 $109,830 0 $0 42 $135,753 APPLICATIONS DENIED 0 $0 38 $98,038 95 $101,542 8 $34,001 32 $93,455 APPLICATIONS WITHDRAWN 0 $0 41 $180,043 89 $115,429 5 $17,734 54 $165,364 FILES CLOSED FOR INCOMPLETENESS 2 $68,375 14 $221,770 32 $112,287 0 $0 18 $178,583
Aggregated Statistics For Year 2001(Based on 8 partial tracts) A) FHA, FSA/RHS & VA B) Conventional C) Refinancings D) Home Improvement Loans F) Non-occupant Loans on Number Average Value Number Average Value Number Average Value Number Average Value Number Average Value
LOANS ORIGINATED 20 $107,826 473 $128,180 592 $116,101 18 $13,859 497 $127,224 APPLICATIONS APPROVED, NOT ACCEPTED 0 $0 26 $86,064 35 $128,253 2 $81,150 21 $157,794 APPLICATIONS DENIED 2 $69,880 35 $81,667 95 $98,378 6 $11,522 27 $135,976 APPLICATIONS WITHDRAWN 2 $69,880 42 $118,506 99 $109,932 0 $0 39 $118,297 FILES CLOSED FOR INCOMPLETENESS 0 $0 12 $156,792 30 $101,740 2 $15,030 17 $105,108
Aggregated Statistics For Year 2000(Based on 8 partial tracts) A) FHA, FSA/RHS & VA B) Conventional C) Refinancings D) Home Improvement Loans F) Non-occupant Loans on Number Average Value Number Average Value Number Average Value Number Average Value Number Average Value
LOANS ORIGINATED 20 $93,700 425 $114,255 128 $113,591 18 $22,709 252 $116,568 APPLICATIONS APPROVED, NOT ACCEPTED 3 $84,657 45 $96,747 21 $76,142 3 $14,527 17 $94,323 APPLICATIONS DENIED 5 $62,216 93 $82,799 54 $81,457 6 $16,280 20 $77,544 APPLICATIONS WITHDRAWN 5 $56,204 36 $109,203 45 $65,856 2 $45,085 17 $103,163 FILES CLOSED FOR INCOMPLETENESS 0 $0 18 $142,766 17 $84,334 0 $0 15 $159,597
Aggregated Statistics For Year 1999(Based on 4 partial tracts) A) FHA, FSA/RHS & VA B) Conventional C) Refinancings D) Home Improvement Loans E) Loans on Dwellings For 5+ Families F) Non-occupant Loans on Number Average Value Number Average Value Number Average Value Number Average Value Number Average Value Number Average Value
LOANS ORIGINATED 11 $101,005 234 $110,051 146 $94,489 6 $28,713 1 $334,020 172 $108,264 APPLICATIONS APPROVED, NOT ACCEPTED 0 $0 22 $89,914 31 $70,637 1 $43,600 0 $0 15 $87,103 APPLICATIONS DENIED 1 $111,110 41 $95,361 32 $100,140 5 $5,766 0 $0 12 $111,047 APPLICATIONS WITHDRAWN 1 $148,380 23 $129,175 30 $74,633 1 $47,820 0 $0 11 $117,882 FILES CLOSED FOR INCOMPLETENESS 0 $0 6 $163,142 11 $90,713 0 $0 0 $0 6 $122,473
Detailed HMDA statistics for the following Tracts:
0203.02
Private Mortgage Insurance Companies Aggregated Statistics For Year 2009(Based on 8 partial tracts) A) Conventional B) Refinancings C) Non-occupant Loans on Number Average Value Number Average Value Number Average Value
LOANS ORIGINATED 12 $204,130 9 $198,870 15 $198,269 APPLICATIONS APPROVED, NOT ACCEPTED 14 $197,618 3 $234,937 12 $205,258 APPLICATIONS DENIED 5 $233,234 3 $223,417 2 $108,200 APPLICATIONS WITHDRAWN 2 $118,720 2 $102,190 2 $118,720 FILES CLOSED FOR INCOMPLETENESS 2 $228,425 0 $0 2 $228,425
Aggregated Statistics For Year 2008(Based on 8 partial tracts) A) Conventional B) Refinancings C) Non-occupant Loans on Number Average Value Number Average Value Number Average Value
LOANS ORIGINATED 51 $258,305 14 $252,041 47 $237,730 APPLICATIONS APPROVED, NOT ACCEPTED 21 $316,518 9 $277,017 21 $294,763 APPLICATIONS DENIED 14 $334,588 8 $203,066 12 $238,945 APPLICATIONS WITHDRAWN 5 $285,532 0 $0 3 $286,033 FILES CLOSED FOR INCOMPLETENESS 5 $215,502 2 $169,815 3 $257,480
Aggregated Statistics For Year 2007(Based on 8 partial tracts) A) Conventional B) Refinancings C) Non-occupant Loans on Number Average Value Number Average Value Number Average Value
LOANS ORIGINATED 68 $253,111 12 $311,080 53 $250,429 APPLICATIONS APPROVED, NOT ACCEPTED 5 $228,426 6 $368,687 5 $362,476 APPLICATIONS DENIED 3 $405,757 3 $337,630 6 $371,693 APPLICATIONS WITHDRAWN 3 $338,630 0 $0 3 $338,630 FILES CLOSED FOR INCOMPLETENESS 3 $390,227 0 $0 3 $390,227
Aggregated Statistics For Year 2006(Based on 8 partial tracts) A) Conventional B) Refinancings C) Non-occupant Loans on Number Average Value Number Average Value Number Average Value
LOANS ORIGINATED 41 $264,420 8 $302,439 39 $276,207 APPLICATIONS APPROVED, NOT ACCEPTED 9 $353,659 0 $0 9 $353,659 APPLICATIONS DENIED 2 $169,065 0 $0 2 $169,065 APPLICATIONS WITHDRAWN 5 $285,532 0 $0 2 $146,525 FILES CLOSED FOR INCOMPLETENESS 0 $0 0 $0 0 $0
Aggregated Statistics For Year 2005(Based on 8 partial tracts) A) Conventional B) Refinancings C) Non-occupant Loans on Number Average Value Number Average Value Number Average Value
LOANS ORIGINATED 81 $217,925 9 $193,027 62 $229,565 APPLICATIONS APPROVED, NOT ACCEPTED 14 $247,425 3 $304,067 11 $246,323 APPLICATIONS DENIED 5 $239,846 0 $0 5 $239,846 APPLICATIONS WITHDRAWN 3 $181,840 2 $48,090 2 $142,765 FILES CLOSED FOR INCOMPLETENESS 2 $141,265 2 $163,805 3 $203,380
Aggregated Statistics For Year 2004(Based on 8 partial tracts) A) Conventional B) Refinancings C) Non-occupant Loans on D) Loans On Manufactured Number Average Value Number Average Value Number Average Value Number Average Value
LOANS ORIGINATED 101 $155,279 20 $148,852 71 $153,836 2 $71,385 APPLICATIONS APPROVED, NOT ACCEPTED 14 $134,608 20 $152,384 18 $148,527 0 $0 APPLICATIONS DENIED 3 $115,717 0 $0 3 $115,717 0 $0 APPLICATIONS WITHDRAWN 12 $189,603 0 $0 8 $193,861 0 $0 FILES CLOSED FOR INCOMPLETENESS 0 $0 0 $0 0 $0 0 $0
Aggregated Statistics For Year 2003(Based on 8 partial tracts) A) Conventional B) Refinancings C) Non-occupant Loans on Number Average Value Number Average Value Number Average Value
LOANS ORIGINATED 173 $166,611 66 $119,905 152 $156,133 APPLICATIONS APPROVED, NOT ACCEPTED 32 $150,891 23 $174,782 35 $164,879 APPLICATIONS DENIED 2 $93,175 0 $0 2 $93,175 APPLICATIONS WITHDRAWN 5 $110,306 11 $126,098 11 $107,655 FILES CLOSED FOR INCOMPLETENESS 0 $0 0 $0 0 $0
Aggregated Statistics For Year 2002(Based on 8 partial tracts) A) Conventional B) Refinancings C) Non-occupant Loans on Number Average Value Number Average Value Number Average Value
LOANS ORIGINATED 153 $130,881 44 $136,857 113 $129,400 APPLICATIONS APPROVED, NOT ACCEPTED 18 $131,912 8 $117,030 12 $111,458 APPLICATIONS DENIED 2 $74,390 2 $93,925 2 $74,390 APPLICATIONS WITHDRAWN 5 $147,274 2 $81,905 3 $175,327 FILES CLOSED FOR INCOMPLETENESS 0 $0 2 $105,195 0 $0
Aggregated Statistics For Year 2001(Based on 8 partial tracts) A) Conventional B) Refinancings C) Non-occupant Loans on Number Average Value Number Average Value Number Average Value
LOANS ORIGINATED 126 $125,865 32 $121,915 81 $124,491 APPLICATIONS APPROVED, NOT ACCEPTED 14 $109,382 9 $151,616 6 $121,977 APPLICATIONS DENIED 2 $315,590 3 $117,720 2 $315,590 APPLICATIONS WITHDRAWN 3 $139,760 0 $0 2 $128,490 FILES CLOSED FOR INCOMPLETENESS 0 $0 0 $0 0 $0
Aggregated Statistics For Year 2000(Based on 8 partial tracts) A) Conventional B) Refinancings C) Non-occupant Loans on Number Average Value Number Average Value Number Average Value
LOANS ORIGINATED 101 $125,134 2 $47,340 59 $137,493 APPLICATIONS APPROVED, NOT ACCEPTED 8 $106,699 0 $0 8 $106,699 APPLICATIONS DENIED 5 $129,842 5 $112,108 3 $173,323 APPLICATIONS WITHDRAWN 3 $116,217 0 $0 2 $99,185 FILES CLOSED FOR INCOMPLETENESS 2 $59,360 0 $0 0 $0
Aggregated Statistics For Year 1999(Based on 4 partial tracts) A) Conventional B) Refinancings C) Non-occupant Loans on Number Average Value Number Average Value Number Average Value
LOANS ORIGINATED 49 $108,609 9 $86,807 23 $103,676 APPLICATIONS APPROVED, NOT ACCEPTED 4 $122,532 0 $0 1 $153,300 APPLICATIONS DENIED 2 $77,350 0 $0 2 $77,350 APPLICATIONS WITHDRAWN 1 $139,940 0 $0 1 $90,010 FILES CLOSED FOR INCOMPLETENESS 1 $94,930 0 $0 0 $0
Detailed PMIC statistics for the following Tracts:
0203.02
2003 - 2018 National Fire Incident Reporting System (NFIRS) incidents See full 2006 National Fire Incident Reporting System statistics for zip code 28465, North Carolina
Most common first names in zip code 28465 among deceased individuals Name Count Lived (average)
William 41 75.1 years Robert 32 70.1 years James 27 71.4 years John 25 74.3 years Mary 24 77.4 years Charles 22 74.8 years Thomas 14 66.6 years Donald 13 72.9 years Richard 11 79.0 years Margaret 11 78.4 years
Most common last names in zip code 28465 among deceased individuals Last name Count Lived (average)
Smith 14 77.4 years Thomas 7 75.3 years Jones 7 72.0 years Miller 7 71.6 years Lewis 6 83.0 years King 5 80.6 years Davis 5 73.8 years Brooks 5 66.0 years Walker 5 70.4 years Williams 5 64.8 years
Businesses in zip code 28465
Dairy Queen: 1FedEx: 1UPS: 3
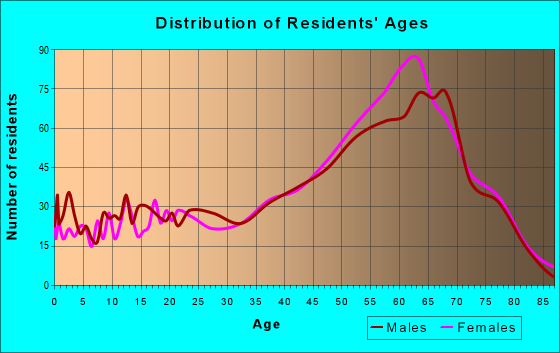


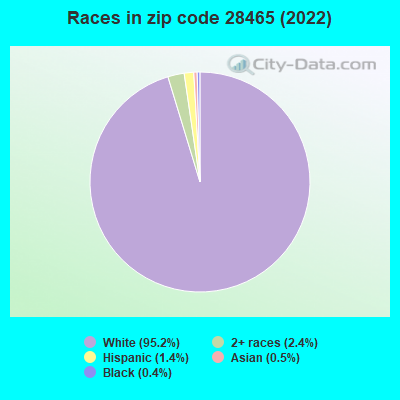


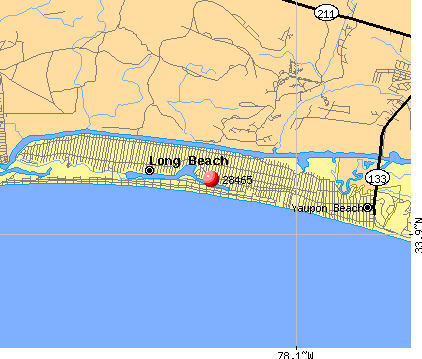 Nearest zip codes: 28461, 28422, 28449, 28479, 28462, 28428.
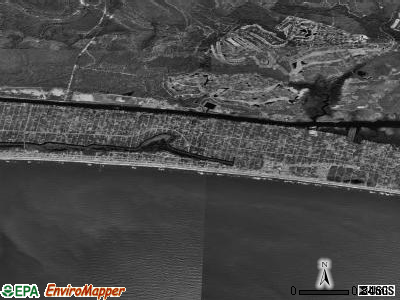
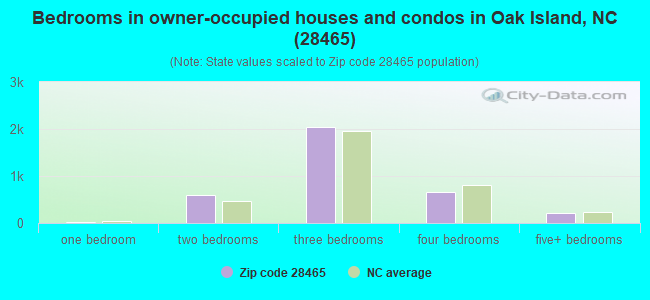
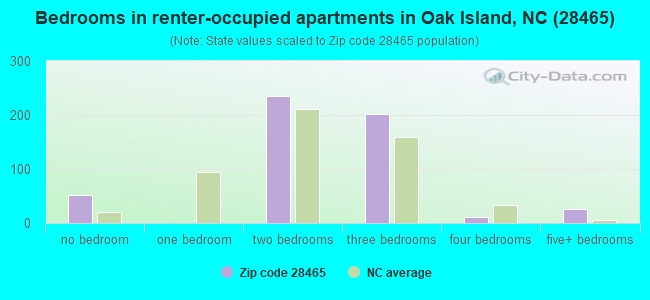
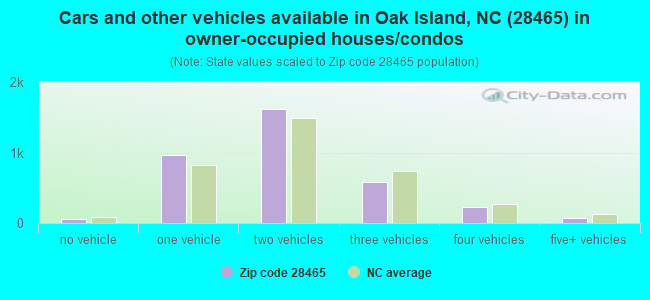
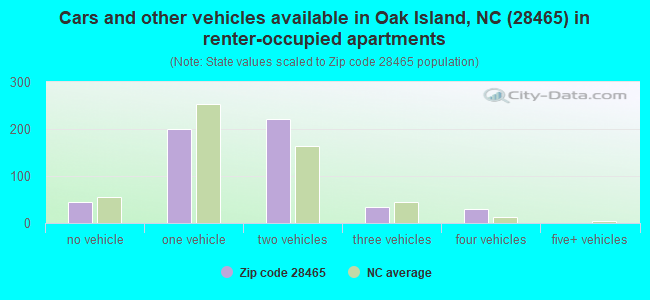


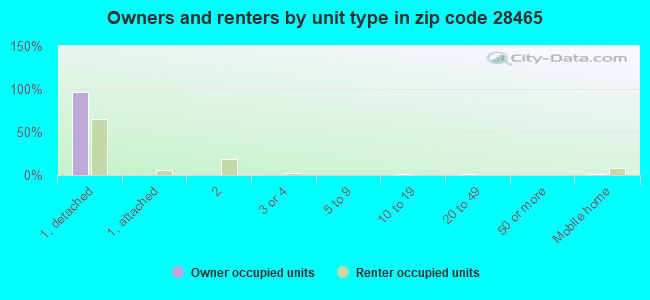


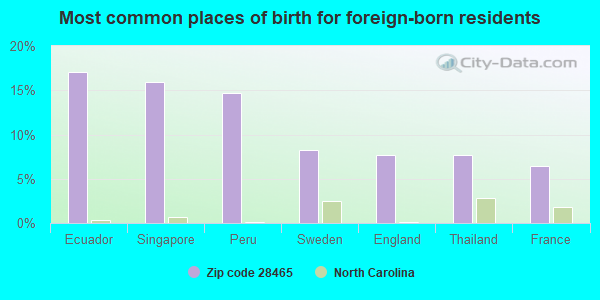
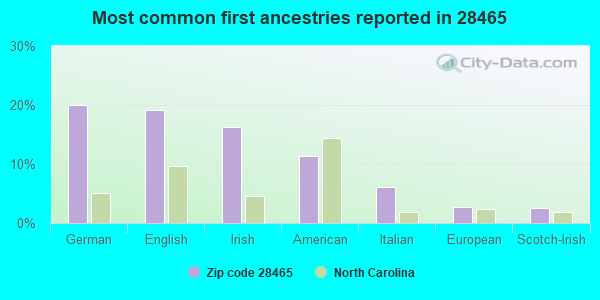
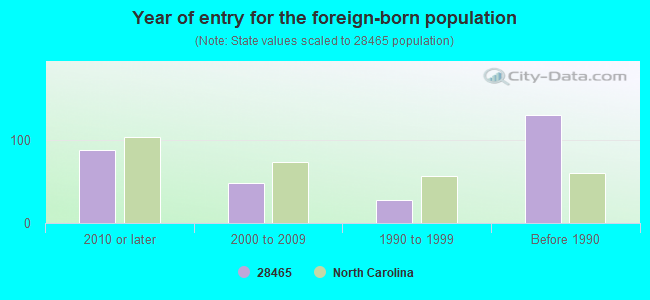
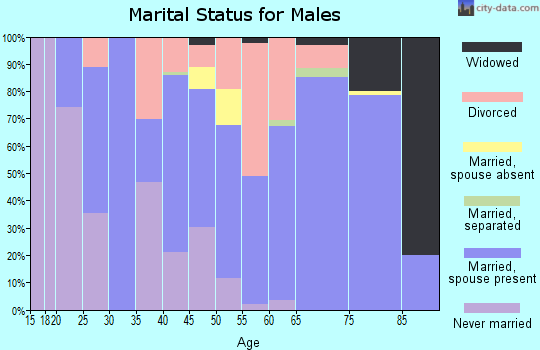

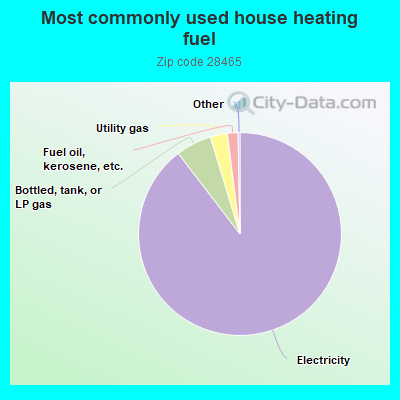
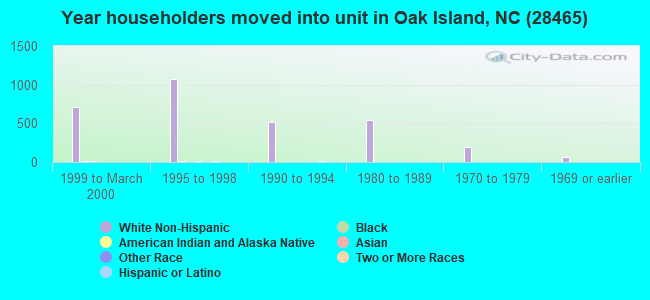
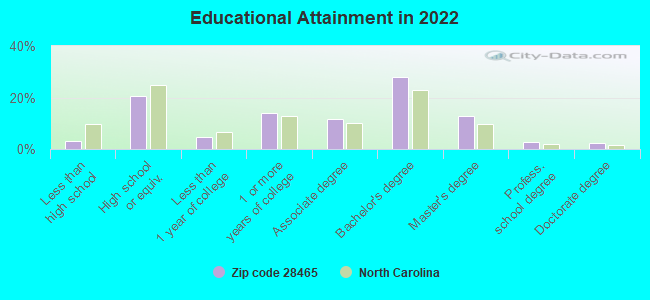
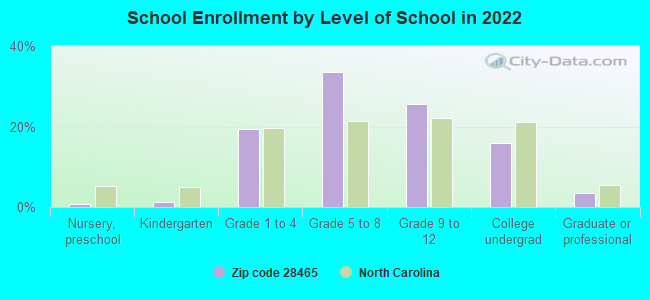
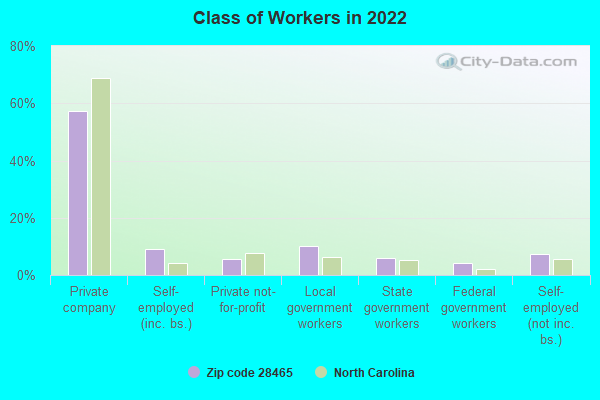
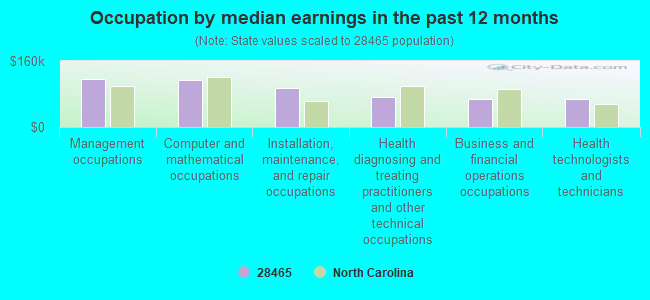
 : $790,273 in 8 contracts from 2001 to 2006

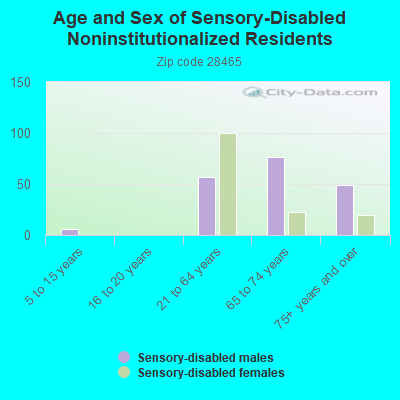
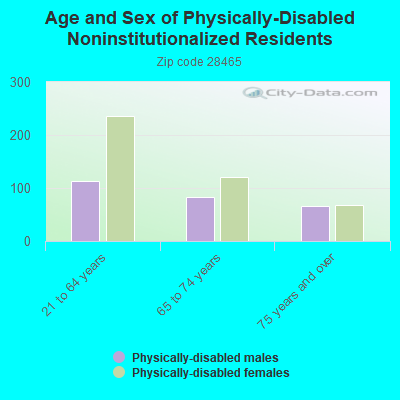
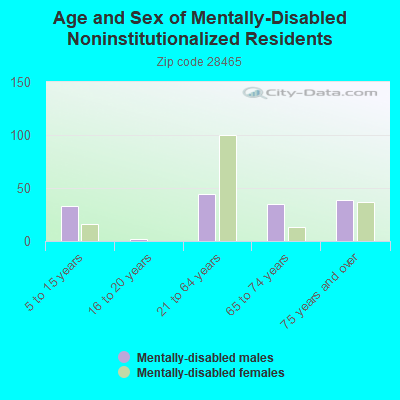
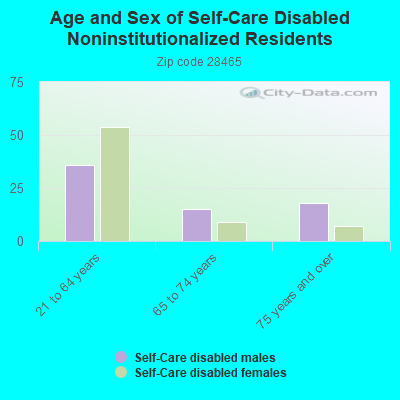
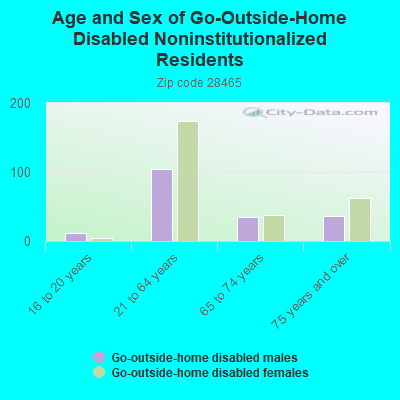

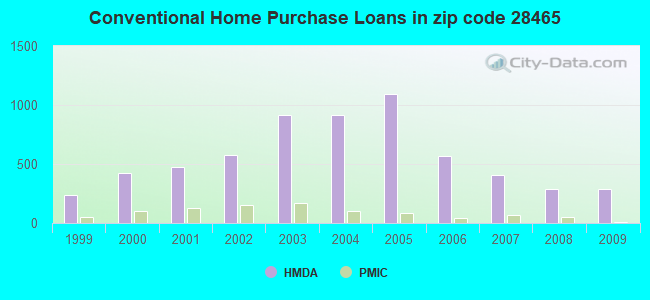
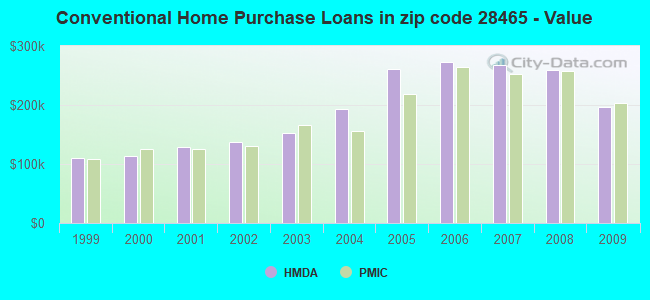
 Based on the data from the years 2003 - 2018 the average number of fire incidents per year is 40. The highest number of fire incidents - 72 took place in 2011, and the least - 4 in 2003. The data has an increasing trend.
 When looking into fire subcategories, the most reports belonged to: Structure Fires (52.9%), and Outside Fires (34.7%).