Estimated zip code population in 2022: 1,046 Zip code population in 2010: 1,487 Zip code population in 2000: 966
Houses and condos: 620 Renter-occupied apartments: 25
% of renters here:
6%
State:
28%
March 2022 cost of living index in zip code 29821: 77.4 (low, U.S. average is 100)
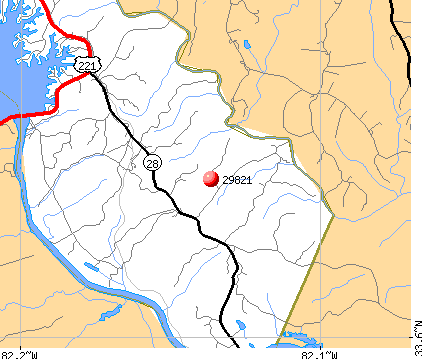
Land area: 62.0 sq. mi. Water area: 5.1 sq. mi.
Population density: 17 people per square mile
(very low).
OSM Map
General Map
Google Map
MSN Map
OSM Map
General Map
Google Map
MSN Map
OSM Map
General Map
Google Map
MSN Map
OSM Map
General Map
Google Map
MSN Map
Please wait while loading the map...
Real estate property taxes paid for housing units in 2022:
This zip code:
0.4% ($860)
South Carolina:
0.5% ($1,185)
Median real estate property taxes paid for housing units with mortgages in 2022: $1,169 (0.3%) Median real estate property taxes paid for housing units with no mortgage in 2022: $597 (0.5%)
Business Search- 14 Million verified businesses
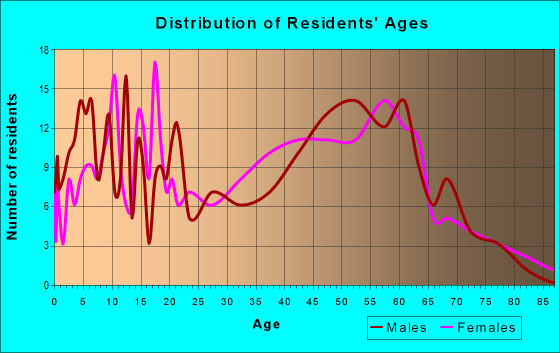
Males: 432
(41.3%)
Females: 615
(58.7%)
For population 25 years and over in 29821:
High school or higher: 78.2%
Bachelor's degree or higher: 19.6%
Graduate or professional degree: 4.8%
Unemployed: 3.6%
Mean travel time to work (commute): 27.3 minutes
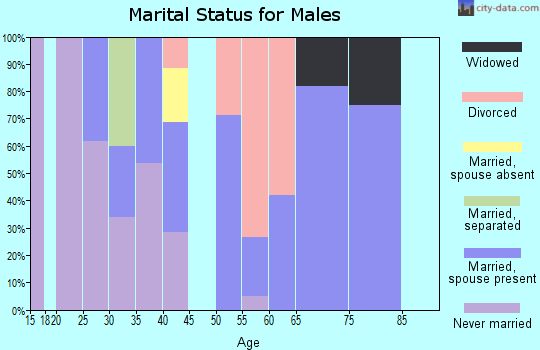
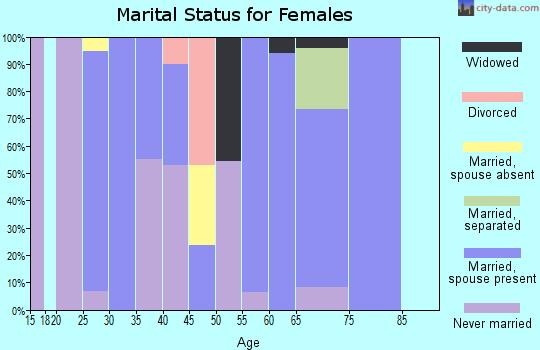
For population 15 years and over in 29821:
Never married: 23.5%
Now married: 61.1%
Separated: 4.4%
Widowed: 5.5%
Divorced: 5.4%
Zip code 29821 compared to state average:
Black race population percentage significantly below state average.
Hispanic race population percentage significantly below state average.
Median age above state average.
Foreign-born population percentage significantly below state average.
Renting percentage significantly below state average.
Length of stay since moving in significantly above state average.
Percentage of population with a bachelor's degree or higher below state average.
Estimated median house/condo value in 2022: $216,916
29821:
$216,916
South Carolina:
$254,600
According to our research of South Carolina and other state lists, there was 1 registered sex offender living in 29821 zip code as of May 08, 2024. The ratio of all residents to sex offenders in zip code 29821 is 1,578 to 1. The ratio of registered sex offenders to all residents in this zip code is near the state average.
Median resident age:
This zip code:
46.1 years
South Carolina median age:
40.5 years
Average household size:
This zip code:
2.6 people
South Carolina:
2.4 people
Averages for the 2020 tax year for zip code 29821, filed in 2021:
Average Adjusted Gross Income (AGI) in 2020: $69,706 (Individual Income Tax Returns)
Here:
$69,706
State:
$65,754
Salary/wage: $56,671 (reported on 77.6% of returns)
Here:
$56,671
State:
$52,566
(% of AGI for various income ranges: 1246.7% for AGIs below $25k, 3546.7% for AGIs $25k-50k, 6923.3% for AGIs $50k-75k, 10395.0% for AGIs $75k-100k, 17091.7% for AGIs $100k-200k)
Taxable interest for individuals: $650 (reported on 26.9% of returns)
This zip code:
$650
South Carolina:
$1,749
(% of AGI for various income ranges: 4.7% for AGIs below $25k, 3.3% for AGIs $25k-50k, 28.3% for AGIs $50k-75k, 27.5% for AGIs $75k-100k, 130.0% for AGIs $100k-200k)
Ordinary dividends: $2,656 (reported on 13.4% of returns)
Here:
$2,656
State:
$8,783
(% of AGI for various income ranges: 9.3% for AGIs below $25k, 55.0% for AGIs $50k-75k, 320.0% for AGIs $100k-200k)
Net capital gain/loss in AGI: +$6,162 (reported on 11.9% of returns)
Here:
+$6,162
State:
+$24,194
(% of AGI for various income ranges: 306.7% for AGIs $50k-75k, 515.0% for AGIs $100k-200k)
Profit/loss from business: +$6,611 (reported on 13.4% of returns)
Here:
+$6,611
State:
+$11,253
(% of AGI for various income ranges: 88.0% for AGIs below $25k, 251.7% for AGIs $50k-75k, 520.0% for AGIs $100k-200k)
Taxable individual retirement arrangement distribution: $19,233 (reported on 9.0% of returns)
29821:
$19,233
South Carolina:
$21,604
(% of AGI for various income ranges: 282.5% for AGIs $25k-50k, 2037.5% for AGIs $75k-100k)
Total itemized deductions: $24,543 (reported on 10.4% of returns)
Here:
$24,543
State:
$35,199
(% of AGI for various income ranges: 495.8% for AGIs $25k-50k, 1871.7% for AGIs $100k-200k)
Charity contributions: $10,340 (reported on 7.5% of returns)
Here:
$10,340
State:
$14,319
(% of AGI for various income ranges: 122.0% for AGIs below $25k, 556.7% for AGIs $100k-200k)
Taxes paid: $6,486 (reported on 10.4% of returns)
29821:
$6,486
State:
$7,486
(% of AGI for various income ranges: 83.3% for AGIs $25k-50k, 590.0% for AGIs $100k-200k)
Earned income credit: $2,217 (reported on 17.9% of returns)
Here:
$2,217
State:
$2,397
(% of AGI for various income ranges: 99.3% for AGIs below $25k, 97.5% for AGIs $25k-50k)
Percentage of individuals using paid preparers for their 2020 taxes: 91.0%
Here:
91%
State:
93%
(% for various income ranges: 90.5% for AGIs below $25k, 93.8% for AGIs $25k-50k, 90.0% for AGIs $50k-75k, 85.7% for AGIs $75k-100k, 100.0% for AGIs $100k-200k, 66.7% for AGIs over 200k)
Averages for the 2012 tax year for zip code 29821, filed in 2013:
Average Adjusted Gross Income (AGI) in 2012: $54,448 (Individual Income Tax Returns)
Here:
$54,448
State:
$51,133
Salary/wage: $48,367 (reported on 84.5% of returns)
Here:
$48,367
State:
$42,173
(% of AGI for various income ranges: 71.2% for AGIs below $25k, 79.1% for AGIs $25k-50k, 70.3% for AGIs $50k-75k, 86.0% for AGIs $75k-100k, 71.9% for AGIs $100k-200k)
Taxable interest for individuals: $900 (reported on 27.6% of returns)
This zip code:
$900
South Carolina:
$1,468
(% of AGI for various income ranges: 0.2% for AGIs below $25k, 0.6% for AGIs $25k-50k, 1.2% for AGIs $50k-75k, 0.3% for AGIs $100k-200k)
Ordinary dividends: $1,038 (reported on 13.8% of returns)
Here:
$1,038
State:
$6,511
Net capital gain/loss in AGI: +$1,950 (reported on 6.9% of returns)
Here:
+$1,950
State:
+$13,061
(% of AGI for various income ranges: 0.7% for AGIs $25k-50k, 0.3% for AGIs $100k-200k)
Profit/loss from business: +$5,160 (reported on 17.2% of returns)
Here:
+$5,160
State:
+$10,167
(% of AGI for various income ranges: 10.3% for AGIs below $25k, 3.5% for AGIs $25k-50k, 0.7% for AGIs $75k-100k)
Taxable individual retirement arrangement distribution: $10,200 (reported on 6.9% of returns)
29821:
$10,200
South Carolina:
$17,019
Total itemized deductions: $20,953 (21% of AGI, reported on 32.8% of returns)
Here:
$20,953
State:
$22,890
Here:
21.3% of AGI
State:
21.4% of AGI
(% of AGI for various income ranges: 14.8% for AGIs below $25k, 15.9% for AGIs $50k-75k, 15.1% for AGIs $75k-100k, 14.8% for AGIs $100k-200k)
Charity contributions: $4,333 (reported on 25.9% of returns)
Here:
$4,333
State:
$5,169
(% of AGI for various income ranges: 3.3% for AGIs $50k-75k, 2.7% for AGIs $75k-100k, 2.6% for AGIs $100k-200k)
Taxes paid: $7,084 (reported on 32.8% of returns)
29821:
$7,084
State:
$7,644
(% of AGI for various income ranges: 2.7% for AGIs below $25k, 3.5% for AGIs $50k-75k, 4.7% for AGIs $75k-100k, 6.3% for AGIs $100k-200k)
Earned income credit: $2,362 (reported on 22.4% of returns)
Here:
$2,362
State:
$2,418
(% of AGI for various income ranges: 8.3% for AGIs below $25k, 1.2% for AGIs $25k-50k)
Percentage of individuals using paid preparers for their 2012 taxes: 69.0%
Here:
69%
State:
57%
(% for various income ranges: 63.6% for AGIs below $25k, 71.4% for AGIs $25k-50k, 85.7% for AGIs $50k-75k, 66.7% for AGIs $75k-100k, 66.7% for AGIs $100k-200k)
Averages for the 2004 tax year for zip code 29821, filed in 2005:
Average Adjusted Gross Income (AGI) in 2004: $40,405 (Individual Income Tax Returns)
Here:
$40,405
State:
$41,965
Salary/wage: $39,117 (reported on 88.8% of returns)
Here:
$39,117
State:
$35,695
(% of AGI for various income ranges: 113.0% for AGIs below $10k, 94.1% for AGIs $10k-25k, 84.0% for AGIs $25k-50k, 85.1% for AGIs $50k-75k, 89.4% for AGIs $75k-100k, 79.9% for AGIs over 100k)
Taxable interest for individuals: $455 (reported on 34.1% of returns)
This zip code:
$455
South Carolina:
$1,623
(% of AGI for various income ranges: 0.6% for AGIs below $10k, 0.7% for AGIs $10k-25k, 0.4% for AGIs $25k-50k, 0.3% for AGIs $50k-75k, 0.5% for AGIs $75k-100k, 0.3% for AGIs over 100k)
Taxable dividends: $620 (reported on 15.9% of returns)
Here:
$620
State:
$3,999
(% of AGI for various income ranges: 0.2% for AGIs $10k-25k, 0.3% for AGIs $25k-50k, 0.1% for AGIs $50k-75k, 0.3% for AGIs $75k-100k, 0.3% for AGIs over 100k)
Net capital gain/loss: +$4,264 (reported on 9.1% of returns)
Here:
+$4,264
State:
+$13,100
(% of AGI for various income ranges: 0.7% for AGIs $10k-25k, -0.2% for AGIs $50k-75k, 0.5% for AGIs $75k-100k, 3.6% for AGIs over 100k)
Profit/loss from business: +$4,702 (reported on 16.2% of returns)
Here:
+$4,702
State:
+$9,144
(% of AGI for various income ranges: 26.0% for AGIs below $10k, 5.9% for AGIs $10k-25k, 1.5% for AGIs $25k-50k, 0.7% for AGIs $50k-75k, 1.8% for AGIs $75k-100k)
IRA payment deduction: $3,300 (reported on 1.7% of returns)
29821:
$3,300
South Carolina:
$2,972
Total itemized deductions: $16,714 (22% of AGI, reported on 33.8% of returns)
Here:
$16,714
State:
$19,039
Here:
22.4% of AGI
State:
22.8% of AGI
(% of AGI for various income ranges: 8.0% for AGIs $10k-25k, 9.3% for AGIs $25k-50k, 14.5% for AGIs $50k-75k, 18.1% for AGIs $75k-100k, 18.0% for AGIs over 100k)
Charity contributions deductions: $3,309 (4% of AGI, reported on 30.2% of returns)
Here:
$3,309
State:
$4,305
Here:
4.4% of AGI
State:
5.0% of AGI
(% of AGI for various income ranges: 1.2% for AGIs $10k-25k, 1.6% for AGIs $25k-50k, 2.9% for AGIs $50k-75k, 3.3% for AGIs $75k-100k, 3.0% for AGIs over 100k)
Total tax: $5,077 (reported on 69.5% of returns)
29821:
$5,077
State:
$6,497
(% of AGI for various income ranges: 5.0% for AGIs below $10k, 3.4% for AGIs $10k-25k, 5.8% for AGIs $25k-50k, 8.1% for AGIs $50k-75k, 10.5% for AGIs $75k-100k, 13.4% for AGIs over 100k)
Earned income credit: $1,932 (reported on 25.5% of returns)
Here:
$1,932
State:
$1,882
Percentage of individuals using paid preparers for their 2004 taxes: 73.6%
Here:
74%
State:
66%
(% for various income ranges: 67.6% for AGIs below $10k, 81.9% for AGIs $10k-25k, 69.9% for AGIs $25k-50k, 78.3% for AGIs $50k-75k, 70.9% for AGIs $75k-100k, 64.3% for AGIs over 100k)
Household received Food Stamps/SNAP in the past 12 months: 56 Household did not receive Food Stamps/SNAP in the past 12 months: 340
Women who had a birth in the past 12 months: 27 (16 now married, 10 unmarried) Women who did not have a birth in the past 12 months: 205 (126 now married, 80 unmarried)
Housing units in zip code 29821 with a mortgage: 192 (28 second mortgage, 28 both second mortgage and home equity loan) Median monthly owner costs for units with a mortgage: $1,583 Median monthly owner costs for units without a mortgage: $369
Residents with income below the poverty level in 2022:
This zip code:
21.7%
Whole state:
14.0%
Residents with income below 50% of the poverty level in 2022:
This zip code:
21.0%
Whole state:
7.3%
Median number of rooms in houses and condos:
Here:
7.4
State:
6.4
Notable locations in this zip code not listed on our city pages
Notable locations in zip code 29821: Hamilton Brach Campground (A), Furys Ferry Campsite (B), Clark Hill Powerhouse (C), Woodlawn Station (D), Forks Campground (E), Clarks Hill - Lost Wilderness Fire Department (F), Westside Fire Department Westside Substation (G). Display/hide their locations on the map
Churches in zip code 29821 include: Spring Grove Church (A), Dothan Church (B), Carey Hill Church (C), Bethlehem Church (D), Hopewell Church (E), Bethany Church (F), Laurel Grove Church (G), Asbury Mission Church (H), Poplar Spring Church (I). Display/hide their locations on the map
Cemeteries: Ashbury Cemetery (1), Bethelehem Cemetery (2), Hopewell Cemetery (3), McKie Cemetery (4), Middleton Cemetery (5), Crafton Cemetery (6), Taylor Cemetery (7). Display/hide their locations on the map
Streams, rivers, and creeks: Cheves Creek (A), Cosey Branch (B), Maulden Branch (C), Sweetwater Branch (D), Gold Branch (E), Shumate Branch (F), Ryan Branch (G), Reedy Branch (H), Ray Creek (I). Display/hide their locations on the map
Size of family households: 148 2-persons, 24 3-persons, 89 4-persons, 22 5-persons, 12 6-persons
Size of nonfamily households: 92 1-person, 6 2-persons
143 married couples with children.
39 single-parent households (39 women).
98.5% of residents of 29821 zip code speak English at home.
0.3% of residents speak other Indo-European language at home (100% very well).
1.0% of residents speak other language at home (100% very well).
Foreign born population: 5 (0.5%) (100.0% of them are naturalized citizens)
This zip code:
0.5%
Whole state:
5.2%
60%St. Vincent and the Grenadines
65%American
12%German
4%European
3%English
2%African
1%Scotch-Irish
1%Slavic
Year of entry for the foreign-born population
02010 or later
52000 to 2009
01990 to 1999
18Before 1990
Facilities with environmental interests located in this zip code:
AT&T CLARKS HILL (P O BOX 86 in CLARKS HILL, SC)
(Resource Conservation and Recovery Act (tracking hazardous waste)) STATE MASTER (South Carolina database) - HAZARDOUS WASTE PROGRAM Organizations: AT & T (CONTACT/OWNER)
Housing units lacking complete plumbing facilities: 8.0% Housing units lacking complete kitchen facilities: 10.8%
80.9%Electricity
13.4%Bottled, tank, or LP gas
4.6%Wood
1.9%Utility gas
Population in 1990: 439. Population change in the 1990s: +527 (+120.0%).
Place of birth for U.S.-born residents:
This state: 229
Northeast: 32
Midwest: 98
South: 652
West: 18
75% of the 29821 zip code residents lived in the same house 5 years ago. Out of people who lived in different houses, 64% lived in this county. Out of people who lived in different counties, 50% lived in South Carolina.
98% of the 29821 zip code residents lived in the same house 1 year ago. Out of people who lived in different houses, 100% moved from different county within same state.
Private vs. public school enrollment:
Students in private schools in grades 1 to 8 (elementary and middle school):
Here:
0.0%
South Carolina:
14.4%
Students in private schools in grades 9 to 12 (high school):
Here:
0.0%
South Carolina:
11.1%
Students in private undergraduate colleges: 9
Here:
31.5%
South Carolina:
21.9%
Occupation by median earnings in the past 12 months ($)
241,185Management occupations
145,329Architecture and engineering occupations
92,666Production occupations
61,982Sales and related occupations
52,714Installation, maintenance, and repair occupations
38,029Office and administrative support occupations
Top industries in this zip code by the number of employees in 2005:
Other Services (except Public Administration): Religious Organizations (5-9: 1, 1-4: 3)
Other Services (except Public Administration): Commercial and Industrial Machinery and Equipment (except Automotive and Electronic) Repair and Maintenance (5-9: 1)
Construction: Site Preparation Contractors (5-9: 1)
Construction: New Single-Family Housing Construction (except Operative Builders) (5-9: 1)
Construction: Electrical Contractors (1-4: 1)
Construction: Drywall and Insulation Contractors (1-4: 1)
Fatal accident statistics in 2014:
Fatal accident count: 1
Vehicles involved in fatal accidents: 2
Fatal accidents caused by drunken drivers: 2
Fatalities: 3
Persons involved in fatal accidents: 3
Pedestrians involved in fatal accidents: 0
2002 - 2018 National Fire Incident Reporting System (NFIRS) incidents
Based on the data from the years 2002 - 2018 the average number of fires per year is 11. The highest number of reported fires - 26 took place in 2008, and the least - 2 in 2002. The data has an increasing trend.
When looking into fire subcategories, the most reports belonged to: Outside Fires (59.4%), and Structure Fires (19.3%).
Fire incident types reported to NFIRS in Zip Code 29821


 Nearest zip codes: 30809, 29838, 30907, 29860, 30903, 30909.


 Based on the data from the years 2002 - 2018 the average number of fires per year is 11. The highest number of reported fires - 26 took place in 2008, and the least - 2 in 2002. The data has an increasing trend.
 When looking into fire subcategories, the most reports belonged to: Outside Fires (59.4%), and Structure Fires (19.3%).