Estimated zip code population in 2022: 1,636 Zip code population in 2010: 1,810 Zip code population in 2000: 1,222
Houses and condos: 736 Renter-occupied apartments: 58
% of renters here:
8%
State:
34%
March 2022 cost of living index in zip code 30641: 90.7 (less than average, U.S. average is 100)
Land area: 34.1 sq. mi. Water area: 0.3 sq. mi.
Population density: 48 people per square mile
(very low).
OSM Map
General Map
Google Map
MSN Map
OSM Map
General Map
Google Map
MSN Map
OSM Map
General Map
Google Map
MSN Map
OSM Map
General Map
Google Map
MSN Map
Please wait while loading the map...
Real estate property taxes paid for housing units in 2022:
This zip code:
0.9% ($3,087)
Georgia:
0.7% ($2,160)
Median real estate property taxes paid for housing units with mortgages in 2022: $2,077 (0.7%) Median real estate property taxes paid for housing units with no mortgage in 2022: $4,048 (0.8%)
Estimated median house/condo value in 2022: $356,783
30641:
$356,783
Georgia:
$297,400
According to our research of Georgia and other state lists, there were 5 registered sex offenders living in 30641 zip code as of May 28, 2024. The ratio of all residents to sex offenders in zip code 30641 is 428 to 1. The ratio of registered sex offenders to all residents in this zip code is near the state average.
Median resident age:
This zip code:
50.7 years
Georgia median age:
37.6 years
Average household size:
This zip code:
2.4 people
Georgia:
2.6 people
Averages for the 2020 tax year for zip code 30641, filed in 2021:
Average Adjusted Gross Income (AGI) in 2020: $78,208 (Individual Income Tax Returns)
Here:
$78,208
State:
$70,847
Salary/wage: $62,194 (reported on 80.0% of returns)
Here:
$62,194
State:
$59,126
(% of AGI for various income ranges: 1111.1% for AGIs below $25k, 3800.7% for AGIs $25k-50k, 6755.5% for AGIs $50k-75k, 9657.1% for AGIs $75k-100k, 18359.0% for AGIs $100k-200k)
Taxable interest for individuals: $1,904 (reported on 28.0% of returns)
This zip code:
$1,904
Georgia:
$2,011
(% of AGI for various income ranges: 12.1% for AGIs below $25k, 11.3% for AGIs $25k-50k, 22.7% for AGIs $50k-75k, 52.9% for AGIs $75k-100k, 158.0% for AGIs $100k-200k)
Ordinary dividends: $8,150 (reported on 18.0% of returns)
Here:
$8,150
State:
$8,996
(% of AGI for various income ranges: 43.2% for AGIs below $25k, 25.3% for AGIs $25k-50k, 111.8% for AGIs $50k-75k, 239.0% for AGIs $100k-200k)
Net capital gain/loss in AGI: +$26,412 (reported on 17.0% of returns)
Here:
+$26,412
State:
+$28,402
(% of AGI for various income ranges: 67.9% for AGIs below $25k, 60.0% for AGIs $25k-50k, 252.7% for AGIs $50k-75k, 634.0% for AGIs $100k-200k)
Profit/loss from business: +$7,245 (reported on 20.0% of returns)
Here:
+$7,245
State:
+$6,707
(% of AGI for various income ranges: 137.9% for AGIs below $25k, 172.7% for AGIs $25k-50k, 207.3% for AGIs $50k-75k, 700.0% for AGIs $100k-200k)
Taxable individual retirement arrangement distribution: $22,908 (reported on 12.0% of returns)
30641:
$22,908
Georgia:
$20,525
(% of AGI for various income ranges: 212.6% for AGIs below $25k, 585.5% for AGIs $50k-75k, 1701.0% for AGIs $100k-200k)
Total itemized deductions: $34,300 (reported on 14.0% of returns)
Here:
$34,300
State:
$34,001
(% of AGI for various income ranges: 566.7% for AGIs $25k-50k, 764.3% for AGIs $75k-100k, 1358.0% for AGIs $100k-200k)
Charity contributions: $14,842 (reported on 12.0% of returns)
Here:
$14,842
State:
$14,164
(% of AGI for various income ranges: 76.0% for AGIs $25k-50k, 205.7% for AGIs $75k-100k, 441.0% for AGIs $100k-200k)
Taxes paid: $7,500 (reported on 14.0% of returns)
30641:
$7,500
State:
$7,540
(% of AGI for various income ranges: 78.0% for AGIs $25k-50k, 225.7% for AGIs $75k-100k, 415.0% for AGIs $100k-200k)
Earned income credit: $2,000 (reported on 12.0% of returns)
Here:
$2,000
State:
$2,530
(% of AGI for various income ranges: 76.8% for AGIs below $25k, 62.7% for AGIs $25k-50k)
Percentage of individuals using paid preparers for their 2020 taxes: 93.0%
Here:
93%
State:
93%
(% for various income ranges: 92.6% for AGIs below $25k, 90.5% for AGIs $25k-50k, 93.8% for AGIs $50k-75k, 90.9% for AGIs $75k-100k, 94.7% for AGIs $100k-200k, 100.0% for AGIs over 200k)
Averages for the 2012 tax year for zip code 30641, filed in 2013:
Average Adjusted Gross Income (AGI) in 2012: $58,886 (Individual Income Tax Returns)
Here:
$58,886
State:
$56,131
Salary/wage: $47,055 (reported on 80.0% of returns)
Here:
$47,055
State:
$47,942
(% of AGI for various income ranges: 65.6% for AGIs below $25k, 75.3% for AGIs $25k-50k, 77.3% for AGIs $50k-75k, 68.7% for AGIs $75k-100k, 110.3% for AGIs $100k-200k)
Taxable interest for individuals: $1,421 (reported on 34.3% of returns)
This zip code:
$1,421
Georgia:
$1,706
(% of AGI for various income ranges: 2.3% for AGIs below $25k, 0.4% for AGIs $25k-50k, 1.3% for AGIs $50k-75k, 0.4% for AGIs $75k-100k, 1.4% for AGIs $100k-200k)
Ordinary dividends: $3,692 (reported on 17.1% of returns)
Here:
$3,692
State:
$7,265
(% of AGI for various income ranges: 0.3% for AGIs below $25k, 0.3% for AGIs $25k-50k, 0.9% for AGIs $50k-75k, 0.7% for AGIs $75k-100k, 3.5% for AGIs $100k-200k)
Net capital gain/loss in AGI: +$4,238 (reported on 11.4% of returns)
Here:
+$4,238
State:
+$16,323
Profit/loss from business: +$8,300 (reported on 18.6% of returns)
Here:
+$8,300
State:
+$7,583
(% of AGI for various income ranges: 11.9% for AGIs below $25k, 3.3% for AGIs $25k-50k, 7.1% for AGIs $75k-100k)
Taxable individual retirement arrangement distribution: $10,900 (reported on 12.9% of returns)
30641:
$10,900
Georgia:
$17,199
(% of AGI for various income ranges: 4.1% for AGIs below $25k, 6.6% for AGIs $25k-50k, 6.5% for AGIs $75k-100k)
Total itemized deductions: $23,523 (24% of AGI, reported on 44.3% of returns)
Here:
$23,523
State:
$23,886
Here:
24.4% of AGI
State:
21.5% of AGI
(% of AGI for various income ranges: 11.6% for AGIs below $25k, 16.0% for AGIs $25k-50k, 17.2% for AGIs $50k-75k, 21.7% for AGIs $75k-100k, 18.4% for AGIs $100k-200k, 17.5% for AGIs over 200k)
Charity contributions: $5,120 (reported on 35.7% of returns)
Here:
$5,120
State:
$5,507
(% of AGI for various income ranges: 1.7% for AGIs below $25k, 1.7% for AGIs $25k-50k, 2.2% for AGIs $50k-75k, 4.7% for AGIs $75k-100k, 5.0% for AGIs $100k-200k, 2.2% for AGIs over 200k)
Taxes paid: $6,710 (reported on 44.3% of returns)
30641:
$6,710
State:
$7,838
(% of AGI for various income ranges: 2.0% for AGIs below $25k, 3.8% for AGIs $25k-50k, 4.7% for AGIs $50k-75k, 6.0% for AGIs $75k-100k, 6.0% for AGIs $100k-200k, 5.6% for AGIs over 200k)
Earned income credit: $2,146 (reported on 18.6% of returns)
Here:
$2,146
State:
$2,589
(% of AGI for various income ranges: 6.9% for AGIs below $25k, 1.0% for AGIs $25k-50k)
Percentage of individuals using paid preparers for their 2012 taxes: 52.9%
Here:
53%
State:
55%
(% for various income ranges: 42.3% for AGIs below $25k, 43.8% for AGIs $25k-50k, 63.6% for AGIs $50k-75k, 75.0% for AGIs $75k-100k, 85.7% for AGIs $100k-200k)
Averages for the 2004 tax year for zip code 30641, filed in 2005:
Average Adjusted Gross Income (AGI) in 2004: $53,302 (Individual Income Tax Returns)
Here:
$53,302
State:
$47,553
Salary/wage: $43,511 (reported on 81.6% of returns)
Here:
$43,511
State:
$42,178
(% of AGI for various income ranges: 71.4% for AGIs below $10k, 72.6% for AGIs $10k-25k, 77.0% for AGIs $25k-50k, 76.0% for AGIs $50k-75k, 85.8% for AGIs $75k-100k, 48.7% for AGIs over 100k)
Taxable interest for individuals: $1,573 (reported on 44.4% of returns)
This zip code:
$1,573
Georgia:
$1,772
(% of AGI for various income ranges: 5.9% for AGIs below $10k, 4.8% for AGIs $10k-25k, 1.3% for AGIs $25k-50k, 0.8% for AGIs $50k-75k, 0.6% for AGIs $75k-100k, 1.1% for AGIs over 100k)
Taxable dividends: $3,203 (reported on 20.3% of returns)
Here:
$3,203
State:
$4,283
(% of AGI for various income ranges: 2.4% for AGIs $10k-25k, 0.5% for AGIs $25k-50k, 0.4% for AGIs $50k-75k, 0.7% for AGIs $75k-100k, 2.0% for AGIs over 100k)
Net capital gain/loss: +$19,757 (reported on 16.4% of returns)
Here:
+$19,757
State:
+$16,461
(% of AGI for various income ranges: -0.9% for AGIs below $10k, 0.8% for AGIs $10k-25k, -0.3% for AGIs $25k-50k, 1.2% for AGIs $50k-75k, 14.9% for AGIs over 100k)
Profit/loss from business: +$13,993 (reported on 21.6% of returns)
Here:
+$13,993
State:
+$8,201
(% of AGI for various income ranges: 14.6% for AGIs below $10k, 8.2% for AGIs $10k-25k, 6.2% for AGIs $25k-50k, 7.1% for AGIs $50k-75k, 5.9% for AGIs over 100k)
IRA payment deduction: $3,000 (reported on 1.6% of returns)
30641:
$3,000
Georgia:
$2,969
Total itemized deductions: $19,980 (24% of AGI, reported on 47.1% of returns)
Here:
$19,980
State:
$19,944
Here:
23.8% of AGI
State:
22.6% of AGI
(% of AGI for various income ranges: 23.6% for AGIs $10k-25k, 17.7% for AGIs $25k-50k, 19.4% for AGIs $50k-75k, 19.9% for AGIs $75k-100k, 15.4% for AGIs over 100k)
Charity contributions deductions: $4,794 (5% of AGI, reported on 40.2% of returns)
Here:
$4,794
State:
$4,354
Here:
5.4% of AGI
State:
4.7% of AGI
(% of AGI for various income ranges: 2.6% for AGIs $10k-25k, 2.5% for AGIs $25k-50k, 3.3% for AGIs $50k-75k, 3.1% for AGIs $75k-100k, 4.8% for AGIs over 100k)
Total tax: $7,486 (reported on 77.9% of returns)
30641:
$7,486
State:
$8,223
(% of AGI for various income ranges: 4.2% for AGIs below $10k, 4.5% for AGIs $10k-25k, 6.7% for AGIs $25k-50k, 8.5% for AGIs $50k-75k, 8.9% for AGIs $75k-100k, 16.3% for AGIs over 100k)
Earned income credit: $1,494 (reported on 13.5% of returns)
Here:
$1,494
State:
$1,986
Percentage of individuals using paid preparers for their 2004 taxes: 63.8%
Here:
64%
State:
62%
(% for various income ranges: 45.2% for AGIs below $10k, 63.4% for AGIs $10k-25k, 66.5% for AGIs $25k-50k, 65.8% for AGIs $50k-75k, 68.5% for AGIs $75k-100k, 82.1% for AGIs over 100k)
Household received Food Stamps/SNAP in the past 12 months: 20 Household did not receive Food Stamps/SNAP in the past 12 months: 670
Women who had a birth in the past 12 months: 13 (10 now married, 3 unmarried) Women who did not have a birth in the past 12 months: 261 (141 now married, 119 unmarried)
Housing units in zip code 30641 with a mortgage: 282 (14 second mortgage, 15 both second mortgage and home equity loan) Houses without a mortgage: 17
Median monthly owner costs for units with a mortgage: $1,319 Median monthly owner costs for units without a mortgage: $757
Residents with income below the poverty level in 2022:
This zip code:
12.1%
Whole state:
12.7%
Residents with income below 50% of the poverty level in 2022:
This zip code:
9.2%
Whole state:
6.3%
Median number of rooms in houses and condos:
Here:
7.2
State:
6.8
Median number of rooms in apartments:
Here:
6.0
State:
4.6
Notable locations in this zip code not listed on our city pages
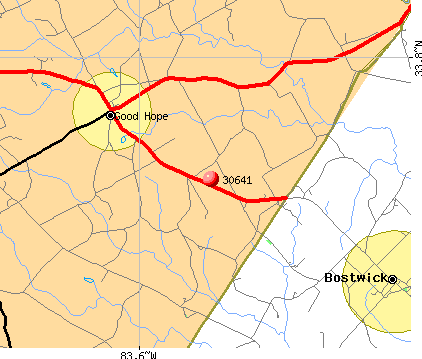
Notable locations in zip code 30641: Walton County Fire / Rescue Department Station 7 (A), Georgia Forestry Commission Morgan - Walton Office (B). Display/hide their locations on the map
Churches in zip code 30641 include: Braswell Church (A), Braswell Congregational Holiness Church (B), Mount Carmel Church (C), High Shoals Baptist Church (D). Display/hide their locations on the map
Cemeteries: Sheets Cemetery (1), Michael Cemetery (2), Carlton Cemetery (3), Stark Cemetery (4), Green Cemetery (5), Harris Cemetery (6), Powell Cemetery (7). Display/hide their locations on the map
Streams, rivers, and creeks: Turkey Creek (A), Ivey Branch (B), Indian Creek (C), Rocky Branch (D), Green Branch (E). Display/hide their locations on the map
HANSON AGGREGATES SE (GA HWY 186 in GOOD HOPE, GA)
AIR SYNTHETIC MINOR (AIRS/AFS) Business SIC classification: CRUSHED AND BROKEN GRANITE Alternative names: DAVIDSON MINERAL PROPERTIES
Housing units lacking complete plumbing facilities: 3.8% Housing units lacking complete kitchen facilities: 4.7%
95.5%Electricity
3.6%Wood
1.2%Bottled, tank, or LP gas
Population in 1990: 1,031. Population change in the 1990s: +191 (+18.5%).
Place of birth for U.S.-born residents:
This state: 1,231
Northeast: 21
Midwest: 20
South: 180
West: 153
46% of the 30641 zip code residents lived in the same house 5 years ago. Out of people who lived in different houses, 59% lived in this county. Out of people who lived in different counties, 50% lived in Georgia.
98% of the 30641 zip code residents lived in the same house 1 year ago. Out of people who lived in different houses, 42% moved from this county. Out of people who lived in different houses, 62% moved from different county within same state.
Private vs. public school enrollment:
Students in private schools in grades 1 to 8 (elementary and middle school): 79
Here:
47.3%
Georgia:
12.1%
Students in private schools in grades 9 to 12 (high school): 14
Here:
13.2%
Georgia:
10.8%
Students in private undergraduate colleges: 4
Here:
40.8%
Georgia:
17.1%
Occupation by median earnings in the past 12 months ($)
75,322Management occupations
68,008Education, training, and library occupations
62,099Personal care and service occupations
58,019Production occupations
51,446Health technologists and technicians
50,673Construction and extraction occupations
Top industries in this zip code by the number of employees in 2005:
Construction: Commercial and Institutional Building Construction (10-19 employees: 1 establishment)
Information: Radio Stations (5-9: 1, 1-4: 1)
Construction: Electrical Contractors (5-9: 1)
Wholesale Trade: Other Miscellaneous Nondurable Goods Merchant Wholesalers (5-9: 1)
Other Services (except Public Administration): Religious Organizations (1-4: 2)
Other Services (except Public Administration): Beauty Salons (1-4: 2)
Construction: Masonry Contractors (1-4: 1)
Wholesale Trade: Petroleum and Petroleum Products Merchant Wholesalers (except Bulk Stations and Terminals) (1-4: 1)
Construction: New Housing Operative Builders (1-4: 1)
Home Mortgage Disclosure Act Aggregated Statistics For Year 2009 (Based on 2 partial tracts)
A) FHA, FSA/RHS & VA Home Purchase Loans
B) Conventional Home Purchase Loans
C) Refinancings
D) Home Improvement Loans
F) Non-occupant Loans on < 5 Family Dwellings (A B C & D)
G) Loans On Manufactured Home Dwelling (A B C & D)
Number
Average Value
Number
Average Value
Number
Average Value
Number
Average Value
Number
Average Value
Number
Average Value
LOANS ORIGINATED
10
$107,414
3
$149,767
59
$167,318
4
$116,485
4
$149,365
3
$79,447
APPLICATIONS APPROVED, NOT ACCEPTED
0
$0
0
$0
3
$120,780
1
$51,000
1
$82,670
1
$51,000
APPLICATIONS DENIED
1
$40,260
2
$136,615
21
$209,327
3
$46,880
0
$0
2
$71,930
APPLICATIONS WITHDRAWN
3
$114,340
2
$104,945
22
$169,336
0
$0
2
$59,855
1
$83,200
FILES CLOSED FOR INCOMPLETENESS
0
$0
1
$220,090
6
$182,153
0
$0
1
$80,520
0
$0
Aggregated Statistics For Year 2008 (Based on 2 partial tracts)
A) FHA, FSA/RHS & VA Home Purchase Loans
B) Conventional Home Purchase Loans
C) Refinancings
D) Home Improvement Loans
F) Non-occupant Loans on < 5 Family Dwellings (A B C & D)
G) Loans On Manufactured Home Dwelling (A B C & D)
Number
Average Value
Number
Average Value
Number
Average Value
Number
Average Value
Number
Average Value
Number
Average Value
LOANS ORIGINATED
11
$142,545
11
$163,383
47
$166,351
4
$57,840
10
$146,707
3
$86,423
APPLICATIONS APPROVED, NOT ACCEPTED
1
$58,510
2
$114,070
5
$215,472
3
$98,233
2
$125,075
1
$71,390
APPLICATIONS DENIED
2
$96,625
1
$37,580
19
$174,008
6
$91,703
2
$188,415
2
$81,595
APPLICATIONS WITHDRAWN
3
$122,390
1
$110,040
13
$180,736
1
$64,420
3
$128,117
0
$0
FILES CLOSED FOR INCOMPLETENESS
0
$0
1
$147,620
3
$129,727
1
$8,050
0
$0
0
$0
Aggregated Statistics For Year 2007 (Based on 2 partial tracts)
A) FHA, FSA/RHS & VA Home Purchase Loans
B) Conventional Home Purchase Loans
C) Refinancings
D) Home Improvement Loans
F) Non-occupant Loans on < 5 Family Dwellings (A B C & D)
G) Loans On Manufactured Home Dwelling (A B C & D)
Number
Average Value
Number
Average Value
Number
Average Value
Number
Average Value
Number
Average Value
Number
Average Value
LOANS ORIGINATED
7
$148,924
47
$155,158
55
$192,350
9
$49,267
14
$163,187
2
$88,570
APPLICATIONS APPROVED, NOT ACCEPTED
0
$0
4
$139,970
11
$147,084
3
$98,950
1
$122,390
1
$76,230
APPLICATIONS DENIED
1
$57,970
8
$127,558
39
$164,715
6
$106,287
4
$153,928
3
$69,607
APPLICATIONS WITHDRAWN
1
$50,460
2
$169,360
18
$163,307
0
$0
2
$163,185
1
$50,460
FILES CLOSED FOR INCOMPLETENESS
0
$0
2
$147,890
8
$193,986
0
$0
5
$144,722
0
$0
Aggregated Statistics For Year 2006 (Based on 2 partial tracts)
A) FHA, FSA/RHS & VA Home Purchase Loans
B) Conventional Home Purchase Loans
C) Refinancings
D) Home Improvement Loans
F) Non-occupant Loans on < 5 Family Dwellings (A B C & D)
G) Loans On Manufactured Home Dwelling (A B C & D)
Number
Average Value
Number
Average Value
Number
Average Value
Number
Average Value
Number
Average Value
Number
Average Value
LOANS ORIGINATED
13
$146,670
54
$135,254
61
$144,558
8
$48,715
26
$107,360
4
$97,832
APPLICATIONS APPROVED, NOT ACCEPTED
0
$0
3
$86,247
12
$121,093
2
$18,790
2
$16,105
0
$0
APPLICATIONS DENIED
0
$0
10
$152,612
38
$180,464
8
$77,902
3
$157,820
2
$86,960
APPLICATIONS WITHDRAWN
1
$102,530
4
$111,655
18
$161,666
1
$39,190
1
$82,130
1
$61,730
FILES CLOSED FOR INCOMPLETENESS
0
$0
1
$85,350
10
$163,724
1
$42,940
0
$0
0
$0
Aggregated Statistics For Year 2005 (Based on 2 partial tracts)
A) FHA, FSA/RHS & VA Home Purchase Loans
B) Conventional Home Purchase Loans
C) Refinancings
D) Home Improvement Loans
F) Non-occupant Loans on < 5 Family Dwellings (A B C & D)
G) Loans On Manufactured Home Dwelling (A B C & D)
Number
Average Value
Number
Average Value
Number
Average Value
Number
Average Value
Number
Average Value
Number
Average Value
LOANS ORIGINATED
6
$155,940
45
$107,169
82
$176,509
6
$77,210
9
$318,143
3
$50,817
APPLICATIONS APPROVED, NOT ACCEPTED
0
$0
3
$110,580
10
$86,586
2
$227,335
1
$57,970
1
$39,720
APPLICATIONS DENIED
0
$0
8
$171,978
43
$155,060
6
$115,143
5
$117,238
2
$116,215
APPLICATIONS WITHDRAWN
1
$76,760
5
$96,946
25
$167,439
3
$142,430
1
$126,680
1
$61,200
FILES CLOSED FOR INCOMPLETENESS
0
$0
1
$64,420
13
$164,178
0
$0
0
$0
2
$80,250
Aggregated Statistics For Year 2004 (Based on 2 partial tracts)
A) FHA, FSA/RHS & VA Home Purchase Loans
B) Conventional Home Purchase Loans
C) Refinancings
D) Home Improvement Loans
F) Non-occupant Loans on < 5 Family Dwellings (A B C & D)
G) Loans On Manufactured Home Dwelling (A B C & D)
Number
Average Value
Number
Average Value
Number
Average Value
Number
Average Value
Number
Average Value
Number
Average Value
LOANS ORIGINATED
3
$107,003
33
$130,556
62
$145,265
9
$65,728
9
$150,542
5
$88,358
APPLICATIONS APPROVED, NOT ACCEPTED
0
$0
2
$139,570
9
$101,753
1
$26,840
1
$115,950
2
$48,850
APPLICATIONS DENIED
1
$62,810
7
$97,774
33
$135,322
8
$50,056
1
$37,580
6
$79,983
APPLICATIONS WITHDRAWN
1
$112,190
2
$129,370
11
$94,721
1
$2,680
0
$0
1
$67,100
FILES CLOSED FOR INCOMPLETENESS
0
$0
2
$161,310
8
$124,806
1
$65,490
0
$0
1
$107,900
Aggregated Statistics For Year 2003 (Based on 2 partial tracts)
A) FHA, FSA/RHS & VA Home Purchase Loans
B) Conventional Home Purchase Loans
C) Refinancings
D) Home Improvement Loans
F) Non-occupant Loans on < 5 Family Dwellings (A B C & D)
Number
Average Value
Number
Average Value
Number
Average Value
Number
Average Value
Number
Average Value
LOANS ORIGINATED
4
$141,448
24
$145,808
120
$144,368
6
$25,140
9
$162,352
APPLICATIONS APPROVED, NOT ACCEPTED
1
$78,910
1
$123,460
10
$105,266
1
$157,820
0
$0
APPLICATIONS DENIED
1
$157,280
5
$104,246
24
$120,870
2
$19,055
2
$94,745
APPLICATIONS WITHDRAWN
1
$51,530
2
$74,885
17
$95,898
0
$0
1
$13,420
FILES CLOSED FOR INCOMPLETENESS
0
$0
1
$9,660
4
$101,188
0
$0
0
$0
Aggregated Statistics For Year 2002 (Based on 2 partial tracts)
A) FHA, FSA/RHS & VA Home Purchase Loans
B) Conventional Home Purchase Loans
C) Refinancings
D) Home Improvement Loans
F) Non-occupant Loans on < 5 Family Dwellings (A B C & D)
Number
Average Value
Number
Average Value
Number
Average Value
Number
Average Value
Number
Average Value
LOANS ORIGINATED
3
$129,370
20
$128,993
83
$123,897
8
$12,682
9
$91,434
APPLICATIONS APPROVED, NOT ACCEPTED
0
$0
5
$94,584
11
$124,684
0
$0
0
$0
APPLICATIONS DENIED
1
$112,730
4
$68,575
25
$111,762
5
$28,666
1
$130,980
APPLICATIONS WITHDRAWN
1
$76,760
2
$136,080
21
$130,085
1
$13,420
1
$39,190
FILES CLOSED FOR INCOMPLETENESS
0
$0
2
$111,385
3
$84,100
0
$0
0
$0
Aggregated Statistics For Year 2001 (Based on 2 partial tracts)
A) FHA, FSA/RHS & VA Home Purchase Loans
B) Conventional Home Purchase Loans
C) Refinancings
D) Home Improvement Loans
F) Non-occupant Loans on < 5 Family Dwellings (A B C & D)
Number
Average Value
Number
Average Value
Number
Average Value
Number
Average Value
Number
Average Value
LOANS ORIGINATED
5
$117,130
15
$124,752
66
$111,768
6
$43,480
5
$94,154
APPLICATIONS APPROVED, NOT ACCEPTED
0
$0
3
$95,370
7
$102,146
2
$8,855
0
$0
APPLICATIONS DENIED
1
$142,250
6
$92,598
23
$80,893
4
$21,605
1
$47,240
APPLICATIONS WITHDRAWN
0
$0
1
$76,760
18
$91,942
1
$16,100
1
$67,100
FILES CLOSED FOR INCOMPLETENESS
0
$0
0
$0
3
$83,383
0
$0
0
$0
Aggregated Statistics For Year 2000 (Based on 2 partial tracts)
A) FHA, FSA/RHS & VA Home Purchase Loans
B) Conventional Home Purchase Loans
C) Refinancings
D) Home Improvement Loans
F) Non-occupant Loans on < 5 Family Dwellings (A B C & D)
Number
Average Value
Number
Average Value
Number
Average Value
Number
Average Value
Number
Average Value
LOANS ORIGINATED
10
$96,195
20
$126,819
41
$101,717
6
$12,257
6
$104,945
APPLICATIONS APPROVED, NOT ACCEPTED
0
$0
2
$99,845
4
$88,705
2
$39,455
0
$0
APPLICATIONS DENIED
2
$80,520
5
$145,150
14
$74,001
9
$29,882
1
$56,900
APPLICATIONS WITHDRAWN
0
$0
4
$94,478
14
$76,034
0
$0
1
$42,410
FILES CLOSED FOR INCOMPLETENESS
0
$0
0
$0
4
$86,022
0
$0
0
$0
Aggregated Statistics For Year 1999 (Based on 1 partial tract)
A) FHA, FSA/RHS & VA Home Purchase Loans
B) Conventional Home Purchase Loans
C) Refinancings
D) Home Improvement Loans
F) Non-occupant Loans on < 5 Family Dwellings (A B C & D)
Detailed PMIC statistics for the following Tracts:1102.00
2006 - 2017 National Fire Incident Reporting System (NFIRS) incidents
According to the data from the years 2006 - 2017 the average number of fires per year is 10. The highest number of reported fires - 32 took place in 2007, and the least - 2 in 2006. The data has a growing trend.
When looking into fire subcategories, the most reports belonged to: Outside Fires (63.7%), and Structure Fires (21.8%).
Fire incident types reported to NFIRS in Zip Code 30641

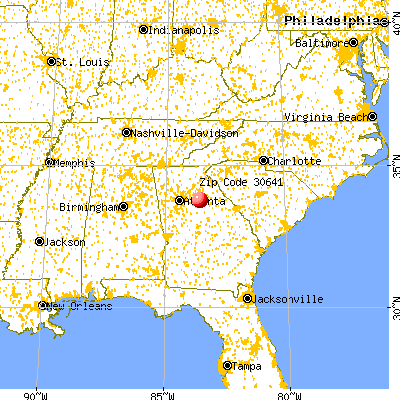


 Nearest zip codes: 30623, 30621, 30655, 30622, 30663, 30656.


 According to the data from the years 2006 - 2017 the average number of fires per year is 10. The highest number of reported fires - 32 took place in 2007, and the least - 2 in 2006. The data has a growing trend.
 When looking into fire subcategories, the most reports belonged to: Outside Fires (63.7%), and Structure Fires (21.8%).