Estimated zip code population in 2022: 7,182 Zip code population in 2010: 5,353 Zip code population in 2000: 2,796
Houses and condos: 2,193 Renter-occupied apartments: 578
% of renters here:
26%
State:
33%
March 2022 cost of living index in zip code 34753: 90.7 (less than average, U.S. average is 100)
Land area: 5.5 sq. mi. Water area: 1.6 sq. mi.
Population density: 1,316 people per square mile
(low).
OSM Map
General Map
Google Map
MSN Map
OSM Map
General Map
Google Map
MSN Map
OSM Map
General Map
Google Map
MSN Map
OSM Map
General Map
Google Map
MSN Map
Please wait while loading the map...
Real estate property taxes paid for housing units in 2022:
This zip code:
0.7% ($1,873)
Florida:
0.7% ($2,529)
Median real estate property taxes paid for housing units with mortgages in 2022: $1,796 (0.7%) Median real estate property taxes paid for housing units with no mortgage in 2022: $2,123 (0.7%)
Estimated median house/condo value in 2022: $283,692
34753:
$283,692
Florida:
$354,100
According to our research of Florida and other state lists, there were 4 registered sex offenders living in 34753 zip code as of April 26, 2024. The ratio of all residents to sex offenders in zip code 34753 is 1,418 to 1. The ratio of registered sex offenders to all residents in this zip code is lower than the state average.
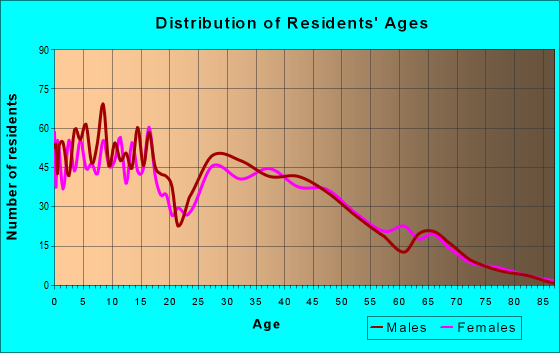
Median resident age:
This zip code:
31.2 years
Florida median age:
42.7 years
Average household size:
This zip code:
3.3 people
Florida:
2.5 people
Averages for the 2020 tax year for zip code 34753, filed in 2021:
Average Adjusted Gross Income (AGI) in 2020: $41,413 (Individual Income Tax Returns)
Here:
$41,413
State:
$82,200
Salary/wage: $40,701 (reported on 90.4% of returns)
Here:
$40,701
State:
$58,347
(% of AGI for various income ranges: 1392.1% for AGIs below $25k, 3931.9% for AGIs $25k-50k, 6987.0% for AGIs $50k-75k, 10512.6% for AGIs $75k-100k, 20050.9% for AGIs $100k-200k)
Taxable interest for individuals: $282 (reported on 8.1% of returns)
This zip code:
$282
Florida:
$4,272
(% of AGI for various income ranges: 2.6% for AGIs below $25k, 2.6% for AGIs $25k-50k, 1.4% for AGIs $50k-75k, 1.1% for AGIs $75k-100k, 15.5% for AGIs $100k-200k)
Ordinary dividends: $986 (reported on 4.1% of returns)
Here:
$986
State:
$15,863
(% of AGI for various income ranges: 1.5% for AGIs below $25k, 5.2% for AGIs $25k-50k, 6.8% for AGIs $50k-75k, 21.1% for AGIs $75k-100k)
Net capital gain/loss in AGI: +$1,764 (reported on 4.1% of returns)
Here:
+$1,764
State:
+$62,983
(% of AGI for various income ranges: 0.7% for AGIs below $25k, 3.5% for AGIs $25k-50k, 108.4% for AGIs $75k-100k)
Profit/loss from business: +$3,864 (reported on 17.7% of returns)
Here:
+$3,864
State:
+$9,719
(% of AGI for various income ranges: 112.8% for AGIs below $25k, 39.4% for AGIs $25k-50k, 122.5% for AGIs $50k-75k, 41.6% for AGIs $75k-100k, 125.5% for AGIs $100k-200k)
Taxable individual retirement arrangement distribution: $10,183 (reported on 1.7% of returns)
34753:
$10,183
Florida:
$24,823
(% of AGI for various income ranges: 31.4% for AGIs $25k-50k, 156.3% for AGIs $75k-100k)
Total itemized deductions: $24,514 (reported on 4.1% of returns)
Here:
$24,514
State:
$45,393
(% of AGI for various income ranges: 131.4% for AGIs $25k-50k, 199.5% for AGIs $50k-75k, 652.6% for AGIs $75k-100k)
Charity contributions: $5,940 (reported on 2.9% of returns)
Here:
$5,940
State:
$20,178
(% of AGI for various income ranges: 15.3% for AGIs $25k-50k, 34.5% for AGIs $50k-75k, 152.1% for AGIs $75k-100k)
Taxes paid: $5,525 (reported on 3.5% of returns)
34753:
$5,525
State:
$6,967
(% of AGI for various income ranges: 24.3% for AGIs $25k-50k, 33.2% for AGIs $50k-75k, 144.2% for AGIs $75k-100k)
Earned income credit: $2,626 (reported on 28.7% of returns)
Here:
$2,626
State:
$2,306
(% of AGI for various income ranges: 150.8% for AGIs below $25k, 97.3% for AGIs $25k-50k, 3.0% for AGIs $50k-75k)
Percentage of individuals using paid preparers for their 2020 taxes: 94.5%
Here:
94%
State:
92%
(% for various income ranges: 94.5% for AGIs below $25k, 94.9% for AGIs $25k-50k, 94.6% for AGIs $50k-75k, 96.0% for AGIs $75k-100k, 89.5% for AGIs $100k-200k)
Averages for the 2012 tax year for zip code 34753, filed in 2013:
Average Adjusted Gross Income (AGI) in 2012: $31,030 (Individual Income Tax Returns)
Here:
$31,030
State:
$60,316
Salary/wage: $30,158 (reported on 91.7% of returns)
Here:
$30,158
State:
$45,277
(% of AGI for various income ranges: 84.8% for AGIs below $25k, 93.7% for AGIs $25k-50k, 93.1% for AGIs $50k-75k, 91.6% for AGIs $75k-100k, 71.8% for AGIs $100k-200k)
Taxable interest for individuals: $440 (reported on 8.7% of returns)
This zip code:
$440
Florida:
$3,587
(% of AGI for various income ranges: 0.1% for AGIs below $25k, 0.2% for AGIs $25k-50k, 0.1% for AGIs $50k-75k)
Ordinary dividends: $2,588 (reported on 3.5% of returns)
Here:
$2,588
State:
$12,831
(% of AGI for various income ranges: 0.4% for AGIs below $25k, 0.5% for AGIs $25k-50k, 0.1% for AGIs $50k-75k)
Profit/loss from business: +$5,384 (reported on 13.9% of returns)
Here:
+$5,384
State:
+$10,012
(% of AGI for various income ranges: 8.0% for AGIs below $25k, 1.5% for AGIs $25k-50k)
Taxable individual retirement arrangement distribution: $4,900 (reported on 1.7% of returns)
34753:
$4,900
Florida:
$21,544
(% of AGI for various income ranges: 0.7% for AGIs below $25k, 0.3% for AGIs $25k-50k)
Total itemized deductions: $16,493 (30% of AGI, reported on 12.2% of returns)
Here:
$16,493
State:
$25,533
Here:
30.5% of AGI
State:
18.0% of AGI
(% of AGI for various income ranges: 3.4% for AGIs below $25k, 6.4% for AGIs $25k-50k, 8.4% for AGIs $50k-75k, 7.5% for AGIs $75k-100k, 8.7% for AGIs $100k-200k)
Charity contributions: $2,774 (reported on 8.3% of returns)
Here:
$2,774
State:
$5,698
(% of AGI for various income ranges: 0.3% for AGIs below $25k, 0.4% for AGIs $25k-50k, 1.2% for AGIs $50k-75k, 1.3% for AGIs $75k-100k, 1.1% for AGIs $100k-200k)
Taxes paid: $2,488 (reported on 11.3% of returns)
34753:
$2,488
State:
$6,203
(% of AGI for various income ranges: 0.4% for AGIs below $25k, 0.7% for AGIs $25k-50k, 1.0% for AGIs $50k-75k, 1.2% for AGIs $75k-100k, 2.3% for AGIs $100k-200k)
Earned income credit: $2,779 (reported on 37.0% of returns)
Here:
$2,779
State:
$2,372
(% of AGI for various income ranges: 10.7% for AGIs below $25k, 2.3% for AGIs $25k-50k)
Percentage of individuals using paid preparers for their 2012 taxes: 53.0%
Here:
53%
State:
54%
(% for various income ranges: 54.5% for AGIs below $25k, 51.4% for AGIs $25k-50k, 52.0% for AGIs $50k-75k, 44.4% for AGIs $75k-100k, 60.0% for AGIs $100k-200k)
Averages for the 2004 tax year for zip code 34753, filed in 2005:
Average Adjusted Gross Income (AGI) in 2004: $28,440 (Individual Income Tax Returns)
Here:
$28,440
State:
$50,523
Salary/wage: $27,252 (reported on 93.6% of returns)
Here:
$27,252
State:
$39,563
(% of AGI for various income ranges: 96.3% for AGIs below $10k, 90.6% for AGIs $10k-25k, 94.8% for AGIs $25k-50k, 93.5% for AGIs $50k-75k, 90.0% for AGIs $75k-100k, 34.4% for AGIs over 100k)
Taxable interest for individuals: $332 (reported on 15.4% of returns)
This zip code:
$332
Florida:
$3,211
(% of AGI for various income ranges: 1.0% for AGIs below $10k, 0.2% for AGIs $10k-25k, 0.2% for AGIs $25k-50k, 0.1% for AGIs $50k-75k, 0.0% for AGIs $75k-100k)
Taxable dividends: $205 (reported on 4.4% of returns)
Here:
$205
State:
$6,129
(% of AGI for various income ranges: 0.1% for AGIs below $10k, 0.0% for AGIs $10k-25k, 0.0% for AGIs $25k-50k, 0.0% for AGIs $50k-75k)
Net capital gain/loss: +$2,786 (reported on 4.4% of returns)
Here:
+$2,786
State:
+$27,205
(% of AGI for various income ranges: 0.1% for AGIs below $10k, 0.0% for AGIs $10k-25k, 0.4% for AGIs $25k-50k, 0.1% for AGIs $50k-75k, 3.1% for AGIs $75k-100k)
Profit/loss from business: +$4,557 (reported on 10.2% of returns)
Here:
+$4,557
State:
+$10,634
(% of AGI for various income ranges: 6.4% for AGIs below $10k, 4.0% for AGIs $10k-25k, 0.9% for AGIs $25k-50k, 1.0% for AGIs $50k-75k)
IRA payment deduction: $2,083 (reported on 0.6% of returns)
34753:
$2,083
Florida:
$3,082
Total itemized deductions: $13,691 (29% of AGI, reported on 20.0% of returns)
Here:
$13,691
State:
$20,370
Here:
29.4% of AGI
State:
20.7% of AGI
(% of AGI for various income ranges: 7.9% for AGIs below $10k, 5.2% for AGIs $10k-25k, 10.7% for AGIs $25k-50k, 12.4% for AGIs $50k-75k, 10.4% for AGIs $75k-100k, 7.3% for AGIs over 100k)
Charity contributions deductions: $2,000 (4% of AGI, reported on 14.4% of returns)
Here:
$2,000
State:
$4,064
Here:
3.9% of AGI
State:
3.8% of AGI
(% of AGI for various income ranges: 0.4% for AGIs $10k-25k, 0.9% for AGIs $25k-50k, 1.6% for AGIs $50k-75k, 1.6% for AGIs $75k-100k, 1.1% for AGIs over 100k)
Total tax: $3,027 (reported on 57.4% of returns)
34753:
$3,027
State:
$9,431
(% of AGI for various income ranges: 1.8% for AGIs below $10k, 2.9% for AGIs $10k-25k, 4.5% for AGIs $25k-50k, 7.8% for AGIs $50k-75k, 9.7% for AGIs $75k-100k, 19.3% for AGIs over 100k)
Earned income credit: $1,971 (reported on 32.8% of returns)
Here:
$1,971
State:
$1,808
Percentage of individuals using paid preparers for their 2004 taxes: 65.4%
Here:
65%
State:
60%
(% for various income ranges: 62.3% for AGIs below $10k, 70.6% for AGIs $10k-25k, 65.6% for AGIs $25k-50k, 56.0% for AGIs $50k-75k, 60.0% for AGIs $75k-100k, 66.7% for AGIs over 100k)
Household received Food Stamps/SNAP in the past 12 months: 407 Household did not receive Food Stamps/SNAP in the past 12 months: 1,769
Women who had a birth in the past 12 months: 140 (120 now married, 23 unmarried) Women who did not have a birth in the past 12 months: 1,993 (1,292 now married, 703 unmarried)
Housing units in zip code 34753 with a mortgage: 1,245 Median monthly owner costs for units with a mortgage: $1,400 Median monthly owner costs for units without a mortgage: $463
Residents with income below the poverty level in 2022:
This zip code:
9.1%
Whole state:
12.7%
Residents with income below 50% of the poverty level in 2022:
This zip code:
7.3%
Whole state:
6.6%
Median number of rooms in houses and condos:
Here:
6.2
State:
5.9
Median number of rooms in apartments:
Here:
4.5
State:
4.2
Notable locations in this zip code not listed on our city pages
Notable locations in zip code 34753: Mascotte City Hall (A), The City of Mascotte Fire Department (B), Mascotte Fire Department Station 91 (C), Mascotte Police Department (D), Lake - Sumter Emergency Medical Services Station 311 (E). Display/hide their locations on the map
Churches in zip code 34753 include: Church of God of Prophecy (A), Mascotte United Methodist Church (B), First Missionary Baptist Church (C), Land Mark Missionary Baptist Church (D), Iglesia Bautista La Hermosa (E), Lighthouse of Hope Community Church (F). Display/hide their locations on the map
Lakes: Lake Jackson (A), Knight Lake (B), Sunset Lake (C), Lake Linda (D), Little Bluff Lake (E), Dukes Lake (F), Gallows Lake (G). Display/hide their locations on the map
In group quarters: 17 (-1 institutionalized population)
Size of family households: 578 2-persons, 378 3-persons, 338 4-persons, 423 5-persons, 102 6-persons
Size of nonfamily households: 214 1-person, 102 2-persons, 38 3-persons
1,831 married couples with children.
308 single-parent households (81 men, 227 women).
64.1% of residents of 34753 zip code speak English at home.
34.2% of residents speak Spanish at home (79% very well, 10% well, 8% not well, 4% not at all).
0.1% of residents speak other Indo-European language at home (100% well).
0.1% of residents speak Asian or Pacific Island language at home (100% very well).
Foreign born population: 702 (9.8%) (52.1% of them are naturalized citizens)
This zip code:
9.8%
Whole state:
21.7%
53%Honduras
14%Uruguay
12%Ecuador
6%Haiti
5%Dominican Republic
3%Malaysia
2%Chile
30%American
6%Irish
3%English
1%Guyanese
1%British West Indian
1%Canadian
0%German
Year of entry for the foreign-born population
3332010 or later
2352000 to 2009
2871990 to 1999
346Before 1990
Facilities with environmental interests located in this zip code:
MASCOTTE ELEMENTARY SCHOOL (513 ALBROOK STREET in MASCOTTE, FL)
STATE MASTER (FDM) - WAFR-FLA010496, DOMESTIC WASTEWATER PROGRAM (National Center for Education Statistics) - STATE ID-0541 Business SIC classification: SEWERAGE SYSTEMS Organizations: LAKE COUNTY SCHOOL BOARD, HERMAN KICKLIGHTER,DIR., LCSB (CONTACT/APPLICANT)
, LCSB (CONTACT/PERMIT)
, LAKE COUNTY SCHOOL DISTRICT (SCHOOL DISTRICT)
LAKE JACKSON RIDGE (SUNSET AVE/LAKE JACKSON DR in MASCOTTE, FL)
National Pollutant Discharge Elimination System NON-MAJOR (Tracking pollutant discharge elimination systems) - permit Organizations: CRAIG ROUHIER (CONTACT/OWNER)
ADVANCED AUTO INC (731 EAST MEYERS BOULEVARD in MASCOTTE, FL)
(Resource Conservation and Recovery Act (tracking hazardous waste)) Organizations: NON NOTIFIER (CONTACT/OWNER)
LAKE JACKSON RIDGE (BLUFF LAKE RD in MASCOTTE, FL)
National Pollutant Discharge Elimination System NON-MAJOR (Tracking pollutant discharge elimination systems) - permit Organizations: KYLE UPPER (CONTACT/OWNER)
PANTRY #6298 (451 E MYERS BLVD in MASCOTTE, FL)
National Pollutant Discharge Elimination System NON-MAJOR (Tracking pollutant discharge elimination systems) - permit
HUNTLEY JIFFY FOOD STORES #298 (451 W MYERS in MASCOTTE, FL)
Small Quantity Generators, between 100 kg and 1000 kg of hazardous waste/month (Resource Conservation and Recovery Act (tracking hazardous waste)) - notification Organizations: ROBERT ARENBURGH, ENVIRON SPEC (CONTACT/OWNER)
POSTAL COLONY CO INC (622 MYERS BOULEVARD in MASCOTTE, FL)
Small Quantity Generators, between 100 kg and 1000 kg of hazardous waste/month (Resource Conservation and Recovery Act (tracking hazardous waste)) Organizations: HARLEY MATHIS, PKG HOUSE MGR (CONTACT/OWNER)
COMBUSTION SVC COMPANY INC (140 WEST MEYERS BLVD in MASCOTTE, FL)
Small Quantity Generators, between 100 kg and 1000 kg of hazardous waste/month (Resource Conservation and Recovery Act (tracking hazardous waste)) Organizations: STEVE DAUGHERTY (CONTACT/OWNER)
CITY OF MASCOTTE (529 E MYERS BLVD in MASCOTTE, FL)
CRITERIA AND HAZARDOUS AIR POLLUTANT INVENTORY (Inventory of air pollution sources) Business SIC classification: REFUSE SYSTEMS
94.4%Electricity
3.5%No fuel used
1.8%Utility gas
Place of birth for U.S.-born residents:
This state: 4,036
Northeast: 702
Midwest: 487
South: 499
West: 185
54% of the 34753 zip code residents lived in the same house 5 years ago. Out of people who lived in different houses, 51% lived in this county. Out of people who lived in different counties, 50% lived in Florida.
94% of the 34753 zip code residents lived in the same house 1 year ago. Out of people who lived in different houses, 49% moved from this county. Out of people who lived in different houses, 38% moved from different county within same state. Out of people who lived in different houses, 3% moved from different state. Out of people who lived in different houses, 12% moved from abroad.
Private vs. public school enrollment:
Students in private schools in grades 1 to 8 (elementary and middle school): 88
Here:
9.3%
Florida:
15.8%
Students in private schools in grades 9 to 12 (high school): 198
Here:
41.4%
Florida:
12.9%
Students in private undergraduate colleges: 30
Here:
38.2%
Florida:
23.6%
Occupation by median earnings in the past 12 months ($)
72,033Fire fighting and prevention, and other protective service workers including supervisors
70,013Health diagnosing and treating practitioners and other technical occupations
56,656Transportation occupations
52,842Architecture and engineering occupations
49,086Production occupations
46,040Installation, maintenance, and repair occupations
Top industries in this zip code by the number of employees in 2005:
Accommodation and Food Services: Full-Service Restaurants (20-49 employees: 1 establishment)
Health Care and Social Assistance: Child Day Care Services (10-19: 1)
Wholesale Trade: Motor Vehicle Supplies and New Parts Merchant Wholesalers (5-9: 1)
Administrative and Support and Waste Management and Remediation Services: Landscaping Services (1-4: 2)
Construction: Residential Remodelers (1-4: 2)
People in group quarters in 2010:
9 people in emergency and transitional shelters (with sleeping facilities) for people experiencing homelessness
People in group quarters in 2000:
11 people in nursing homes
Fatal accident statistics in 2013:
Fatal accident count: 1
Vehicles involved in fatal accidents: 3
Fatal accidents caused by drunken drivers: 0
Fatalities: 2
Persons involved in fatal accidents: 3
Pedestrians involved in fatal accidents: 0
Fatal accident statistics in 2010:
Fatal accident count: 1
Vehicles involved in fatal accidents: 1
Fatal accidents caused by drunken drivers: 0
Fatalities: 1
Persons involved in fatal accidents: 1
Pedestrians involved in fatal accidents: 1
Home Mortgage Disclosure Act Aggregated Statistics For Year 2009 (Based on 2 partial tracts)
A) FHA, FSA/RHS & VA Home Purchase Loans
B) Conventional Home Purchase Loans
C) Refinancings
D) Home Improvement Loans
E) Loans on Dwellings For 5+ Families
F) Non-occupant Loans on < 5 Family Dwellings (A B C & D)
G) Loans On Manufactured Home Dwelling (A B C & D)
Number
Average Value
Number
Average Value
Number
Average Value
Number
Average Value
Number
Average Value
Number
Average Value
Number
Average Value
LOANS ORIGINATED
64
$115,513
40
$121,310
75
$161,191
2
$69,890
1
$9,857,270
20
$107,890
4
$95,112
APPLICATIONS APPROVED, NOT ACCEPTED
4
$127,438
3
$117,937
14
$151,913
1
$15,720
0
$0
2
$139,995
1
$31,010
APPLICATIONS DENIED
22
$119,862
10
$102,866
61
$195,157
5
$46,912
0
$0
10
$124,139
5
$115,578
APPLICATIONS WITHDRAWN
7
$127,296
3
$87,070
31
$168,492
0
$0
0
$0
3
$126,817
0
$0
FILES CLOSED FOR INCOMPLETENESS
4
$114,770
1
$111,380
7
$217,214
0
$0
0
$0
0
$0
0
$0
Aggregated Statistics For Year 2008 (Based on 2 partial tracts)
A) FHA, FSA/RHS & VA Home Purchase Loans
B) Conventional Home Purchase Loans
C) Refinancings
D) Home Improvement Loans
F) Non-occupant Loans on < 5 Family Dwellings (A B C & D)
G) Loans On Manufactured Home Dwelling (A B C & D)
Number
Average Value
Number
Average Value
Number
Average Value
Number
Average Value
Number
Average Value
Number
Average Value
LOANS ORIGINATED
55
$164,126
54
$162,991
69
$167,244
3
$38,730
21
$150,467
4
$128,528
APPLICATIONS APPROVED, NOT ACCEPTED
2
$157,905
14
$125,361
16
$168,195
1
$92,600
3
$145,453
7
$71,947
APPLICATIONS DENIED
16
$154,027
24
$168,823
96
$203,148
14
$107,328
12
$167,040
11
$118,770
APPLICATIONS WITHDRAWN
10
$154,627
13
$174,015
29
$210,447
3
$126,527
3
$182,583
0
$0
FILES CLOSED FOR INCOMPLETENESS
3
$127,690
3
$139,047
12
$238,747
1
$61,150
1
$124,920
1
$137,160
Aggregated Statistics For Year 2007 (Based on 2 partial tracts)
A) FHA, FSA/RHS & VA Home Purchase Loans
B) Conventional Home Purchase Loans
C) Refinancings
D) Home Improvement Loans
F) Non-occupant Loans on < 5 Family Dwellings (A B C & D)
G) Loans On Manufactured Home Dwelling (A B C & D)
Number
Average Value
Number
Average Value
Number
Average Value
Number
Average Value
Number
Average Value
Number
Average Value
LOANS ORIGINATED
31
$222,472
183
$188,218
193
$180,532
23
$89,753
54
$172,229
13
$88,671
APPLICATIONS APPROVED, NOT ACCEPTED
2
$131,260
26
$210,857
49
$179,881
7
$65,831
8
$203,768
4
$102,320
APPLICATIONS DENIED
6
$195,250
62
$190,445
198
$200,851
28
$89,435
29
$195,626
6
$78,842
APPLICATIONS WITHDRAWN
7
$199,867
40
$178,924
79
$194,111
7
$119,246
10
$188,217
2
$106,360
FILES CLOSED FOR INCOMPLETENESS
0
$0
13
$169,209
27
$198,663
2
$300,955
6
$223,132
1
$159,430
Aggregated Statistics For Year 2006 (Based on 2 partial tracts)
A) FHA, FSA/RHS & VA Home Purchase Loans
B) Conventional Home Purchase Loans
C) Refinancings
D) Home Improvement Loans
F) Non-occupant Loans on < 5 Family Dwellings (A B C & D)
G) Loans On Manufactured Home Dwelling (A B C & D)
Number
Average Value
Number
Average Value
Number
Average Value
Number
Average Value
Number
Average Value
Number
Average Value
LOANS ORIGINATED
10
$207,393
432
$180,284
288
$177,594
37
$110,109
153
$193,588
15
$107,861
APPLICATIONS APPROVED, NOT ACCEPTED
0
$0
60
$168,852
67
$180,574
11
$100,385
20
$175,222
6
$81,245
APPLICATIONS DENIED
2
$210,975
109
$169,074
182
$194,597
35
$78,824
38
$182,249
12
$110,110
APPLICATIONS WITHDRAWN
3
$161,907
71
$184,250
127
$169,396
6
$170,498
31
$168,689
1
$122,740
FILES CLOSED FOR INCOMPLETENESS
0
$0
18
$178,918
30
$197,026
2
$122,305
8
$224,734
1
$96,100
Aggregated Statistics For Year 2005 (Based on 2 partial tracts)
A) FHA, FSA/RHS & VA Home Purchase Loans
B) Conventional Home Purchase Loans
C) Refinancings
D) Home Improvement Loans
F) Non-occupant Loans on < 5 Family Dwellings (A B C & D)
G) Loans On Manufactured Home Dwelling (A B C & D)
Number
Average Value
Number
Average Value
Number
Average Value
Number
Average Value
Number
Average Value
Number
Average Value
LOANS ORIGINATED
30
$167,775
420
$147,175
272
$150,947
25
$92,567
138
$147,499
13
$83,732
APPLICATIONS APPROVED, NOT ACCEPTED
0
$0
42
$131,591
40
$140,431
7
$82,493
10
$133,792
6
$93,840
APPLICATIONS DENIED
2
$175,810
92
$140,412
152
$147,489
35
$59,804
32
$127,546
14
$90,074
APPLICATIONS WITHDRAWN
2
$146,765
61
$146,672
140
$148,153
15
$118,402
19
$148,144
6
$135,700
FILES CLOSED FOR INCOMPLETENESS
1
$196,120
11
$128,498
31
$148,244
4
$82,228
3
$140,360
0
$0
Aggregated Statistics For Year 2004 (Based on 2 partial tracts)
A) FHA, FSA/RHS & VA Home Purchase Loans
B) Conventional Home Purchase Loans
C) Refinancings
D) Home Improvement Loans
F) Non-occupant Loans on < 5 Family Dwellings (A B C & D)
G) Loans On Manufactured Home Dwelling (A B C & D)
Number
Average Value
Number
Average Value
Number
Average Value
Number
Average Value
Number
Average Value
Number
Average Value
LOANS ORIGINATED
32
$125,730
245
$124,042
128
$123,277
17
$32,709
55
$116,864
14
$71,604
APPLICATIONS APPROVED, NOT ACCEPTED
3
$106,433
34
$110,356
31
$131,984
3
$36,400
10
$106,273
4
$65,302
APPLICATIONS DENIED
2
$120,775
53
$120,244
134
$114,957
31
$38,297
12
$112,294
17
$65,186
APPLICATIONS WITHDRAWN
6
$106,507
23
$130,698
94
$123,006
4
$77,970
5
$109,636
5
$107,452
FILES CLOSED FOR INCOMPLETENESS
1
$165,550
7
$116,813
16
$140,704
1
$28,390
2
$130,165
0
$0
Aggregated Statistics For Year 2003 (Based on 2 partial tracts)
A) FHA, FSA/RHS & VA Home Purchase Loans
B) Conventional Home Purchase Loans
C) Refinancings
D) Home Improvement Loans
F) Non-occupant Loans on < 5 Family Dwellings (A B C & D)
Number
Average Value
Number
Average Value
Number
Average Value
Number
Average Value
Number
Average Value
LOANS ORIGINATED
54
$115,364
172
$111,978
247
$116,047
7
$33,321
49
$105,572
APPLICATIONS APPROVED, NOT ACCEPTED
2
$134,100
13
$116,928
36
$110,171
2
$26,210
3
$91,147
APPLICATIONS DENIED
12
$107,125
28
$105,097
113
$97,561
15
$31,537
5
$73,470
APPLICATIONS WITHDRAWN
5
$103,872
24
$112,476
62
$110,827
1
$37,560
5
$95,048
FILES CLOSED FOR INCOMPLETENESS
0
$0
5
$124,662
10
$89,893
1
$24,020
0
$0
Aggregated Statistics For Year 1999 (Based on 1 partial tract)
A) FHA, FSA/RHS & VA Home Purchase Loans
B) Conventional Home Purchase Loans
C) Refinancings
D) Home Improvement Loans
F) Non-occupant Loans on < 5 Family Dwellings (A B C & D)
Detailed PMIC statistics for the following Tracts:0312.01
2002 - 2018 National Fire Incident Reporting System (NFIRS) incidents
According to the data from the years 2002 - 2018 the average number of fires per year is 31. The highest number of fires - 45 took place in 2006, and the least - 19 in 2002. The data has an increasing trend.
When looking into fire subcategories, the most reports belonged to: Outside Fires (49.5%), and Structure Fires (33.1%).
Fire incident types reported to NFIRS in Zip Code 34753


 Nearest zip codes: 34736, 34711, 34737, 33514, 34797, 34715.


 According to the data from the years 2002 - 2018 the average number of fires per year is 31. The highest number of fires - 45 took place in 2006, and the least - 19 in 2002. The data has an increasing trend.
 When looking into fire subcategories, the most reports belonged to: Outside Fires (49.5%), and Structure Fires (33.1%).