Estimated zip code population in 2022: 6,734 Zip code population in 2010: 6,030 Zip code population in 2000: 5,156
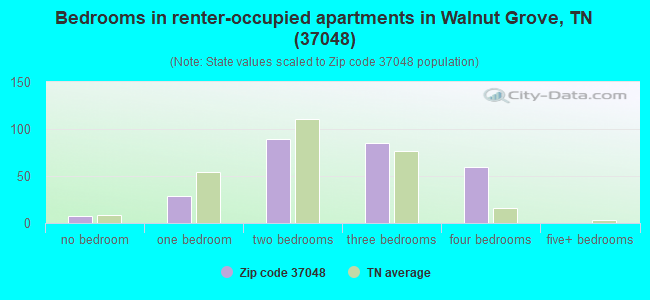
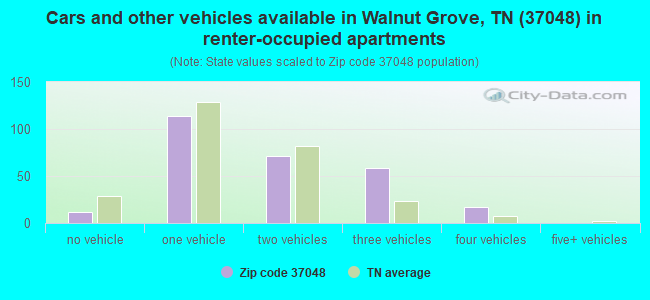
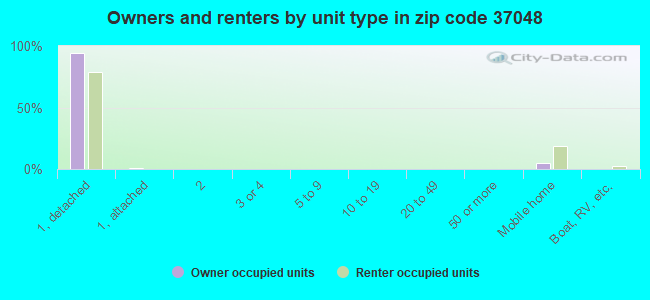
Houses and condos: 2,634 Renter-occupied apartments: 269
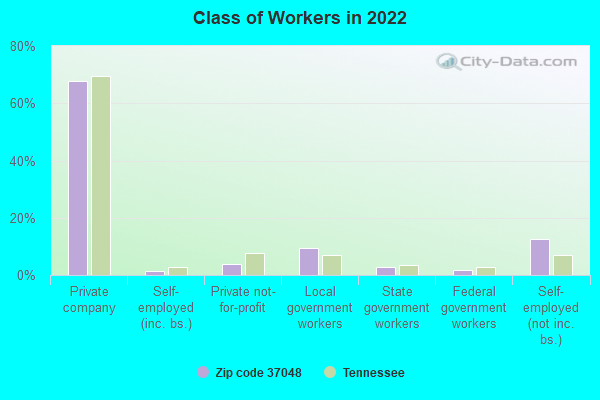
% of renters here:
11%
State:
33%
March 2022 cost of living index in zip code 37048: 81.1 (low, U.S. average is 100)
Land area: 44.0 sq. mi. Water area: 0.0 sq. mi.
Population density: 153 people per square mile
(very low).
OSM Map
General Map
Google Map
MSN Map
OSM Map
General Map
Google Map
MSN Map
OSM Map
General Map
Google Map
MSN Map
OSM Map
General Map
Google Map
MSN Map
Please wait while loading the map...
Real estate property taxes paid for housing units in 2022:
This zip code:
0.4% ($1,665)
Tennessee:
0.5% ($1,376)
Median real estate property taxes paid for housing units with mortgages in 2022: $1,646 (0.4%) Median real estate property taxes paid for housing units with no mortgage in 2022: $1,683 (0.4%)
Business Search- 14 Million verified businesses
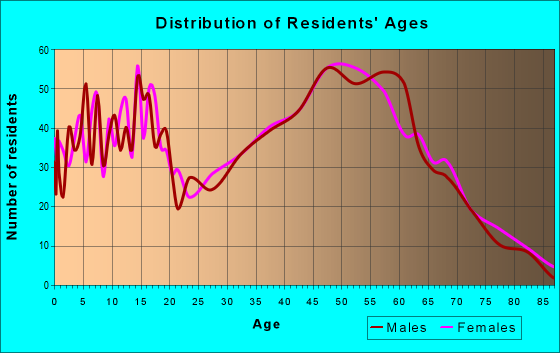
Males: 3,386
(50.3%)
Females: 3,348
(49.7%)
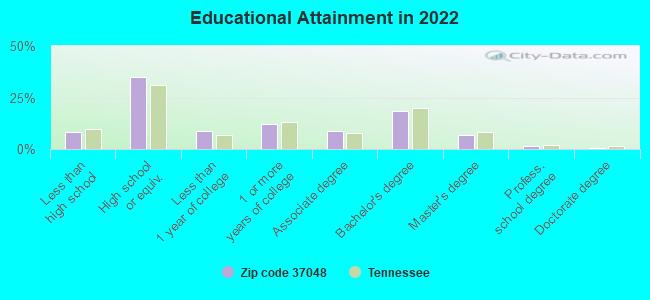
For population 25 years and over in 37048:
High school or higher: 92.0%
Bachelor's degree or higher: 27.5%
Graduate or professional degree: 9.2%
Unemployed: 1.4%
Mean travel time to work (commute): 31.2 minutes
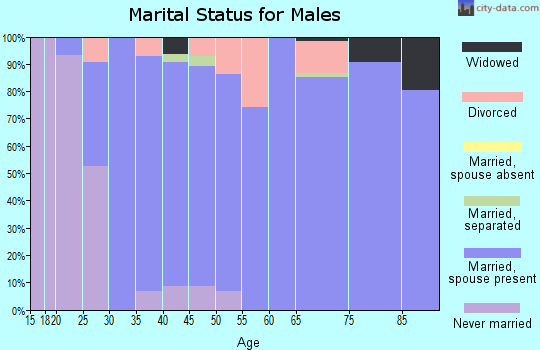
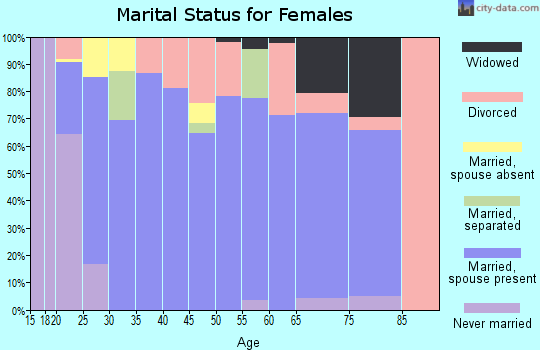
For population 15 years and over in 37048:
Never married: 17.1%
Now married: 66.1%
Separated: 0.8%
Widowed: 6.2%
Divorced: 9.7%
Zip code 37048 compared to state average:
Unemployed percentage below state average.
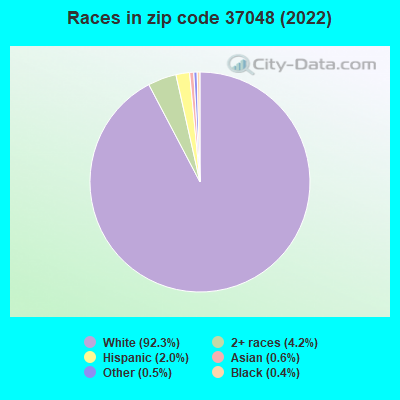
Black race population percentage significantly below state average.
Hispanic race population percentage significantly below state average.
Median age above state average.
Foreign-born population percentage significantly below state average.
Renting percentage significantly below state average.
Length of stay since moving in above state average.
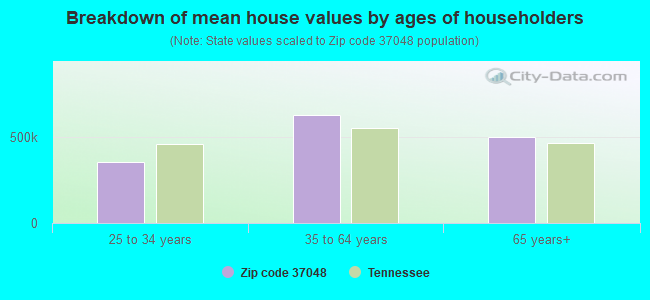
Estimated median house/condo value in 2022: $421,985
37048:
$421,985
Tennessee:
$284,800
According to our research of Tennessee and other state lists, there were 4 registered sex offenders living in 37048 zip code as of April 26, 2024. The ratio of all residents to sex offenders in zip code 37048 is 1,624 to 1. The ratio of registered sex offenders to all residents in this zip code is much lower than the state average.
Median resident age:
This zip code:
43.2 years
Tennessee median age:
39.2 years
Average household size:
This zip code:
2.7 people
Tennessee:
2.4 people
Averages for the 2020 tax year for zip code 37048, filed in 2021:
Average Adjusted Gross Income (AGI) in 2020: $76,167 (Individual Income Tax Returns)
Here:
$76,167
State:
$69,014
Salary/wage: $67,380 (reported on 80.6% of returns)
Here:
$67,380
State:
$55,872
(% of AGI for various income ranges: 1028.9% for AGIs below $25k, 3287.8% for AGIs $25k-50k, 6038.1% for AGIs $50k-75k, 9270.0% for AGIs $75k-100k, 17718.4% for AGIs $100k-200k, 48107.1% for AGIs over 200k)
Taxable interest for individuals: $1,094 (reported on 32.7% of returns)
This zip code:
$1,094
Tennessee:
$1,945
(% of AGI for various income ranges: 28.7% for AGIs below $25k, 34.2% for AGIs $25k-50k, 67.7% for AGIs $50k-75k, 32.2% for AGIs $75k-100k, 56.8% for AGIs $100k-200k, 338.6% for AGIs over 200k)
Ordinary dividends: $4,647 (reported on 15.9% of returns)
Here:
$4,647
State:
$8,105
(% of AGI for various income ranges: 18.6% for AGIs below $25k, 32.2% for AGIs $25k-50k, 98.7% for AGIs $50k-75k, 131.9% for AGIs $75k-100k, 158.2% for AGIs $100k-200k, 1048.6% for AGIs over 200k)
Net capital gain/loss in AGI: +$21,107 (reported on 14.9% of returns)
Here:
+$21,107
State:
+$33,664
(% of AGI for various income ranges: 5.5% for AGIs below $25k, 19.6% for AGIs $25k-50k, 76.1% for AGIs $50k-75k, 168.5% for AGIs $75k-100k, 447.6% for AGIs $100k-200k, 10262.9% for AGIs over 200k)
Profit/loss from business: +$25,721 (reported on 20.4% of returns)
Here:
+$25,721
State:
+$18,991
(% of AGI for various income ranges: 210.0% for AGIs below $25k, 284.0% for AGIs $25k-50k, 580.6% for AGIs $50k-75k, 453.7% for AGIs $75k-100k, 1136.6% for AGIs $100k-200k, 8708.6% for AGIs over 200k)
Taxable individual retirement arrangement distribution: $16,250 (reported on 8.4% of returns)
37048:
$16,250
Tennessee:
$20,036
(% of AGI for various income ranges: 60.6% for AGIs below $25k, 119.8% for AGIs $25k-50k, 139.0% for AGIs $50k-75k, 161.9% for AGIs $75k-100k, 623.7% for AGIs $100k-200k)
Total itemized deductions: $33,939 (reported on 7.4% of returns)
Here:
$33,939
State:
$40,136
(% of AGI for various income ranges: 112.7% for AGIs below $25k, 222.9% for AGIs $50k-75k, 275.9% for AGIs $75k-100k, 628.7% for AGIs $100k-200k, 4657.1% for AGIs over 200k)
Charity contributions: $14,068 (reported on 6.1% of returns)
Here:
$14,068
State:
$19,852
(% of AGI for various income ranges: 135.8% for AGIs $50k-75k, 175.0% for AGIs $100k-200k, 2267.1% for AGIs over 200k)
Taxes paid: $5,387 (reported on 7.4% of returns)
37048:
$5,387
State:
$6,038
(% of AGI for various income ranges: 13.1% for AGIs below $25k, 33.2% for AGIs $50k-75k, 32.2% for AGIs $75k-100k, 115.5% for AGIs $100k-200k, 751.4% for AGIs over 200k)
Earned income credit: $2,289 (reported on 11.3% of returns)
Here:
$2,289
State:
$2,391
(% of AGI for various income ranges: 75.6% for AGIs below $25k, 63.4% for AGIs $25k-50k)
Percentage of individuals using paid preparers for their 2020 taxes: 93.9%
Here:
94%
State:
93%
(% for various income ranges: 93.1% for AGIs below $25k, 95.2% for AGIs $25k-50k, 93.2% for AGIs $50k-75k, 94.6% for AGIs $75k-100k, 93.5% for AGIs $100k-200k, 94.1% for AGIs over 200k)
Averages for the 2012 tax year for zip code 37048, filed in 2013:
Average Adjusted Gross Income (AGI) in 2012: $56,835 (Individual Income Tax Returns)
Here:
$56,835
State:
$53,767
Salary/wage: $50,455 (reported on 84.5% of returns)
Here:
$50,455
State:
$45,421
(% of AGI for various income ranges: 71.2% for AGIs below $25k, 76.0% for AGIs $25k-50k, 76.7% for AGIs $50k-75k, 80.2% for AGIs $75k-100k, 79.0% for AGIs $100k-200k, 53.7% for AGIs over 200k)
Taxable interest for individuals: $1,012 (reported on 35.1% of returns)
This zip code:
$1,012
Tennessee:
$1,732
(% of AGI for various income ranges: 2.1% for AGIs below $25k, 0.9% for AGIs $25k-50k, 0.8% for AGIs $50k-75k, 0.5% for AGIs $75k-100k, 0.3% for AGIs $100k-200k, 0.2% for AGIs over 200k)
Ordinary dividends: $2,574 (reported on 13.5% of returns)
Here:
$2,574
State:
$6,739
(% of AGI for various income ranges: 0.8% for AGIs below $25k, 0.5% for AGIs $25k-50k, 0.6% for AGIs $50k-75k, 0.3% for AGIs $75k-100k, 0.7% for AGIs $100k-200k, 0.9% for AGIs over 200k)
Net capital gain/loss in AGI: +$8,226 (reported on 12.4% of returns)
Here:
+$8,226
State:
+$19,082
(% of AGI for various income ranges: 0.8% for AGIs $50k-75k, 1.0% for AGIs $75k-100k, 0.9% for AGIs $100k-200k, 10.4% for AGIs over 200k)
Profit/loss from business: +$16,340 (reported on 20.7% of returns)
Here:
+$16,340
State:
+$15,240
(% of AGI for various income ranges: 10.2% for AGIs below $25k, 6.6% for AGIs $25k-50k, 3.9% for AGIs $50k-75k, 4.7% for AGIs $75k-100k, 8.7% for AGIs $100k-200k)
Taxable individual retirement arrangement distribution: $13,023 (reported on 10.4% of returns)
37048:
$13,023
Tennessee:
$15,505
(% of AGI for various income ranges: 3.6% for AGIs below $25k, 3.4% for AGIs $25k-50k, 2.0% for AGIs $50k-75k, 2.2% for AGIs $75k-100k, 2.8% for AGIs $100k-200k)
Total itemized deductions: $19,814 (20% of AGI, reported on 29.5% of returns)
Here:
$19,814
State:
$21,976
Here:
20.4% of AGI
State:
17.8% of AGI
(% of AGI for various income ranges: 9.4% for AGIs below $25k, 9.4% for AGIs $25k-50k, 9.4% for AGIs $50k-75k, 10.8% for AGIs $75k-100k, 11.8% for AGIs $100k-200k, 8.2% for AGIs over 200k)
Charity contributions: $5,542 (reported on 24.7% of returns)
Here:
$5,542
State:
$6,709
(% of AGI for various income ranges: 1.4% for AGIs below $25k, 1.5% for AGIs $25k-50k, 2.0% for AGIs $50k-75k, 2.2% for AGIs $75k-100k, 3.1% for AGIs $100k-200k, 3.2% for AGIs over 200k)
Taxes paid: $4,077 (reported on 29.1% of returns)
37048:
$4,077
State:
$4,829
(% of AGI for various income ranges: 1.2% for AGIs below $25k, 1.6% for AGIs $25k-50k, 1.8% for AGIs $50k-75k, 2.2% for AGIs $75k-100k, 2.6% for AGIs $100k-200k, 2.0% for AGIs over 200k)
Earned income credit: $2,122 (reported on 16.3% of returns)
Here:
$2,122
State:
$2,404
(% of AGI for various income ranges: 6.0% for AGIs below $25k, 1.3% for AGIs $25k-50k)
Percentage of individuals using paid preparers for their 2012 taxes: 54.2%
Here:
54%
State:
52%
(% for various income ranges: 48.3% for AGIs below $25k, 53.6% for AGIs $25k-50k, 55.0% for AGIs $50k-75k, 60.0% for AGIs $75k-100k, 58.8% for AGIs $100k-200k, 100.0% for AGIs over 200k)
Averages for the 2004 tax year for zip code 37048, filed in 2005:
Average Adjusted Gross Income (AGI) in 2004: $44,652 (Individual Income Tax Returns)
Here:
$44,652
State:
$44,088
Salary/wage: $42,591 (reported on 85.6% of returns)
Here:
$42,591
State:
$38,825
(% of AGI for various income ranges: 102.1% for AGIs below $10k, 77.0% for AGIs $10k-25k, 82.6% for AGIs $25k-50k, 86.8% for AGIs $50k-75k, 86.0% for AGIs $75k-100k, 73.1% for AGIs over 100k)
Taxable interest for individuals: $1,064 (reported on 43.5% of returns)
This zip code:
$1,064
Tennessee:
$1,802
(% of AGI for various income ranges: 4.7% for AGIs below $10k, 2.9% for AGIs $10k-25k, 1.5% for AGIs $25k-50k, 0.5% for AGIs $50k-75k, 1.0% for AGIs $75k-100k, 0.4% for AGIs over 100k)
Taxable dividends: $1,101 (reported on 16.1% of returns)
Here:
$1,101
State:
$3,727
(% of AGI for various income ranges: 0.6% for AGIs below $10k, 0.4% for AGIs $10k-25k, 0.3% for AGIs $25k-50k, 0.3% for AGIs $50k-75k, 0.2% for AGIs $75k-100k, 0.6% for AGIs over 100k)
Net capital gain/loss: +$6,795 (reported on 13.4% of returns)
Here:
+$6,795
State:
+$15,776
(% of AGI for various income ranges: -1.0% for AGIs below $10k, 0.2% for AGIs $10k-25k, 1.8% for AGIs $25k-50k, 1.0% for AGIs $50k-75k, 1.3% for AGIs $75k-100k, 4.4% for AGIs over 100k)
Profit/loss from business: +$12,020 (reported on 21.8% of returns)
Here:
+$12,020
State:
+$12,882
(% of AGI for various income ranges: 11.4% for AGIs below $10k, 4.4% for AGIs $10k-25k, 6.7% for AGIs $25k-50k, 4.0% for AGIs $50k-75k, 3.8% for AGIs $75k-100k, 8.7% for AGIs over 100k)
IRA payment deduction: $3,083 (reported on 2.1% of returns)
37048:
$3,083
Tennessee:
$2,934
Self-employed pension: $8,800 (reported on 0.4% of returns)
Here:
$8,800
Tennessee:
$16,857
Total itemized deductions: $15,996 (22% of AGI, reported on 32.1% of returns)
Here:
$15,996
State:
$18,035
Here:
22.1% of AGI
State:
19.9% of AGI
(% of AGI for various income ranges: 9.8% for AGIs below $10k, 8.9% for AGIs $10k-25k, 11.3% for AGIs $25k-50k, 11.4% for AGIs $50k-75k, 14.2% for AGIs $75k-100k, 10.5% for AGIs over 100k)
Charity contributions deductions: $3,752 (5% of AGI, reported on 27.4% of returns)
Here:
$3,752
State:
$5,167
Here:
4.9% of AGI
State:
5.3% of AGI
(% of AGI for various income ranges: 0.6% for AGIs below $10k, 1.1% for AGIs $10k-25k, 1.8% for AGIs $25k-50k, 2.0% for AGIs $50k-75k, 2.8% for AGIs $75k-100k, 3.1% for AGIs over 100k)
Total tax: $5,971 (reported on 78.9% of returns)
37048:
$5,971
State:
$7,482
(% of AGI for various income ranges: 4.3% for AGIs below $10k, 4.3% for AGIs $10k-25k, 6.9% for AGIs $25k-50k, 8.6% for AGIs $50k-75k, 10.1% for AGIs $75k-100k, 17.7% for AGIs over 100k)
Earned income credit: $1,551 (reported on 13.3% of returns)
Here:
$1,551
State:
$1,826
Percentage of individuals using paid preparers for their 2004 taxes: 60.4%
Here:
60%
State:
60%
(% for various income ranges: 52.7% for AGIs below $10k, 61.0% for AGIs $10k-25k, 62.7% for AGIs $25k-50k, 61.0% for AGIs $50k-75k, 63.1% for AGIs $75k-100k, 66.9% for AGIs over 100k)
Household received Food Stamps/SNAP in the past 12 months: 114 Household did not receive Food Stamps/SNAP in the past 12 months: 2,416
Women who had a birth in the past 12 months: 71 (72 now married, 0 unmarried) Women who did not have a birth in the past 12 months: 1,307 (795 now married, 513 unmarried)
Housing units in zip code 37048 with a mortgage: 1,209 (173 second mortgage, 44 home equity loan, 138 both second mortgage and home equity loan) Houses without a mortgage: 57
Median monthly owner costs for units with a mortgage: $1,725 Median monthly owner costs for units without a mortgage: $491
Residents with income below the poverty level in 2022:
This zip code:
5.6%
Whole state:
13.3%
Residents with income below 50% of the poverty level in 2022:
This zip code:
1.7%
Whole state:
7.1%
Median number of rooms in houses and condos:
Here:
7.1
State:
6.5
Median number of rooms in apartments:
Here:
5.2
State:
4.4
Notable locations in this zip code not listed on our city pages
Notable locations in zip code 37048: Highland Volunteer Fire Department Station 2 (A), Cottontown Fire Association (B). Display/hide their locations on the map
Churches in zip code 37048 include: Little Bethel Church (A), Station Camp Church (B), Cottontown Church of Christ (C), Strother Church (D), Walnut Grove United Methodist Church (E), Cottontown Baptist Church (F), Pleasant Valley Church (G), Horseshoe Church (H), Old Friendship Church (I). Display/hide their locations on the map
Cemeteries: Strother Cemetery (1), Upchurch Cemetery (2), Jones Cemetery (3), Walnut Grove Cemetery (4), Friendship Cemetery (5), Oak Grove Cemetery (6), Pleasant Valley Cemetery (7). Display/hide their locations on the map
Streams, rivers, and creeks: Locke Branch (A), Liggett Branch (B), Cedarcroft Branch (C), Maxwell Branch (D), Pee Dee Creek (E), Arterburn Branch (F), Roney Creek (G), Strother Branch (H). Display/hide their locations on the map
1,158 married couples with children.
190 single-parent households (106 men, 84 women).
98.3% of residents of 37048 zip code speak English at home.
0.8% of residents speak Spanish at home (71% very well, 10% well, 20% not at all).
0.4% of residents speak other Indo-European language at home (100% very well).
0.2% of residents speak other language at home (100% very well).
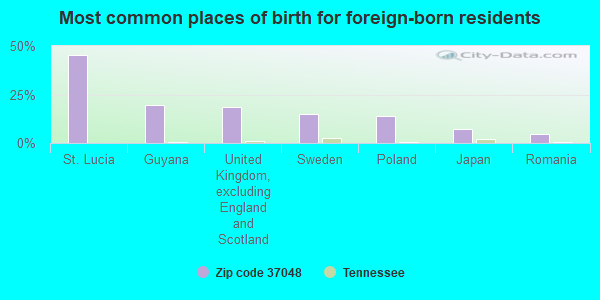
Foreign born population: 86 (1.3%) (78.0% of them are naturalized citizens)
This zip code:
1.3%
Whole state:
5.6%
45%St. Lucia
20%Guyana
19%United Kingdom, excluding England and Scotland
15%Sweden
14%Poland
7%Japan
5%Romania
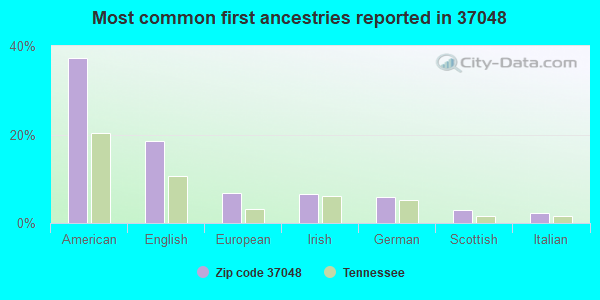
37%American
19%English
7%European
6%Irish
6%German
3%Scottish
2%Italian
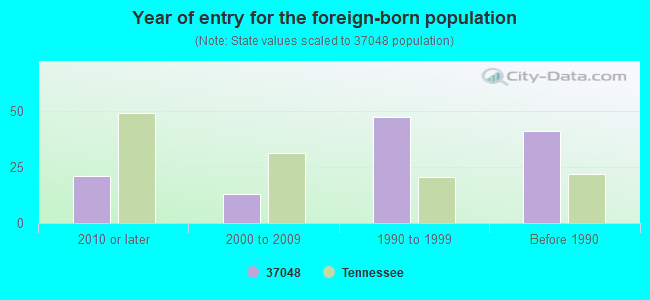
Year of entry for the foreign-born population
212010 or later
132000 to 2009
471990 to 1999
41Before 1990
Facilities with environmental interests located in this zip code:
COMMANCHE PRODUCTS (RURAL ROUTE 2 in COTTONTOWN, TN)
(Resource Conservation and Recovery Act (tracking hazardous waste)) Business NAICS classification: MOTORCYCLE, BICYCLE, AND PARTS MANUFACTURING.
Housing units lacking complete plumbing facilities: 1.9% Housing units lacking complete kitchen facilities: 3.7%
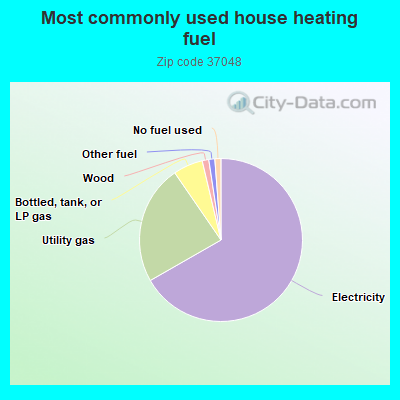
66.8%Electricity
23.7%Utility gas
5.9%Bottled, tank, or LP gas
1.3%Wood
1.2%Other fuel
1.2%No fuel used
Population in 1990: 4,724. Population change in the 1990s: +432 (+9.1%).
Place of birth for U.S.-born residents:
This state: 4,094
Northeast: 234
Midwest: 796
South: 1,047
West: 422
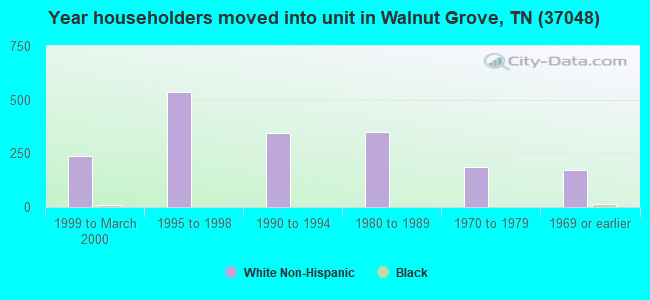
62% of the 37048 zip code residents lived in the same house 5 years ago. Out of people who lived in different houses, 36% lived in this county. Out of people who lived in different counties, 50% lived in Tennessee.
91% of the 37048 zip code residents lived in the same house 1 year ago. Out of people who lived in different houses, 52% moved from this county. Out of people who lived in different houses, 16% moved from different county within same state. Out of people who lived in different houses, 32% moved from different state.
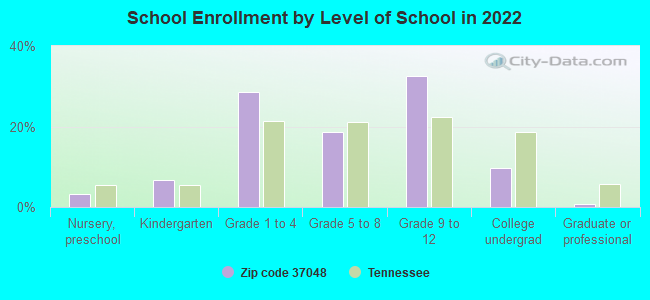
Private vs. public school enrollment:
Students in private schools in grades 1 to 8 (elementary and middle school): 235
Here:
31.6%
Tennessee:
15.0%
Students in private schools in grades 9 to 12 (high school): 61
Here:
12.0%
Tennessee:
16.2%
Students in private undergraduate colleges: 28
Here:
18.2%
Tennessee:
23.5%
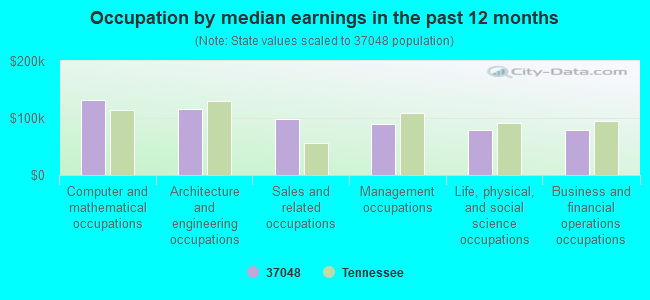
Occupation by median earnings in the past 12 months ($)
131,790Computer and mathematical occupations
115,203Architecture and engineering occupations
98,723Sales and related occupations
88,639Management occupations
79,559Life, physical, and social science occupations
78,651Business and financial operations occupations
Top industries in this zip code by the number of employees in 2005:
Wholesale Trade: Sporting and Recreational Goods and Supplies Merchant Wholesalers (10-19 employees: 1 establishment)
Construction: Electrical Contractors (10-19: 1)
Health Care and Social Assistance: Child Day Care Services (5-9: 1)
Construction: Drywall and Insulation Contractors (5-9: 1)
Wholesale Trade: Recyclable Material Merchant Wholesalers (5-9: 1)
Construction: Masonry Contractors (5-9: 1)
Other Services (except Public Administration): Drycleaning and Laundry Services (except Coin-Operated) (5-9: 1)
Administrative and Support and Waste Management and Remediation Services: Landscaping Services (1-4: 2)
People in group quarters in 2000:
8 people in agriculture workers' dormitories on farms
Fatal accident statistics in 2014:
Fatal accident count: 1
Vehicles involved in fatal accidents: 2
Fatal accidents caused by drunken drivers: 1
Fatalities: 1
Persons involved in fatal accidents: 3
Pedestrians involved in fatal accidents: 0
Fatal accident statistics in 2013:
Fatal accident count: 1
Vehicles involved in fatal accidents: 1
Fatal accidents caused by drunken drivers: 0
Fatalities: 1
Persons involved in fatal accidents: 1
Pedestrians involved in fatal accidents: 0
Home Mortgage Disclosure Act Aggregated Statistics For Year 2009 (Based on 4 partial tracts)
A) FHA, FSA/RHS & VA Home Purchase Loans
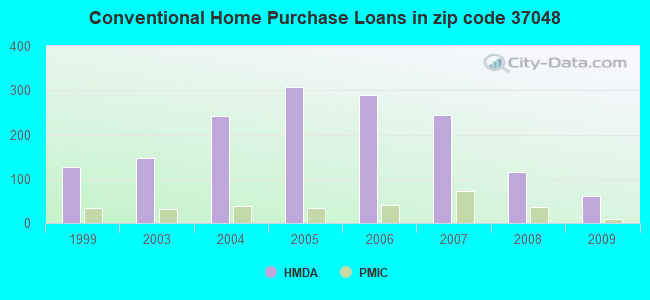
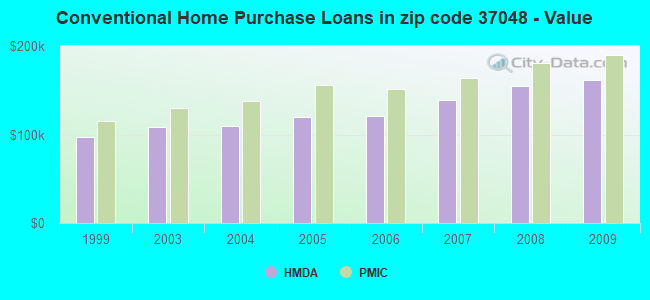
B) Conventional Home Purchase Loans
C) Refinancings
D) Home Improvement Loans
F) Non-occupant Loans on < 5 Family Dwellings (A B C & D)
G) Loans On Manufactured Home Dwelling (A B C & D)
Number
Average Value
Number
Average Value
Number
Average Value
Number
Average Value
Number
Average Value
Number
Average Value
LOANS ORIGINATED
103
$158,587
61
$161,300
419
$156,989
7
$35,131
34
$116,931
17
$46,513
APPLICATIONS APPROVED, NOT ACCEPTED
2
$145,145
5
$83,046
28
$140,809
5
$6,362
2
$69,000
2
$40,595
APPLICATIONS DENIED
8
$129,501
10
$117,149
125
$161,658
15
$47,095
8
$121,580
5
$73,902
APPLICATIONS WITHDRAWN
17
$154,000
12
$166,032
86
$165,839
5
$86,290
1
$171,260
1
$100,040
FILES CLOSED FOR INCOMPLETENESS
2
$94,105
2
$253,215
13
$180,665
1
$33,910
2
$101,735
0
$0
Aggregated Statistics For Year 2008 (Based on 4 partial tracts)
A) FHA, FSA/RHS & VA Home Purchase Loans
B) Conventional Home Purchase Loans
C) Refinancings
D) Home Improvement Loans
E) Loans on Dwellings For 5+ Families
F) Non-occupant Loans on < 5 Family Dwellings (A B C & D)
G) Loans On Manufactured Home Dwelling (A B C & D)
Number
Average Value
Number
Average Value
Number
Average Value
Number
Average Value
Number
Average Value
Number
Average Value
Number
Average Value
LOANS ORIGINATED
59
$158,336
116
$154,462
271
$154,665
27
$65,913
0
$0
44
$112,162
22
$66,887
APPLICATIONS APPROVED, NOT ACCEPTED
1
$113,610
12
$226,752
30
$187,631
7
$51,017
0
$0
1
$370,400
2
$91,690
APPLICATIONS DENIED
2
$199,100
6
$114,205
151
$151,264
31
$33,076
1
$1,025,710
7
$52,009
15
$69,510
APPLICATIONS WITHDRAWN
4
$209,618
24
$182,277
77
$158,416
6
$33,125
0
$0
7
$116,723
5
$74,320
FILES CLOSED FOR INCOMPLETENESS
1
$212,270
0
$0
11
$158,175
1
$178,040
0
$0
0
$0
0
$0
Aggregated Statistics For Year 2007 (Based on 4 partial tracts)
A) FHA, FSA/RHS & VA Home Purchase Loans
B) Conventional Home Purchase Loans
C) Refinancings
D) Home Improvement Loans
F) Non-occupant Loans on < 5 Family Dwellings (A B C & D)
G) Loans On Manufactured Home Dwelling (A B C & D)
Number
Average Value
Number
Average Value
Number
Average Value
Number
Average Value
Number
Average Value
Number
Average Value
LOANS ORIGINATED
51
$147,578
243
$139,354
255
$145,708
51
$54,929
42
$119,475
22
$62,967
APPLICATIONS APPROVED, NOT ACCEPTED
0
$0
21
$115,994
46
$150,040
7
$40,260
3
$89,867
3
$99,903
APPLICATIONS DENIED
6
$110,073
28
$130,143
192
$141,881
26
$46,922
7
$141,090
5
$73,234
APPLICATIONS WITHDRAWN
8
$155,910
32
$135,766
82
$145,379
6
$68,788
3
$102,580
2
$70,220
FILES CLOSED FOR INCOMPLETENESS
1
$128,020
2
$108,095
23
$161,338
0
$0
1
$111,910
0
$0
Aggregated Statistics For Year 2006 (Based on 4 partial tracts)
A) FHA, FSA/RHS & VA Home Purchase Loans
B) Conventional Home Purchase Loans
C) Refinancings
D) Home Improvement Loans
F) Non-occupant Loans on < 5 Family Dwellings (A B C & D)
G) Loans On Manufactured Home Dwelling (A B C & D)
Number
Average Value
Number
Average Value
Number
Average Value
Number
Average Value
Number
Average Value
Number
Average Value
LOANS ORIGINATED
37
$164,746
289
$121,127
273
$118,500
38
$37,183
44
$110,235
19
$75,516
APPLICATIONS APPROVED, NOT ACCEPTED
1
$223,820
29
$114,100
48
$131,331
6
$29,328
0
$0
0
$0
APPLICATIONS DENIED
7
$141,480
48
$104,713
181
$130,047
32
$52,423
9
$106,434
10
$88,919
APPLICATIONS WITHDRAWN
6
$115,442
17
$132,414
136
$131,112
7
$43,127
3
$70,933
7
$114,376
FILES CLOSED FOR INCOMPLETENESS
0
$0
14
$138,981
33
$125,652
2
$63,585
2
$132,275
0
$0
Aggregated Statistics For Year 2005 (Based on 4 partial tracts)
A) FHA, FSA/RHS & VA Home Purchase Loans
B) Conventional Home Purchase Loans
C) Refinancings
D) Home Improvement Loans
E) Loans on Dwellings For 5+ Families
F) Non-occupant Loans on < 5 Family Dwellings (A B C & D)
G) Loans On Manufactured Home Dwelling (A B C & D)
Number
Average Value
Number
Average Value
Number
Average Value
Number
Average Value
Number
Average Value
Number
Average Value
Number
Average Value
LOANS ORIGINATED
56
$137,334
308
$119,796
325
$115,101
36
$37,806
1
$368,970
38
$98,532
13
$75,164
APPLICATIONS APPROVED, NOT ACCEPTED
3
$101,453
35
$109,598
52
$121,366
4
$39,852
0
$0
5
$125,304
4
$24,462
APPLICATIONS DENIED
5
$93,424
59
$95,214
206
$128,886
36
$34,445
0
$0
12
$124,116
22
$62,653
APPLICATIONS WITHDRAWN
3
$135,083
31
$126,861
164
$133,877
18
$90,056
0
$0
5
$100,764
3
$112,287
FILES CLOSED FOR INCOMPLETENESS
0
$0
8
$105,021
19
$230,780
4
$69,908
0
$0
0
$0
0
$0
Aggregated Statistics For Year 2004 (Based on 4 partial tracts)
A) FHA, FSA/RHS & VA Home Purchase Loans
B) Conventional Home Purchase Loans
C) Refinancings
D) Home Improvement Loans
F) Non-occupant Loans on < 5 Family Dwellings (A B C & D)
G) Loans On Manufactured Home Dwelling (A B C & D)
Number
Average Value
Number
Average Value
Number
Average Value
Number
Average Value
Number
Average Value
Number
Average Value
LOANS ORIGINATED
62
$134,250
242
$109,262
364
$116,256
32
$30,912
25
$79,390
32
$59,684
APPLICATIONS APPROVED, NOT ACCEPTED
3
$124,060
25
$113,243
75
$106,151
10
$30,662
5
$67,774
4
$63,602
APPLICATIONS DENIED
9
$106,552
57
$83,625
226
$110,331
34
$35,124
10
$67,717
29
$58,498
APPLICATIONS WITHDRAWN
9
$89,422
32
$113,334
153
$112,704
9
$27,242
6
$66,253
2
$88,930
FILES CLOSED FOR INCOMPLETENESS
2
$91,140
10
$85,510
17
$123,919
2
$50,870
0
$0
0
$0
Aggregated Statistics For Year 2003 (Based on 4 partial tracts)
A) FHA, FSA/RHS & VA Home Purchase Loans
B) Conventional Home Purchase Loans
C) Refinancings
D) Home Improvement Loans
F) Non-occupant Loans on < 5 Family Dwellings (A B C & D)
Number
Average Value
Number
Average Value
Number
Average Value
Number
Average Value
Number
Average Value
LOANS ORIGINATED
67
$130,736
148
$108,738
684
$111,385
33
$27,389
26
$80,897
APPLICATIONS APPROVED, NOT ACCEPTED
1
$133,950
16
$75,660
110
$113,119
9
$21,350
3
$98,297
APPLICATIONS DENIED
7
$143,887
24
$84,742
191
$113,114
31
$18,189
7
$51,180
APPLICATIONS WITHDRAWN
5
$70,628
22
$95,760
160
$119,936
5
$23,232
3
$120,953
FILES CLOSED FOR INCOMPLETENESS
0
$0
14
$103,161
26
$102,963
0
$0
0
$0
Aggregated Statistics For Year 1999 (Based on 1 partial tract)
A) FHA, FSA/RHS & VA Home Purchase Loans
B) Conventional Home Purchase Loans
C) Refinancings
D) Home Improvement Loans
F) Non-occupant Loans on < 5 Family Dwellings (A B C & D)
Detailed PMIC statistics for the following Tracts:0204.01
, 0204.02
2002 - 2018 National Fire Incident Reporting System (NFIRS) incidents
According to the data from the years 2002 - 2018 the average number of fire incidents per year is 18. The highest number of reported fire incidents - 30 took place in 2004, and the least - 8 in 2015. The data has a declining trend.
When looking into fire subcategories, the most incidents belonged to: Structure Fires (43.1%), and Outside Fires (41.5%).
Fire incident types reported to NFIRS in Zip Code 37048


 Nearest zip codes: 37188, 37049, 37148, 37075, 37141, 37066.
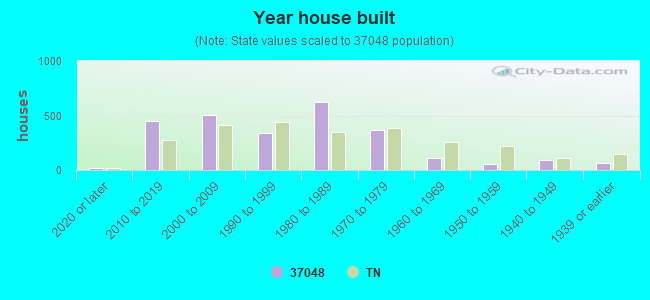


 According to the data from the years 2002 - 2018 the average number of fire incidents per year is 18. The highest number of reported fire incidents - 30 took place in 2004, and the least - 8 in 2015. The data has a declining trend.
 When looking into fire subcategories, the most incidents belonged to: Structure Fires (43.1%), and Outside Fires (41.5%).