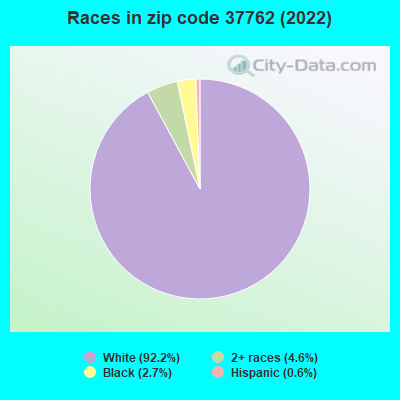
Estimated zip code population in 2022: 2,475 Zip code population in 2010: 3,126 Zip code population in 2000: 3,476
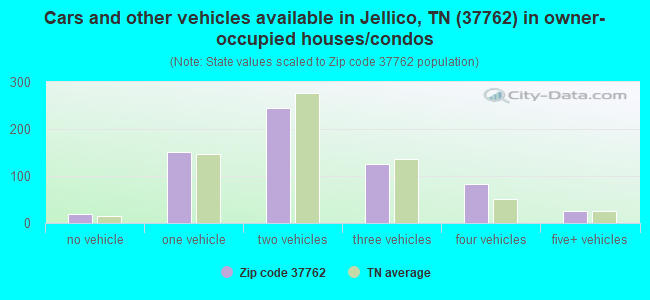
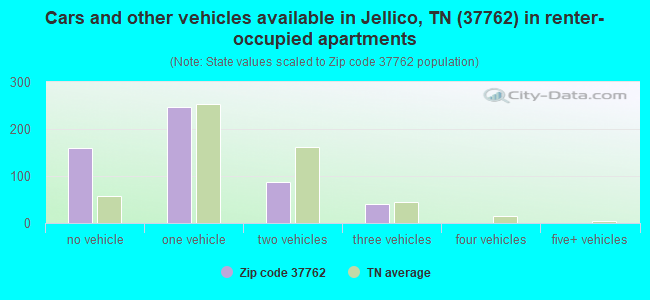
Houses and condos: 1,405 Renter-occupied apartments: 542
% of renters here:
45%
State:
33%
March 2022 cost of living index in zip code 37762: 78.0 (low, U.S. average is 100)
Land area: 13.7 sq. mi. Water area: 0.1 sq. mi.
Population density: 181 people per square mile
(very low).
OSM Map
General Map
Google Map
MSN Map
OSM Map
General Map
Google Map
MSN Map
OSM Map
General Map
Google Map
MSN Map
OSM Map
General Map
Google Map
MSN Map
Please wait while loading the map...
Real estate property taxes paid for housing units in 2022:
This zip code:
0.5% ($814)
Tennessee:
0.5% ($1,376)
Median real estate property taxes paid for housing units with mortgages in 2022: $990 (0.4%) Median real estate property taxes paid for housing units with no mortgage in 2022: $472 (0.5%)
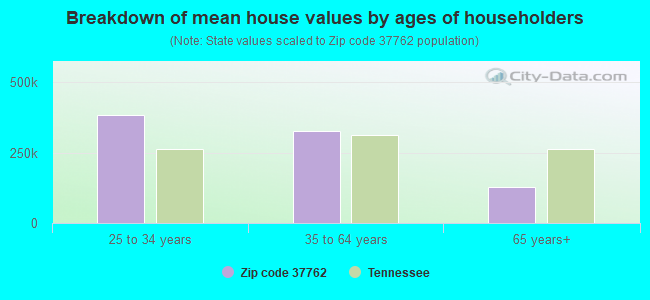
Estimated median house/condo value in 2022: $149,087
37762:
$149,087
Tennessee:
$284,800
According to our research of Tennessee and other state lists, there were 6 registered sex offenders living in 37762 zip code as of June 19, 2024. The ratio of all residents to sex offenders in zip code 37762 is 496 to 1. The ratio of registered sex offenders to all residents in this zip code is lower than the state average.
Median resident age:
This zip code:
52.7 years
Tennessee median age:
39.2 years
Average household size:
This zip code:
2.0 people
Tennessee:
2.4 people
Averages for the 2020 tax year for zip code 37762, filed in 2021:
Average Adjusted Gross Income (AGI) in 2020: $40,818 (Individual Income Tax Returns)
Here:
$40,818
State:
$69,014
Salary/wage: $37,318 (reported on 81.2% of returns)
Here:
$37,318
State:
$55,872
(% of AGI for various income ranges: 1137.2% for AGIs below $25k, 3421.6% for AGIs $25k-50k, 5777.7% for AGIs $50k-75k, 8948.0% for AGIs $75k-100k, 21325.0% for AGIs $100k-200k)
Taxable interest for individuals: $417 (reported on 21.4% of returns)
This zip code:
$417
Tennessee:
$1,945
(% of AGI for various income ranges: 2.6% for AGIs below $25k, 15.2% for AGIs $25k-50k, 9.2% for AGIs $50k-75k, 97.5% for AGIs $100k-200k)
Ordinary dividends: $1,300 (reported on 5.4% of returns)
Here:
$1,300
State:
$8,105
(% of AGI for various income ranges: 10.8% for AGIs $25k-50k, 127.5% for AGIs $100k-200k)
Net capital gain/loss in AGI: +$5,140 (reported on 4.5% of returns)
Here:
+$5,140
State:
+$33,664
(% of AGI for various income ranges: 6.4% for AGIs $25k-50k, 602.5% for AGIs $100k-200k)
Profit/loss from business: +$8,894 (reported on 14.3% of returns)
Here:
+$8,894
State:
+$18,991
(% of AGI for various income ranges: 135.8% for AGIs below $25k, 125.6% for AGIs $25k-50k, 3.8% for AGIs $50k-75k, 1300.0% for AGIs $100k-200k)
Taxable individual retirement arrangement distribution: $7,500 (reported on 3.6% of returns)
37762:
$7,500
Tennessee:
$20,036
(% of AGI for various income ranges: 120.0% for AGIs $25k-50k)
Earned income credit: $2,516 (reported on 27.7% of returns)
Here:
$2,516
State:
$2,391
(% of AGI for various income ranges: 120.9% for AGIs below $25k, 104.0% for AGIs $25k-50k)
Percentage of individuals using paid preparers for their 2020 taxes: 93.8%
Here:
94%
State:
93%
(% for various income ranges: 96.1% for AGIs below $25k, 93.3% for AGIs $25k-50k, 93.8% for AGIs $50k-75k, 85.7% for AGIs $75k-100k, 87.5% for AGIs $100k-200k)
Averages for the 2012 tax year for zip code 37762, filed in 2013:
Average Adjusted Gross Income (AGI) in 2012: $34,957 (Individual Income Tax Returns)
Here:
$34,957
State:
$53,767
Salary/wage: $31,991 (reported on 83.2% of returns)
Here:
$31,991
State:
$45,421
(% of AGI for various income ranges: 73.2% for AGIs below $25k, 85.4% for AGIs $25k-50k, 82.6% for AGIs $50k-75k, 72.9% for AGIs $75k-100k, 65.0% for AGIs $100k-200k)
Taxable interest for individuals: $957 (reported on 20.4% of returns)
This zip code:
$957
Tennessee:
$1,732
(% of AGI for various income ranges: 0.9% for AGIs below $25k, 0.4% for AGIs $25k-50k, 0.2% for AGIs $50k-75k, 0.6% for AGIs $75k-100k, 0.7% for AGIs $100k-200k)
Ordinary dividends: $533 (reported on 5.3% of returns)
Here:
$533
State:
$6,739
Profit/loss from business: +$7,118 (reported on 19.5% of returns)
Here:
+$7,118
State:
+$15,240
(% of AGI for various income ranges: 10.5% for AGIs below $25k, 2.5% for AGIs $25k-50k, 6.4% for AGIs $50k-75k)
Taxable individual retirement arrangement distribution: $5,500 (reported on 3.5% of returns)
37762:
$5,500
Tennessee:
$15,505
Total itemized deductions: $21,960 (22% of AGI, reported on 8.8% of returns)
Here:
$21,960
State:
$21,976
Here:
22.2% of AGI
State:
17.8% of AGI
(% of AGI for various income ranges: 5.3% for AGIs $25k-50k, 11.1% for AGIs $50k-75k, 8.1% for AGIs $100k-200k)
Charity contributions: $9,643 (reported on 6.2% of returns)
Here:
$9,643
State:
$6,709
(% of AGI for various income ranges: 3.6% for AGIs $50k-75k, 3.9% for AGIs $100k-200k)
Taxes paid: $3,920 (reported on 8.8% of returns)
37762:
$3,920
State:
$4,829
(% of AGI for various income ranges: 0.7% for AGIs $25k-50k, 1.7% for AGIs $50k-75k, 1.9% for AGIs $100k-200k)
Earned income credit: $2,489 (reported on 33.6% of returns)
Here:
$2,489
State:
$2,404
(% of AGI for various income ranges: 10.4% for AGIs below $25k, 1.6% for AGIs $25k-50k)
Percentage of individuals using paid preparers for their 2012 taxes: 66.4%
Here:
66%
State:
52%
(% for various income ranges: 66.1% for AGIs below $25k, 63.0% for AGIs $25k-50k, 76.9% for AGIs $50k-75k, 60.0% for AGIs $75k-100k, 66.7% for AGIs $100k-200k)
Averages for the 2004 tax year for zip code 37762, filed in 2005:
Average Adjusted Gross Income (AGI) in 2004: $29,120 (Individual Income Tax Returns)
Here:
$29,120
State:
$44,088
Salary/wage: $26,665 (reported on 87.1% of returns)
Here:
$26,665
State:
$38,825
(% of AGI for various income ranges: 117.0% for AGIs below $10k, 80.2% for AGIs $10k-25k, 88.7% for AGIs $25k-50k, 85.7% for AGIs $50k-75k, 69.2% for AGIs $75k-100k, 59.2% for AGIs over 100k)
Taxable interest for individuals: $1,361 (reported on 26.0% of returns)
This zip code:
$1,361
Tennessee:
$1,802
(% of AGI for various income ranges: 2.5% for AGIs below $10k, 1.2% for AGIs $10k-25k, 1.0% for AGIs $25k-50k, 0.4% for AGIs $50k-75k, 2.5% for AGIs $75k-100k, 1.5% for AGIs over 100k)
Taxable dividends: $376 (reported on 7.2% of returns)
Here:
$376
State:
$3,727
(% of AGI for various income ranges: 0.2% for AGIs below $10k, 0.1% for AGIs $10k-25k, 0.0% for AGIs $25k-50k, 0.1% for AGIs $50k-75k, 0.2% for AGIs over 100k)
Net capital gain/loss: +$4,246 (reported on 5.1% of returns)
Here:
+$4,246
State:
+$15,776
(% of AGI for various income ranges: 0.1% for AGIs $10k-25k, -0.0% for AGIs $25k-50k, -0.2% for AGIs $75k-100k, 3.8% for AGIs over 100k)
Profit/loss from business: +$3,986 (reported on 16.5% of returns)
Here:
+$3,986
State:
+$12,882
(% of AGI for various income ranges: 12.2% for AGIs below $10k, 6.1% for AGIs $10k-25k, 0.8% for AGIs $25k-50k, -1.1% for AGIs $50k-75k, 3.4% for AGIs $75k-100k, 1.4% for AGIs over 100k)
IRA payment deduction: $3,182 (reported on 0.9% of returns)
37762:
$3,182
Tennessee:
$2,934
Total itemized deductions: $19,086 (24% of AGI, reported on 10.0% of returns)
Here:
$19,086
State:
$18,035
Here:
23.5% of AGI
State:
19.9% of AGI
(% of AGI for various income ranges: 2.3% for AGIs $10k-25k, 4.4% for AGIs $25k-50k, 5.9% for AGIs $50k-75k, 7.4% for AGIs $75k-100k, 15.3% for AGIs over 100k)
Charity contributions deductions: $9,211 (10% of AGI, reported on 7.4% of returns)
Here:
$9,211
State:
$5,167
Here:
10.1% of AGI
State:
5.3% of AGI
(% of AGI for various income ranges: 1.1% for AGIs $25k-50k, 1.6% for AGIs $50k-75k, 3.1% for AGIs $75k-100k, 7.2% for AGIs over 100k)
Total tax: $3,971 (reported on 64.8% of returns)
37762:
$3,971
State:
$7,482
(% of AGI for various income ranges: 2.9% for AGIs below $10k, 3.6% for AGIs $10k-25k, 6.3% for AGIs $25k-50k, 8.5% for AGIs $50k-75k, 12.5% for AGIs $75k-100k, 17.6% for AGIs over 100k)
Earned income credit: $2,077 (reported on 30.2% of returns)
Here:
$2,077
State:
$1,826
Percentage of individuals using paid preparers for their 2004 taxes: 72.3%
Here:
72%
State:
60%
(% for various income ranges: 68.4% for AGIs below $10k, 74.8% for AGIs $10k-25k, 72.1% for AGIs $25k-50k, 72.2% for AGIs $50k-75k, 71.1% for AGIs $75k-100k, 77.3% for AGIs over 100k)
Household received Food Stamps/SNAP in the past 12 months: 345 Household did not receive Food Stamps/SNAP in the past 12 months: 838
Women who had a birth in the past 12 months: 76 (77 now married, 0 unmarried) Women who did not have a birth in the past 12 months: 351 (244 now married, 107 unmarried)
Housing units in zip code 37762 with a mortgage: 305 (6 second mortgage, 6 both second mortgage and home equity loan) Median monthly owner costs for units with a mortgage: $1,331 Median monthly owner costs for units without a mortgage: $312
Residents with income below the poverty level in 2022:
This zip code:
19.9%
Whole state:
13.3%
Residents with income below 50% of the poverty level in 2022:
This zip code:
11.6%
Whole state:
7.1%
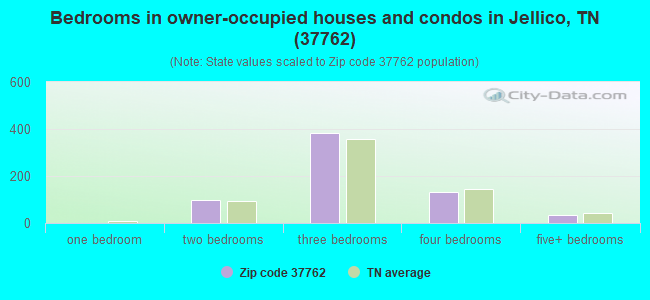
Median number of rooms in houses and condos:
Here:
6.4
State:
6.5
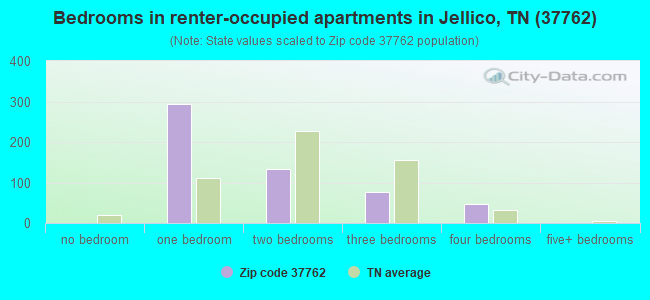
Median number of rooms in apartments:
Here:
3.5
State:
4.4
Notable locations in this zip code not listed on our city pages
Notable locations in zip code 37762: Jellico Water Treatment Plant (A), Oswego Industrial Park (B), Jellico Fire Department (C), Jellico Life Saving and Rescue Squad (D), North Regional EMS (E). Display/hide their locations on the map
Churches in zip code 37762 include: Brickplant Hollow Church (A), Good Hope United Baptist Church (B), Wesleyan Church (C), Tannery Hollow Missionary Baptist Church (D), Jellico United Methodist Church (E), Jellico Church of God (F), High Cliff Missionary Baptist Church (G), First Baptist Church (H), Crouches Creek Baptist Church (I). Display/hide their locations on the map
Cemeteries: Jellico Cemetery (1), Perkins-Archer Cemetery (2), Perkins Cemetery (3), Hoot Owl Cemetery (4), Gibson Cemetery (5), Douglas Cemetery (6), Hackler Cemetery (7). Display/hide their locations on the map
In group quarters: 102 (-1 institutionalized population)
Size of family households: 416 2-persons, 96 3-persons, 112 4-persons, 79 5-persons
Size of nonfamily households: 460 1-person, 25 2-persons
305 married couples with children.
14 single-parent households (14 women).
98.4% of residents of 37762 zip code speak English at home.
0.3% of residents speak Spanish at home (33% not well, 67% not at all).
1.4% of residents speak other Indo-European language at home (100% very well).
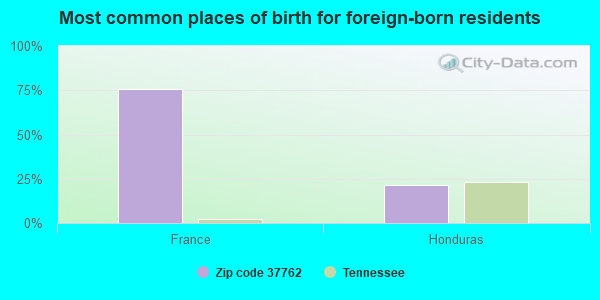
Foreign born population: 37 (1.5%) (52.4% of them are naturalized citizens)
This zip code:
1.5%
Whole state:
5.6%
76%France
22%Honduras
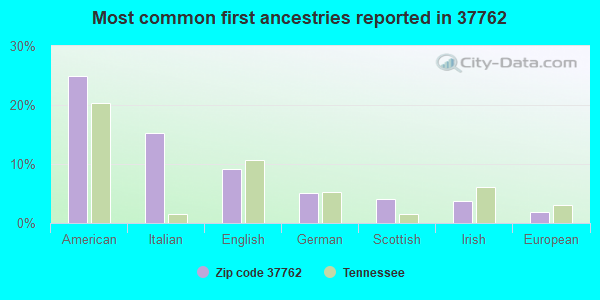
25%American
15%Italian
9%English
5%German
4%Scottish
4%Irish
2%European
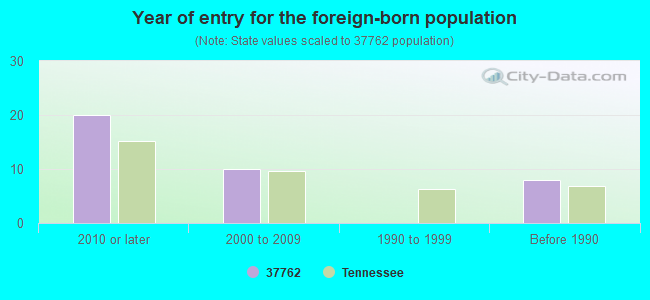
Year of entry for the foreign-born population
202010 or later
102000 to 2009
01990 to 1999
8Before 1990
Facilities with environmental interests located in this zip code:
National Pollutant Discharge Elimination System NON-MAJOR (Tracking pollutant discharge elimination systems) - permit Business SIC classification: CONSTRUCTION SAND AND GRAVEL Organizations: GEORGE SPADLING (CONTACT/OWNER)
Alternative names: GEORGE SPADLING
DEWAYNE ROWE LOGGING & COAL (AREA #1 in JELLICO, TN)
National Pollutant Discharge Elimination System NON-MAJOR (Tracking pollutant discharge elimination systems) - permit Business SIC classification: BITUMINOUS COAL AND LIGNITE SURFACE MINING Alternative names: O'DELL-IRISH, INC.
Housing units lacking complete plumbing facilities: 5.8% Housing units lacking complete kitchen facilities: 6.2%
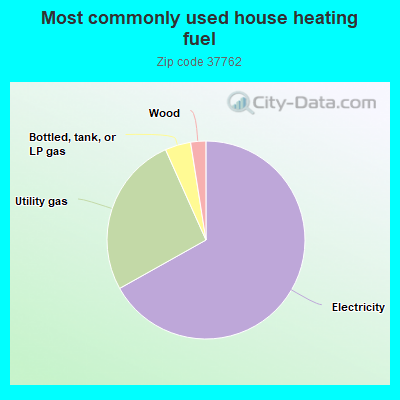
67.0%Electricity
26.5%Utility gas
4.2%Bottled, tank, or LP gas
2.5%Wood
Population in 1990: 6,317.
Place of birth for U.S.-born residents:
This state: 1,507
Northeast: 21
Midwest: 232
South: 610
West: 50
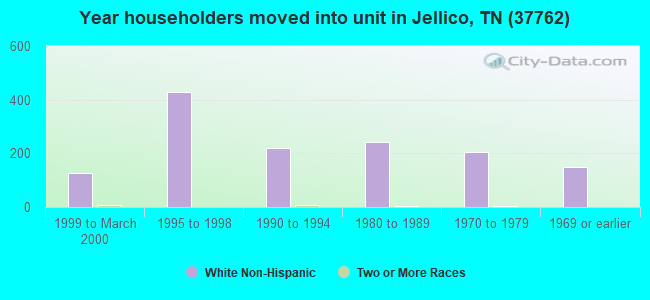
68% of the 37762 zip code residents lived in the same house 5 years ago. Out of people who lived in different houses, 52% lived in this county. Out of people who lived in different counties, 50% lived in Tennessee.
87% of the 37762 zip code residents lived in the same house 1 year ago. Out of people who lived in different houses, 72% moved from this county. Out of people who lived in different houses, 12% moved from different county within same state. Out of people who lived in different houses, 10% moved from different state.
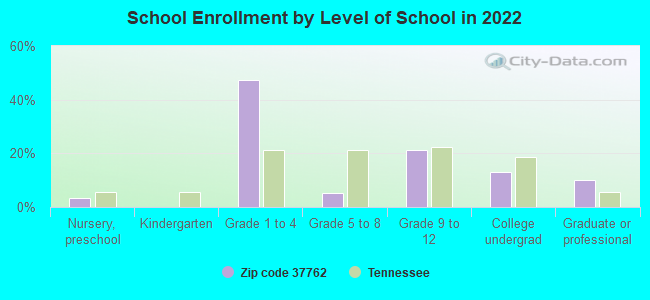
Private vs. public school enrollment:
Students in private schools in grades 1 to 8 (elementary and middle school):
Here:
0.0%
Tennessee:
15.0%
Students in private schools in grades 9 to 12 (high school): 2
Here:
5.0%
Tennessee:
16.2%
Students in private undergraduate colleges:
Here:
0.0%
Tennessee:
23.5%
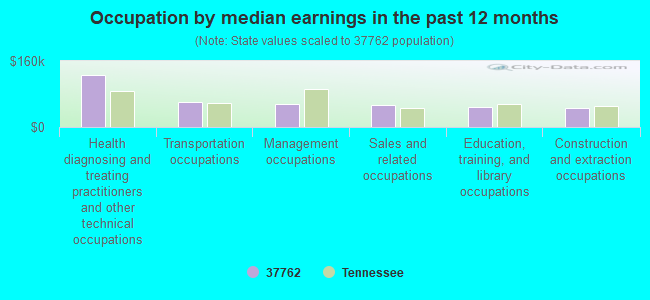
Occupation by median earnings in the past 12 months ($)
127,204Health diagnosing and treating practitioners and other technical occupations
60,294Transportation occupations
56,545Management occupations
53,398Sales and related occupations
48,230Education, training, and library occupations
45,851Construction and extraction occupations
Top industries in this zip code by the number of employees in 2005:
Health Care and Social Assistance: General Medical and Surgical Hospitals (250-499 employees: 1 establishment)
Health Care and Social Assistance: Nursing Care Facilities (100-249: 1, 1-4: 2)
Health Care and Social Assistance: Vocational Rehabilitation Services (100-249: 1)
Health Care and Social Assistance: Offices of Physicians (except Mental Health Specialists) (20-49: 2, 10-19: 1, 1-4: 2)
Finance and Insurance: Commercial Banking (20-49: 1, 5-9: 1)
Accommodation and Food Services: Hotels (except Casino Hotels) and Motels (10-19: 2, 5-9: 1)
People in group quarters in 2010:
92 people in nursing facilities/skilled-nursing facilities
People in group quarters in 2000:
109 people in nursing homes
Fatal accident statistics in 2012:
Fatal accident count: 1
Vehicles involved in fatal accidents: 2
Fatal accidents caused by drunken drivers: 0
Fatalities: 1
Persons involved in fatal accidents: 3
Pedestrians involved in fatal accidents: 0
Fatal accident statistics in 2010:
Fatal accident count: 1
Vehicles involved in fatal accidents: 1
Fatal accidents caused by drunken drivers: 0
Fatalities: 1
Persons involved in fatal accidents: 2
Pedestrians involved in fatal accidents: 0
2002 - 2016 National Fire Incident Reporting System (NFIRS) incidents
Based on the data from the years 2002 - 2016 the average number of fire incidents per year is 34. The highest number of fires - 70 took place in 2009, and the least - 0 in 2015. The data has a declining trend.
When looking into fire subcategories, the most reports belonged to: Mobile Property/Vehicle Fires (30.2%), and Structure Fires (28.1%).
Fire incident types reported to NFIRS in Zip Code 37762


 Nearest zip codes: 37819, 37729, 40769, 37730, 37715, 37766.


 Based on the data from the years 2002 - 2016 the average number of fire incidents per year is 34. The highest number of fires - 70 took place in 2009, and the least - 0 in 2015. The data has a declining trend.
 When looking into fire subcategories, the most reports belonged to: Mobile Property/Vehicle Fires (30.2%), and Structure Fires (28.1%).