Estimated zip code population in 2022: 3,924 Zip code population in 2010: 3,611 Zip code population in 2000: 3,433
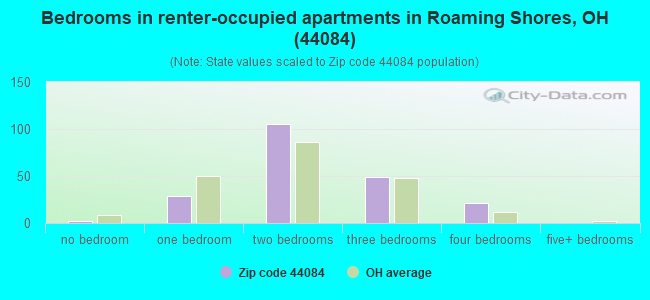
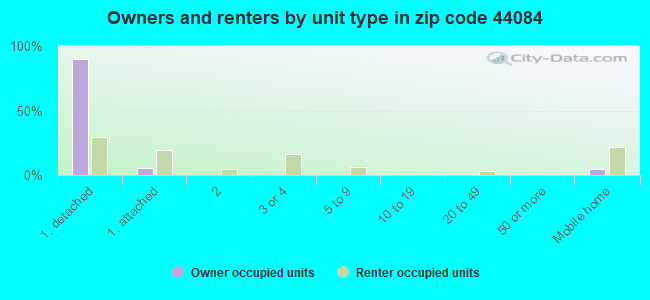
Houses and condos: 1,874 Renter-occupied apartments: 206
% of renters here:
13%
State:
33%
March 2022 cost of living index in zip code 44084: 85.2 (less than average, U.S. average is 100)
Land area: 42.5 sq. mi. Water area: 0.6 sq. mi.
Population density: 92 people per square mile
(very low).
OSM Map
General Map
Google Map
MSN Map
OSM Map
General Map
Google Map
MSN Map
OSM Map
General Map
Google Map
MSN Map
OSM Map
General Map
Google Map
MSN Map
Please wait while loading the map...
Real estate property taxes paid for housing units in 2022:
This zip code:
1.2% ($2,680)
Ohio:
1.3% ($2,639)
Median real estate property taxes paid for housing units with mortgages in 2022: $2,348 (1.1%) Median real estate property taxes paid for housing units with no mortgage in 2022: $3,520 (1.5%)
Estimated median house/condo value in 2022: $218,130
44084:
$218,130
Ohio:
$204,100
According to our research of Ohio and other state lists, there were 4 registered sex offenders living in 44084 zip code as of May 05, 2024. The ratio of all residents to sex offenders in zip code 44084 is 856 to 1. The ratio of registered sex offenders to all residents in this zip code is lower than the state average.
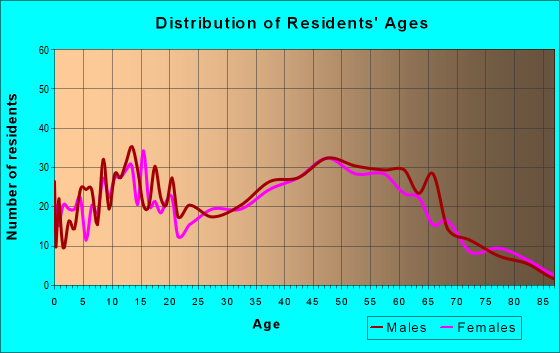
Median resident age:
This zip code:
45.5 years
Ohio median age:
39.9 years
Average household size:
This zip code:
2.4 people
Ohio:
2.4 people
Averages for the 2020 tax year for zip code 44084, filed in 2021:
Average Adjusted Gross Income (AGI) in 2020: $68,782 (Individual Income Tax Returns)
Here:
$68,782
State:
$67,288
Salary/wage: $51,425 (reported on 81.6% of returns)
Here:
$51,425
State:
$55,628
(% of AGI for various income ranges: 1185.4% for AGIs below $25k, 3547.9% for AGIs $25k-50k, 6169.2% for AGIs $50k-75k, 8892.3% for AGIs $75k-100k, 14464.7% for AGIs $100k-200k)
Taxable interest for individuals: $802 (reported on 23.2% of returns)
This zip code:
$802
Ohio:
$1,518
(% of AGI for various income ranges: 6.1% for AGIs below $25k, 12.3% for AGIs $25k-50k, 28.0% for AGIs $50k-75k, 40.8% for AGIs $75k-100k, 52.9% for AGIs $100k-200k)
Ordinary dividends: $3,714 (reported on 15.3% of returns)
Here:
$3,714
State:
$7,167
(% of AGI for various income ranges: 9.0% for AGIs below $25k, 22.1% for AGIs $25k-50k, 52.0% for AGIs $50k-75k, 60.8% for AGIs $75k-100k, 93.5% for AGIs $100k-200k)
Net capital gain/loss in AGI: +$14,455 (reported on 11.6% of returns)
Here:
+$14,455
State:
+$18,919
(% of AGI for various income ranges: 13.7% for AGIs below $25k, 0.3% for AGIs $25k-50k, 109.6% for AGIs $50k-75k, 133.1% for AGIs $75k-100k, 268.2% for AGIs $100k-200k)
Profit/loss from business: +$9,733 (reported on 12.6% of returns)
Here:
+$9,733
State:
+$13,744
(% of AGI for various income ranges: 95.1% for AGIs below $25k, 86.4% for AGIs $25k-50k, 131.2% for AGIs $50k-75k, 266.9% for AGIs $75k-100k, 549.4% for AGIs $100k-200k)
Taxable individual retirement arrangement distribution: $17,495 (reported on 10.0% of returns)
44084:
$17,495
Ohio:
$18,876
(% of AGI for various income ranges: 42.9% for AGIs below $25k, 142.1% for AGIs $25k-50k, 296.4% for AGIs $50k-75k, 383.1% for AGIs $75k-100k, 797.1% for AGIs $100k-200k)
Total itemized deductions: $31,522 (reported on 4.7% of returns)
Here:
$31,522
State:
$33,869
(% of AGI for various income ranges: 403.2% for AGIs $50k-75k, 1075.9% for AGIs $100k-200k)
Charity contributions: $14,171 (reported on 3.7% of returns)
Here:
$14,171
State:
$14,577
(% of AGI for various income ranges: 37.2% for AGIs $50k-75k, 528.8% for AGIs $100k-200k)
Taxes paid: $6,889 (reported on 4.7% of returns)
44084:
$6,889
State:
$7,681
(% of AGI for various income ranges: 95.6% for AGIs $50k-75k, 224.1% for AGIs $100k-200k)
Earned income credit: $2,427 (reported on 13.7% of returns)
Here:
$2,427
State:
$2,304
(% of AGI for various income ranges: 102.0% for AGIs below $25k, 54.6% for AGIs $25k-50k)
Percentage of individuals using paid preparers for their 2020 taxes: 94.2%
Here:
94%
State:
94%
(% for various income ranges: 92.9% for AGIs below $25k, 96.0% for AGIs $25k-50k, 94.3% for AGIs $50k-75k, 94.7% for AGIs $75k-100k, 92.0% for AGIs $100k-200k, 100.0% for AGIs over 200k)
Averages for the 2012 tax year for zip code 44084, filed in 2013:
Average Adjusted Gross Income (AGI) in 2012: $49,314 (Individual Income Tax Returns)
Here:
$49,314
State:
$54,926
Salary/wage: $45,157 (reported on 83.5% of returns)
Here:
$45,157
State:
$45,869
(% of AGI for various income ranges: 70.3% for AGIs below $25k, 78.6% for AGIs $25k-50k, 80.5% for AGIs $50k-75k, 77.1% for AGIs $75k-100k, 73.0% for AGIs $100k-200k, 74.0% for AGIs over 200k)
Taxable interest for individuals: $774 (reported on 27.6% of returns)
This zip code:
$774
Ohio:
$1,297
(% of AGI for various income ranges: 1.2% for AGIs below $25k, 0.4% for AGIs $25k-50k, 0.2% for AGIs $50k-75k, 0.3% for AGIs $75k-100k, 0.6% for AGIs $100k-200k)
Ordinary dividends: $2,190 (reported on 17.1% of returns)
Here:
$2,190
State:
$5,821
(% of AGI for various income ranges: 0.9% for AGIs below $25k, 0.8% for AGIs $25k-50k, 0.7% for AGIs $50k-75k, 0.2% for AGIs $75k-100k, 1.5% for AGIs $100k-200k)
Net capital gain/loss in AGI: +$871 (reported on 10.0% of returns)
Here:
+$871
State:
+$11,232
(% of AGI for various income ranges: 0.4% for AGIs $50k-75k, 0.7% for AGIs $100k-200k)
Profit/loss from business: +$7,777 (reported on 15.3% of returns)
Here:
+$7,777
State:
+$12,773
(% of AGI for various income ranges: 6.3% for AGIs below $25k, 2.0% for AGIs $25k-50k, 1.1% for AGIs $50k-75k, 1.4% for AGIs $75k-100k, 4.5% for AGIs $100k-200k)
Taxable individual retirement arrangement distribution: $13,400 (reported on 11.2% of returns)
44084:
$13,400
Ohio:
$14,511
(% of AGI for various income ranges: 4.4% for AGIs below $25k, 3.0% for AGIs $25k-50k, 2.0% for AGIs $50k-75k, 3.6% for AGIs $75k-100k, 4.3% for AGIs $100k-200k)
Total itemized deductions: $17,732 (21% of AGI, reported on 31.2% of returns)
Here:
$17,732
State:
$21,278
Here:
21.5% of AGI
State:
18.8% of AGI
(% of AGI for various income ranges: 7.8% for AGIs below $25k, 8.8% for AGIs $25k-50k, 11.1% for AGIs $50k-75k, 10.1% for AGIs $75k-100k, 13.9% for AGIs $100k-200k, 16.3% for AGIs over 200k)
Charity contributions: $2,149 (reported on 21.8% of returns)
Here:
$2,149
State:
$3,943
(% of AGI for various income ranges: 0.8% for AGIs $25k-50k, 0.7% for AGIs $50k-75k, 1.1% for AGIs $75k-100k, 1.3% for AGIs $100k-200k, 1.5% for AGIs over 200k)
Taxes paid: $6,747 (reported on 31.2% of returns)
44084:
$6,747
State:
$9,568
(% of AGI for various income ranges: 1.5% for AGIs below $25k, 2.6% for AGIs $25k-50k, 3.4% for AGIs $50k-75k, 4.0% for AGIs $75k-100k, 6.0% for AGIs $100k-200k, 9.3% for AGIs over 200k)
Earned income credit: $2,141 (reported on 15.9% of returns)
Here:
$2,141
State:
$2,285
(% of AGI for various income ranges: 6.6% for AGIs below $25k, 0.7% for AGIs $25k-50k)
Percentage of individuals using paid preparers for their 2012 taxes: 51.8%
Here:
52%
State:
51%
(% for various income ranges: 42.1% for AGIs below $25k, 55.1% for AGIs $25k-50k, 56.7% for AGIs $50k-75k, 50.0% for AGIs $75k-100k, 78.6% for AGIs $100k-200k, 0.0% for AGIs over 200k)
Averages for the 2004 tax year for zip code 44084, filed in 2005:
Average Adjusted Gross Income (AGI) in 2004: $40,404 (Individual Income Tax Returns)
Here:
$40,404
State:
$44,480
Salary/wage: $37,635 (reported on 87.0% of returns)
Here:
$37,635
State:
$39,198
(% of AGI for various income ranges: 111.1% for AGIs below $10k, 75.8% for AGIs $10k-25k, 83.0% for AGIs $25k-50k, 85.8% for AGIs $50k-75k, 86.7% for AGIs $75k-100k, 66.1% for AGIs over 100k)
Taxable interest for individuals: $814 (reported on 43.7% of returns)
This zip code:
$814
Ohio:
$1,532
(% of AGI for various income ranges: 6.2% for AGIs below $10k, 1.9% for AGIs $10k-25k, 1.0% for AGIs $25k-50k, 0.5% for AGIs $50k-75k, 0.3% for AGIs $75k-100k, 0.8% for AGIs over 100k)
Taxable dividends: $1,812 (reported on 20.4% of returns)
Here:
$1,812
State:
$3,496
(% of AGI for various income ranges: 3.0% for AGIs below $10k, 1.3% for AGIs $10k-25k, 0.4% for AGIs $25k-50k, 0.6% for AGIs $50k-75k, 0.8% for AGIs $75k-100k, 2.0% for AGIs over 100k)
Net capital gain/loss: +$5,335 (reported on 13.0% of returns)
Here:
+$5,335
State:
+$8,582
(% of AGI for various income ranges: -0.9% for AGIs below $10k, -0.3% for AGIs $10k-25k, 0.5% for AGIs $25k-50k, 1.3% for AGIs $50k-75k, 0.6% for AGIs $75k-100k, 6.3% for AGIs over 100k)
Profit/loss from business: +$6,885 (reported on 13.0% of returns)
Here:
+$6,885
State:
+$10,813
(% of AGI for various income ranges: 5.7% for AGIs below $10k, 4.8% for AGIs $10k-25k, 2.7% for AGIs $25k-50k, 1.6% for AGIs $50k-75k, 2.6% for AGIs over 100k)
IRA payment deduction: $2,175 (reported on 2.4% of returns)
44084:
$2,175
Ohio:
$2,794
Total itemized deductions: $14,543 (23% of AGI, reported on 38.6% of returns)
Here:
$14,543
State:
$17,503
Here:
22.9% of AGI
State:
20.8% of AGI
(% of AGI for various income ranges: 11.1% for AGIs $10k-25k, 13.2% for AGIs $25k-50k, 15.3% for AGIs $50k-75k, 14.9% for AGIs $75k-100k, 14.6% for AGIs over 100k)
Charity contributions deductions: $1,986 (3% of AGI, reported on 29.2% of returns)
Here:
$1,986
State:
$3,087
Here:
2.9% of AGI
State:
3.4% of AGI
(% of AGI for various income ranges: 0.5% for AGIs $10k-25k, 1.0% for AGIs $25k-50k, 1.4% for AGIs $50k-75k, 1.2% for AGIs $75k-100k, 2.8% for AGIs over 100k)
Total tax: $4,792 (reported on 77.6% of returns)
44084:
$4,792
State:
$6,781
(% of AGI for various income ranges: 2.7% for AGIs below $10k, 4.3% for AGIs $10k-25k, 6.9% for AGIs $25k-50k, 8.2% for AGIs $50k-75k, 10.1% for AGIs $75k-100k, 16.4% for AGIs over 100k)
Earned income credit: $1,632 (reported on 11.1% of returns)
Here:
$1,632
State:
$1,696
Percentage of individuals using paid preparers for their 2004 taxes: 54.4%
Here:
54%
State:
55%
(% for various income ranges: 39.6% for AGIs below $10k, 54.9% for AGIs $10k-25k, 57.9% for AGIs $25k-50k, 58.9% for AGIs $50k-75k, 57.7% for AGIs $75k-100k, 62.4% for AGIs over 100k)
Household received Food Stamps/SNAP in the past 12 months: 187 Household did not receive Food Stamps/SNAP in the past 12 months: 1,369
Women who had a birth in the past 12 months: 50 (20 now married, 29 unmarried) Women who did not have a birth in the past 12 months: 731 (325 now married, 405 unmarried)
Housing units in zip code 44084 with a mortgage: 845 (179 second mortgage, 182 both second mortgage and home equity loan) Houses without a mortgage: 58
Median monthly owner costs for units with a mortgage: $1,373 Median monthly owner costs for units without a mortgage: $615
Residents with income below the poverty level in 2022:
This zip code:
14.0%
Whole state:
13.4%
Residents with income below 50% of the poverty level in 2022:
This zip code:
9.9%
Whole state:
7.0%
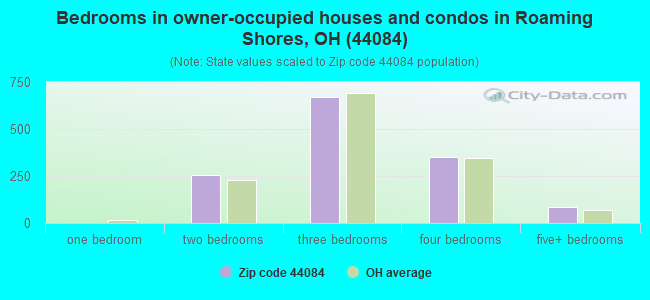
Median number of rooms in houses and condos:
Here:
6.6
State:
6.7
Median number of rooms in apartments:
Here:
4.8
State:
4.4
Notable locations in this zip code not listed on our city pages
Notable locations in zip code 44084: Carousel Farm (A), Still Waters Farm (B), Circle Resort (C), Morgan Hose Company Volunteer Fire Department (D). Display/hide their locations on the map
Cemeteries: East Trumbull Cemetery (1), Union Cemetery (2), Footville Cemetery (3), Mechanicsville-Windsor Road Cemetery (4). Display/hide their locations on the map
Streams, rivers, and creeks: Mud Creek (A), Bronson Creek (B), Badger Run (C), Spring Creek (D), Trumbull Creek (E), Three Brothers Creek (F), Sugar Creek (G), Rock Creek (H), Plum Creek (I). Display/hide their locations on the map
In group quarters: 194 (-1 institutionalized population)
Size of family households: 645 2-persons, 168 3-persons, 139 4-persons, 108 5-persons, 25 6-persons, 4 7-or-more-persons
Size of nonfamily households: 406 1-person, 56 2-persons
569 married couples with children.
245 single-parent households (94 men, 151 women).
97.2% of residents of 44084 zip code speak English at home.
1.3% of residents speak Spanish at home (79% very well, 21% not well).
0.4% of residents speak other Indo-European language at home (57% very well, 14% well, 29% not well).
0.5% of residents speak other language at home (100% very well).
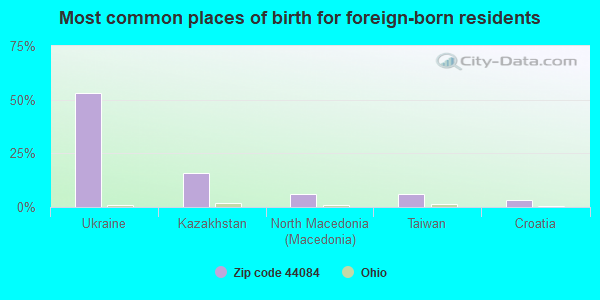
Foreign born population: 32 (0.8%) (84.6% of them are naturalized citizens)
This zip code:
0.8%
Whole state:
5.0%
53%Ukraine
16%Kazakhstan
6%North Macedonia (Macedonia)
6%Taiwan
3%Croatia
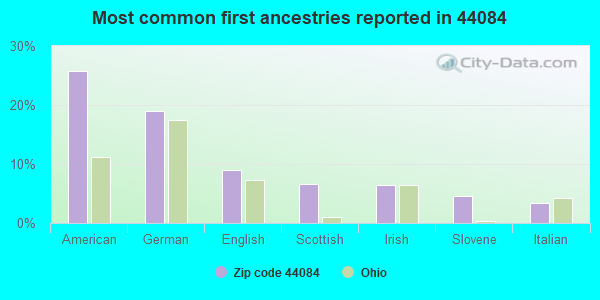
26%American
19%German
9%English
7%Scottish
6%Irish
5%Slovene
3%Italian
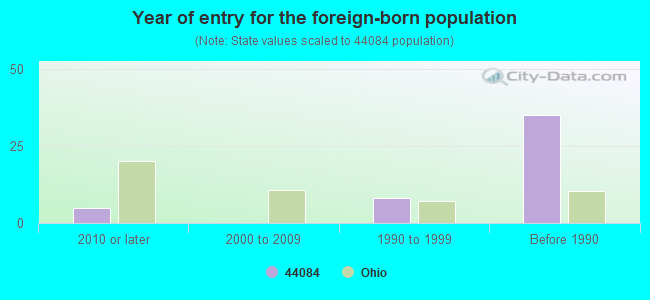
Year of entry for the foreign-born population
52010 or later
02000 to 2009
81990 to 1999
35Before 1990
Facilities with environmental interests located in this zip code:
ALLTEL ROCKCREEK (3187 W WATER ST in ROCK CREEK, OH)
(Integrated Compliance Information System) - ICIS-HQ-2000-6004, FORMAL ENFORCEMENT ACTION STATE MASTER (Ohio general info) - -04-4813-987-2, EPCRA
Housing units lacking complete plumbing facilities: 3.1% Housing units lacking complete kitchen facilities: 5.5%
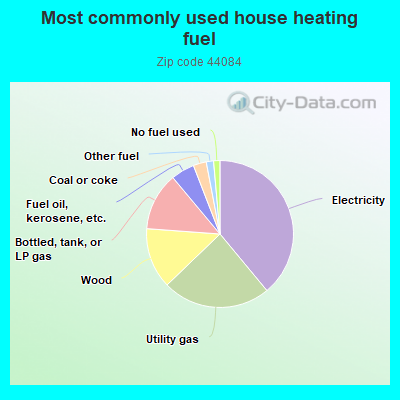
39.1%Electricity
23.9%Utility gas
13.4%Wood
12.8%Bottled, tank, or LP gas
5.2%Fuel oil, kerosene, etc.
2.9%Coal or coke
1.6%Other fuel
1.4%No fuel used
Population in 1990: 2,979. Population change in the 1990s: +454 (+15.2%).
Place of birth for U.S.-born residents:
This state: 3,101
Northeast: 523
Midwest: 123
South: 80
West: 48
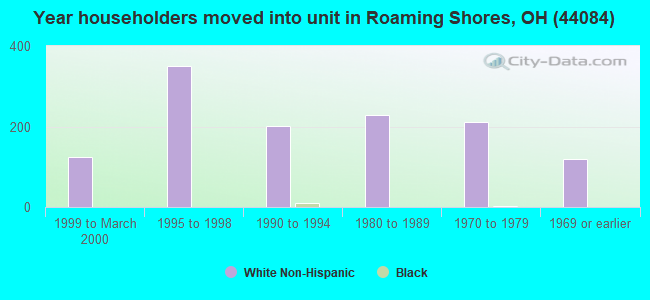
61% of the 44084 zip code residents lived in the same house 5 years ago. Out of people who lived in different houses, 44% lived in this county. Out of people who lived in different counties, 50% lived in Ohio.
87% of the 44084 zip code residents lived in the same house 1 year ago. Out of people who lived in different houses, 23% moved from this county. Out of people who lived in different houses, 43% moved from different county within same state. Out of people who lived in different houses, 37% moved from different state.
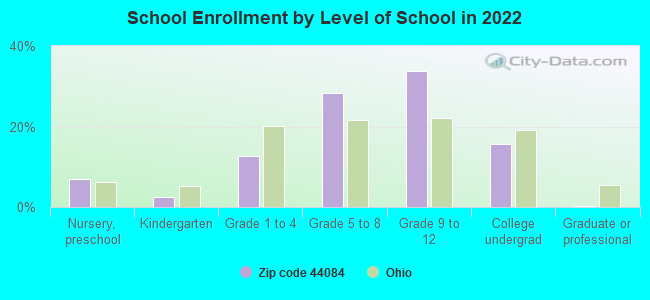
Private vs. public school enrollment:
Students in private schools in grades 1 to 8 (elementary and middle school): 5
Here:
1.6%
Ohio:
16.0%
Students in private schools in grades 9 to 12 (high school): 8
Here:
2.7%
Ohio:
13.1%
Students in private undergraduate colleges: 15
Here:
11.1%
Ohio:
22.3%
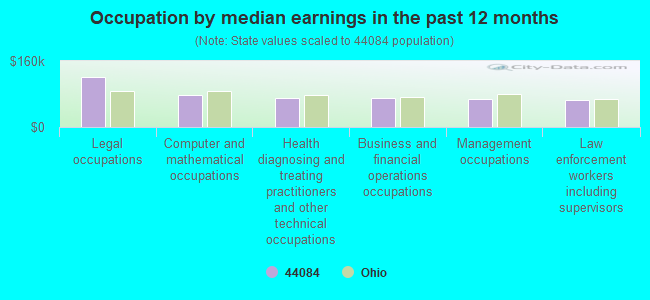
Occupation by median earnings in the past 12 months ($)
120,762Legal occupations
78,096Computer and mathematical occupations
70,989Health diagnosing and treating practitioners and other technical occupations
69,120Business and financial operations occupations
67,996Management occupations
65,256Law enforcement workers including supervisors
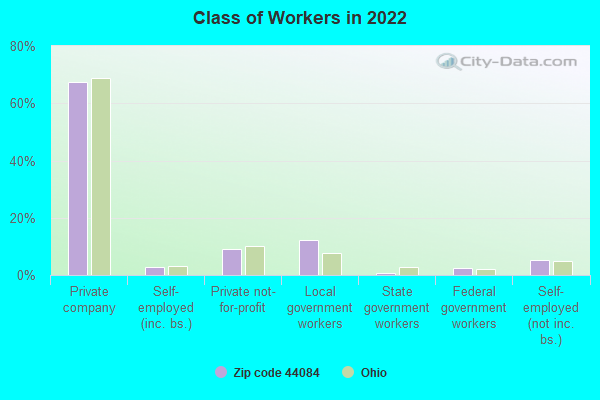
Companies with federal contracts located in this zip code:
MIDWEST GREEN TECHNOLOGIES, IN (2593 CARDINAL DRIVE in ROCK CREEK, OH; small business)
$4,169 with Navy for Capacitors. Signed on 2005-04-14. Completion date: 2005-05-05.
Top industries in this zip code by the number of employees in 2005:
Health Care and Social Assistance: Psychiatric and Substance Abuse Hospitals (100-249 employees: 1 establishment)
Accommodation and Food Services: Full-Service Restaurants (50-99: 1, 1-4: 1)
Construction: Plumbing, Heating, and Air-Conditioning Contractors (5-9: 2, 1-4: 1)
Construction: New Single-Family Housing Construction (except Operative Builders) (5-9: 2, 1-4: 1)
Accommodation and Food Services: Limited-Service Restaurants (5-9: 1, 1-4: 2)
Administrative and Support and Waste Management and Remediation Services: Septic Tank and Related Services (5-9: 1, 1-4: 1)
Construction: Site Preparation Contractors (1-4: 4)
Wholesale Trade: Recyclable Material Merchant Wholesalers (5-9: 1)
People in group quarters in 2010:
139 people in hospitals with patients who have no usual home elsewhere
People in group quarters in 2000:
30 people in hospitals or wards for drug/alcohol abuse
Fatal accident statistics in 2014:
Fatal accident count: 1
Vehicles involved in fatal accidents: 1
Fatal accidents caused by drunken drivers: 0
Fatalities: 1
Persons involved in fatal accidents: 1
Pedestrians involved in fatal accidents: 0
Fatal accident statistics in 2011:
Fatal accident count: 2
Vehicles involved in fatal accidents: 4
Fatal accidents caused by drunken drivers: 1
Fatalities: 3
Persons involved in fatal accidents: 6
Pedestrians involved in fatal accidents: 0
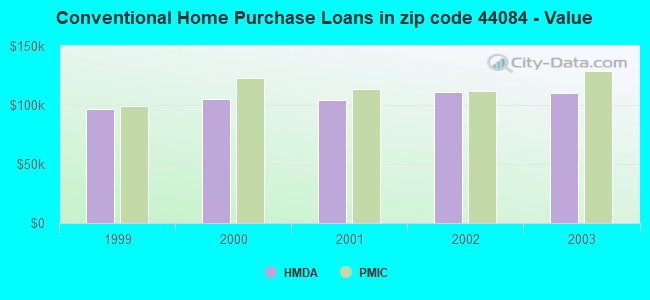
Home Mortgage Disclosure Act Aggregated Statistics For Year 2003 (Based on 2 partial tracts)
A) FHA, FSA/RHS & VA Home Purchase Loans
B) Conventional Home Purchase Loans
C) Refinancings
D) Home Improvement Loans
F) Non-occupant Loans on < 5 Family Dwellings (A B C & D)
Number
Average Value
Number
Average Value
Number
Average Value
Number
Average Value
Number
Average Value
LOANS ORIGINATED
14
$120,215
110
$110,331
479
$107,737
39
$31,081
30
$118,825
APPLICATIONS APPROVED, NOT ACCEPTED
2
$86,995
17
$126,358
80
$121,536
5
$19,130
5
$108,188
APPLICATIONS DENIED
4
$129,255
18
$97,257
182
$124,759
27
$25,715
8
$125,339
APPLICATIONS WITHDRAWN
6
$116,132
10
$138,368
131
$115,520
4
$28,242
6
$109,260
FILES CLOSED FOR INCOMPLETENESS
0
$0
6
$127,950
29
$148,826
1
$16,490
1
$71,740
Aggregated Statistics For Year 2002 (Based on 2 partial tracts)
A) FHA, FSA/RHS & VA Home Purchase Loans
B) Conventional Home Purchase Loans
C) Refinancings
D) Home Improvement Loans
F) Non-occupant Loans on < 5 Family Dwellings (A B C & D)
Number
Average Value
Number
Average Value
Number
Average Value
Number
Average Value
Number
Average Value
LOANS ORIGINATED
13
$119,377
108
$111,206
336
$101,644
43
$24,661
28
$117,005
APPLICATIONS APPROVED, NOT ACCEPTED
0
$0
6
$86,033
99
$100,826
6
$22,677
1
$143,480
APPLICATIONS DENIED
2
$89,470
25
$57,689
185
$108,036
13
$13,765
6
$63,082
APPLICATIONS WITHDRAWN
2
$125,750
13
$100,855
106
$108,038
3
$15,667
7
$120,744
FILES CLOSED FOR INCOMPLETENESS
0
$0
4
$68,442
22
$112,520
0
$0
1
$145,130
Aggregated Statistics For Year 2001 (Based on 2 partial tracts)
A) FHA, FSA/RHS & VA Home Purchase Loans
B) Conventional Home Purchase Loans
C) Refinancings
D) Home Improvement Loans
F) Non-occupant Loans on < 5 Family Dwellings (A B C & D)
Number
Average Value
Number
Average Value
Number
Average Value
Number
Average Value
Number
Average Value
LOANS ORIGINATED
23
$107,485
81
$103,849
327
$98,027
47
$24,527
21
$99,541
APPLICATIONS APPROVED, NOT ACCEPTED
0
$0
9
$69,633
54
$88,064
7
$37,224
2
$103,075
APPLICATIONS DENIED
1
$117,920
27
$69,847
143
$94,293
29
$14,672
2
$61,435
APPLICATIONS WITHDRAWN
0
$0
8
$111,218
94
$103,470
8
$18,656
6
$65,143
FILES CLOSED FOR INCOMPLETENESS
1
$162,450
0
$0
16
$124,154
2
$12,370
0
$0
Aggregated Statistics For Year 2000 (Based on 2 partial tracts)
A) FHA, FSA/RHS & VA Home Purchase Loans
B) Conventional Home Purchase Loans
C) Refinancings
D) Home Improvement Loans
F) Non-occupant Loans on < 5 Family Dwellings (A B C & D)
Number
Average Value
Number
Average Value
Number
Average Value
Number
Average Value
Number
Average Value
LOANS ORIGINATED
16
$118,279
110
$104,664
134
$77,168
62
$19,764
17
$81,926
APPLICATIONS APPROVED, NOT ACCEPTED
0
$0
10
$90,541
42
$86,505
18
$34,771
1
$4,120
APPLICATIONS DENIED
1
$112,150
21
$66,125
108
$92,103
28
$22,941
2
$90,295
APPLICATIONS WITHDRAWN
1
$167,390
5
$112,310
43
$86,295
7
$31,924
1
$87,410
FILES CLOSED FOR INCOMPLETENESS
0
$0
2
$63,080
7
$116,504
2
$20,615
0
$0
Aggregated Statistics For Year 1999 (Based on 1 partial tract)
A) FHA, FSA/RHS & VA Home Purchase Loans
B) Conventional Home Purchase Loans
C) Refinancings
D) Home Improvement Loans
F) Non-occupant Loans on < 5 Family Dwellings (A B C & D)
Detailed PMIC statistics for the following Tracts:0010.00
2002 - 2018 National Fire Incident Reporting System (NFIRS) incidents
Based on the data from the years 2002 - 2018 the average number of fire incidents per year is 24. The highest number of fires - 42 took place in 2016, and the least - 11 in 2002. The data has an increasing trend.
When looking into fire subcategories, the most reports belonged to: Structure Fires (53.8%), and Outside Fires (39.5%).
Fire incident types reported to NFIRS in Zip Code 44084


 Nearest zip codes: 44085, 44010, 44041, 44099, 44064, 44076.


 Based on the data from the years 2002 - 2018 the average number of fire incidents per year is 24. The highest number of fires - 42 took place in 2016, and the least - 11 in 2002. The data has an increasing trend.
 When looking into fire subcategories, the most reports belonged to: Structure Fires (53.8%), and Outside Fires (39.5%).