Estimated zip code population in 2022: 5,195 Zip code population in 2010: 4,733 Zip code population in 2000: 4,452
Houses and condos: 1,903 Renter-occupied apartments: 113
% of renters here:
6%
State:
29%
March 2022 cost of living index in zip code 46979: 85.4 (less than average, U.S. average is 100)
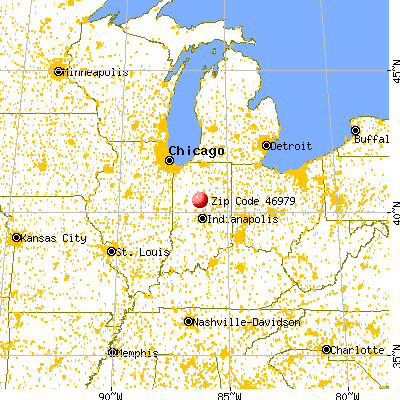
Land area: 42.2 sq. mi. Water area: 0.0 sq. mi.
Population density: 123 people per square mile
(very low).
OSM Map
General Map
Google Map
MSN Map
OSM Map
General Map
Google Map
MSN Map
OSM Map
General Map
Google Map
MSN Map
OSM Map
General Map
Google Map
MSN Map
Please wait while loading the map...
Real estate property taxes paid for housing units in 2022:
This zip code:
0.6% ($1,338)
Indiana:
0.7% ($1,467)
Median real estate property taxes paid for housing units with mortgages in 2022: $1,352 (0.6%) Median real estate property taxes paid for housing units with no mortgage in 2022: $1,343 (0.7%)
Estimated median house/condo value in 2022: $215,520
46979:
$215,520
Indiana:
$208,700
According to our research of Indiana and other state lists, there was 1 registered sex offender living in 46979 zip code as of June 09, 2024. The ratio of all residents to sex offenders in zip code 46979 is 4,945 to 1. The ratio of registered sex offenders to all residents in this zip code is much lower than the state average.
Median resident age:
This zip code:
43.3 years
Indiana median age:
38.2 years
Average household size:
This zip code:
2.9 people
Indiana:
2.4 people
Averages for the 2020 tax year for zip code 46979, filed in 2021:
Average Adjusted Gross Income (AGI) in 2020: $71,641 (Individual Income Tax Returns)
Here:
$71,641
State:
$64,978
Salary/wage: $63,681 (reported on 81.3% of returns)
Here:
$63,681
State:
$55,245
(% of AGI for various income ranges: 908.8% for AGIs below $25k, 3154.2% for AGIs $25k-50k, 5423.1% for AGIs $50k-75k, 8763.6% for AGIs $75k-100k, 15868.3% for AGIs $100k-200k, 44802.5% for AGIs over 200k)
Taxable interest for individuals: $716 (reported on 36.5% of returns)
This zip code:
$716
Indiana:
$1,351
(% of AGI for various income ranges: 17.3% for AGIs below $25k, 25.0% for AGIs $25k-50k, 40.3% for AGIs $50k-75k, 31.4% for AGIs $75k-100k, 54.0% for AGIs $100k-200k, 192.5% for AGIs over 200k)
Ordinary dividends: $2,836 (reported on 17.4% of returns)
Here:
$2,836
State:
$5,827
(% of AGI for various income ranges: 18.8% for AGIs below $25k, 27.9% for AGIs $25k-50k, 72.1% for AGIs $50k-75k, 48.2% for AGIs $75k-100k, 119.7% for AGIs $100k-200k, 652.5% for AGIs over 200k)
Net capital gain/loss in AGI: +$7,976 (reported on 17.0% of returns)
Here:
+$7,976
State:
+$17,730
(% of AGI for various income ranges: 6.0% for AGIs below $25k, 20.0% for AGIs $25k-50k, 86.9% for AGIs $50k-75k, 104.5% for AGIs $75k-100k, 254.3% for AGIs $100k-200k, 4482.5% for AGIs over 200k)
Profit/loss from business: +$10,797 (reported on 12.0% of returns)
Here:
+$10,797
State:
+$12,144
(% of AGI for various income ranges: 60.2% for AGIs below $25k, 91.8% for AGIs $25k-50k, 203.1% for AGIs $50k-75k, 146.8% for AGIs $75k-100k, 198.6% for AGIs $100k-200k, 2215.0% for AGIs over 200k)
Taxable individual retirement arrangement distribution: $18,148 (reported on 11.2% of returns)
46979:
$18,148
Indiana:
$18,302
(% of AGI for various income ranges: 51.2% for AGIs below $25k, 89.5% for AGIs $25k-50k, 191.7% for AGIs $50k-75k, 284.5% for AGIs $75k-100k, 894.9% for AGIs $100k-200k)
Total itemized deductions: $31,993 (reported on 5.8% of returns)
Here:
$31,993
State:
$35,601
(% of AGI for various income ranges: 427.9% for AGIs $50k-75k, 462.6% for AGIs $100k-200k, 4047.5% for AGIs over 200k)
Charity contributions: $14,718 (reported on 4.6% of returns)
Here:
$14,718
State:
$15,596
(% of AGI for various income ranges: 87.2% for AGIs $50k-75k, 158.0% for AGIs $100k-200k, 2032.5% for AGIs over 200k)
Taxes paid: $7,500 (reported on 5.8% of returns)
46979:
$7,500
State:
$7,542
(% of AGI for various income ranges: 64.1% for AGIs $50k-75k, 145.1% for AGIs $100k-200k, 890.0% for AGIs over 200k)
Earned income credit: $2,357 (reported on 9.5% of returns)
Here:
$2,357
State:
$2,298
(% of AGI for various income ranges: 63.3% for AGIs below $25k, 62.6% for AGIs $25k-50k)
Percentage of individuals using paid preparers for their 2020 taxes: 95.9%
Here:
96%
State:
94%
(% for various income ranges: 94.2% for AGIs below $25k, 95.7% for AGIs $25k-50k, 97.3% for AGIs $50k-75k, 96.6% for AGIs $75k-100k, 96.1% for AGIs $100k-200k, 100.0% for AGIs over 200k)
Averages for the 2012 tax year for zip code 46979, filed in 2013:
Average Adjusted Gross Income (AGI) in 2012: $60,842 (Individual Income Tax Returns)
Here:
$60,842
State:
$52,932
Salary/wage: $51,048 (reported on 87.4% of returns)
Here:
$51,048
State:
$45,173
(% of AGI for various income ranges: 61.4% for AGIs below $25k, 63.6% for AGIs $25k-50k, 65.4% for AGIs $50k-75k, 79.3% for AGIs $75k-100k, 84.4% for AGIs $100k-200k, 57.9% for AGIs over 200k)
Taxable interest for individuals: $888 (reported on 41.7% of returns)
This zip code:
$888
Indiana:
$1,311
(% of AGI for various income ranges: 1.8% for AGIs below $25k, 0.8% for AGIs $25k-50k, 0.7% for AGIs $50k-75k, 0.5% for AGIs $75k-100k, 0.5% for AGIs $100k-200k, 0.3% for AGIs over 200k)
Ordinary dividends: $2,143 (reported on 19.7% of returns)
Here:
$2,143
State:
$4,690
(% of AGI for various income ranges: 1.2% for AGIs below $25k, 0.7% for AGIs $25k-50k, 0.7% for AGIs $50k-75k, 0.4% for AGIs $75k-100k, 0.6% for AGIs $100k-200k, 1.2% for AGIs over 200k)
Net capital gain/loss in AGI: +$2,458 (reported on 14.8% of returns)
Here:
+$2,458
State:
+$10,406
(% of AGI for various income ranges: 0.5% for AGIs $50k-75k, 0.1% for AGIs $75k-100k, 0.7% for AGIs $100k-200k, 2.4% for AGIs over 200k)
Profit/loss from business: +$10,803 (reported on 13.5% of returns)
Here:
+$10,803
State:
+$11,105
(% of AGI for various income ranges: 5.3% for AGIs below $25k, 2.1% for AGIs $25k-50k, 2.7% for AGIs $50k-75k, 1.8% for AGIs $75k-100k, 3.0% for AGIs $100k-200k)
Taxable individual retirement arrangement distribution: $11,135 (reported on 10.3% of returns)
46979:
$11,135
Indiana:
$13,841
(% of AGI for various income ranges: 3.1% for AGIs below $25k, 2.4% for AGIs $25k-50k, 2.5% for AGIs $50k-75k, 2.0% for AGIs $75k-100k, 1.8% for AGIs $100k-200k)
Total itemized deductions: $19,859 (18% of AGI, reported on 33.2% of returns)
Here:
$19,859
State:
$20,913
Here:
18.3% of AGI
State:
18.2% of AGI
(% of AGI for various income ranges: 7.1% for AGIs below $25k, 7.4% for AGIs $25k-50k, 9.2% for AGIs $50k-75k, 11.3% for AGIs $75k-100k, 12.7% for AGIs $100k-200k, 12.1% for AGIs over 200k)
Charity contributions: $4,103 (reported on 28.7% of returns)
Here:
$4,103
State:
$4,697
(% of AGI for various income ranges: 1.0% for AGIs below $25k, 1.3% for AGIs $25k-50k, 1.6% for AGIs $50k-75k, 2.1% for AGIs $75k-100k, 2.2% for AGIs $100k-200k, 2.3% for AGIs over 200k)
Taxes paid: $6,824 (reported on 33.2% of returns)
46979:
$6,824
State:
$7,456
(% of AGI for various income ranges: 1.1% for AGIs below $25k, 1.2% for AGIs $25k-50k, 2.4% for AGIs $50k-75k, 3.6% for AGIs $75k-100k, 5.0% for AGIs $100k-200k, 5.7% for AGIs over 200k)
Earned income credit: $2,026 (reported on 12.1% of returns)
Here:
$2,026
State:
$2,265
(% of AGI for various income ranges: 5.0% for AGIs below $25k, 1.0% for AGIs $25k-50k)
Percentage of individuals using paid preparers for their 2012 taxes: 65.5%
Here:
65%
State:
53%
(% for various income ranges: 58.9% for AGIs below $25k, 65.1% for AGIs $25k-50k, 70.3% for AGIs $50k-75k, 72.4% for AGIs $75k-100k, 64.9% for AGIs $100k-200k, 100.0% for AGIs over 200k)
Averages for the 2004 tax year for zip code 46979, filed in 2005:
Average Adjusted Gross Income (AGI) in 2004: $53,458 (Individual Income Tax Returns)
Here:
$53,458
State:
$44,790
Salary/wage: $48,553 (reported on 90.4% of returns)
Here:
$48,553
State:
$39,615
(% of AGI for various income ranges: 146.3% for AGIs below $10k, 61.4% for AGIs $10k-25k, 65.7% for AGIs $25k-50k, 81.2% for AGIs $50k-75k, 89.9% for AGIs $75k-100k, 84.7% for AGIs over 100k)
Taxable interest for individuals: $937 (reported on 56.5% of returns)
This zip code:
$937
Indiana:
$1,535
(% of AGI for various income ranges: 7.6% for AGIs below $10k, 3.6% for AGIs $10k-25k, 1.7% for AGIs $25k-50k, 0.9% for AGIs $50k-75k, 0.8% for AGIs $75k-100k, 0.4% for AGIs over 100k)
Taxable dividends: $1,054 (reported on 24.0% of returns)
Here:
$1,054
State:
$2,998
(% of AGI for various income ranges: 4.2% for AGIs below $10k, 1.3% for AGIs $10k-25k, 0.9% for AGIs $25k-50k, 0.5% for AGIs $50k-75k, 0.2% for AGIs $75k-100k, 0.3% for AGIs over 100k)
Net capital gain/loss: +$1,753 (reported on 17.8% of returns)
Here:
+$1,753
State:
+$8,619
(% of AGI for various income ranges: -1.5% for AGIs below $10k, 0.0% for AGIs $10k-25k, 0.8% for AGIs $25k-50k, -0.0% for AGIs $50k-75k, 0.8% for AGIs $75k-100k, 0.8% for AGIs over 100k)
Profit/loss from business: +$5,537 (reported on 14.4% of returns)
Here:
+$5,537
State:
+$10,071
(% of AGI for various income ranges: 8.7% for AGIs below $10k, 2.3% for AGIs $10k-25k, 2.8% for AGIs $25k-50k, 1.4% for AGIs $50k-75k, 0.9% for AGIs $75k-100k, 1.2% for AGIs over 100k)
IRA payment deduction: $3,469 (reported on 1.4% of returns)
46979:
$3,469
Indiana:
$2,840
Total itemized deductions: $16,138 (18% of AGI, reported on 41.6% of returns)
Here:
$16,138
State:
$17,065
Here:
18.4% of AGI
State:
19.5% of AGI
(% of AGI for various income ranges: 17.7% for AGIs below $10k, 9.8% for AGIs $10k-25k, 10.7% for AGIs $25k-50k, 11.8% for AGIs $50k-75k, 13.6% for AGIs $75k-100k, 13.3% for AGIs over 100k)
Charity contributions deductions: $3,098 (3% of AGI, reported on 36.2% of returns)
Here:
$3,098
State:
$3,550
Here:
3.4% of AGI
State:
3.8% of AGI
(% of AGI for various income ranges: 1.1% for AGIs $10k-25k, 2.0% for AGIs $25k-50k, 1.8% for AGIs $50k-75k, 2.1% for AGIs $75k-100k, 2.5% for AGIs over 100k)
Total tax: $7,385 (reported on 81.6% of returns)
46979:
$7,385
State:
$6,914
(% of AGI for various income ranges: 6.2% for AGIs below $10k, 3.8% for AGIs $10k-25k, 6.8% for AGIs $25k-50k, 8.8% for AGIs $50k-75k, 10.1% for AGIs $75k-100k, 16.1% for AGIs over 100k)
Earned income credit: $1,485 (reported on 7.6% of returns)
Here:
$1,485
State:
$1,685
Percentage of individuals using paid preparers for their 2004 taxes: 65.1%
Here:
65%
State:
59%
(% for various income ranges: 53.5% for AGIs below $10k, 68.4% for AGIs $10k-25k, 71.6% for AGIs $25k-50k, 68.1% for AGIs $50k-75k, 62.3% for AGIs $75k-100k, 67.6% for AGIs over 100k)
Likely homosexual households (counted as self-reported same-sex unmarried-partner households)
Lesbian couples: 0.3% of all households
Gay men: 0.0% of all households
Household received Food Stamps/SNAP in the past 12 months: 66 Household did not receive Food Stamps/SNAP in the past 12 months: 1,741
Women who had a birth in the past 12 months: 37 (24 now married, 12 unmarried) Women who did not have a birth in the past 12 months: 937 (534 now married, 405 unmarried)
Housing units in zip code 46979 with a mortgage: 1,195 (153 second mortgage, 5 home equity loan, 139 both second mortgage and home equity loan) Houses without a mortgage: 72
Median monthly owner costs for units with a mortgage: $1,235 Median monthly owner costs for units without a mortgage: $461
Residents with income below the poverty level in 2022:
This zip code:
2.6%
Whole state:
12.6%
Residents with income below 50% of the poverty level in 2022:
This zip code:
0.7%
Whole state:
6.3%
Median number of rooms in houses and condos:
Here:
6.9
State:
6.6
Median number of rooms in apartments:
Here:
5.1
State:
4.3
Notable locations in this zip code not listed on our city pages
Size of family households: 745 2-persons, 282 3-persons, 179 4-persons, 217 5-persons, 61 6-persons, 12 7-or-more-persons
Size of nonfamily households: 221 1-person, 91 2-persons
795 married couples with children.
203 single-parent households (30 men, 173 women).
97.4% of residents of 46979 zip code speak English at home.
2.0% of residents speak Spanish at home (80% very well, 20% not well).
0.2% of residents speak other Indo-European language at home (100% very well).
Foreign born population: 7 (0.2%) (100.0% of them are naturalized citizens)
This zip code:
0.2%
Whole state:
6.1%
26%American
18%German
17%English
4%Irish
3%Danish
3%European
2%Scotch-Irish
Year of entry for the foreign-born population
102010 or later
82000 to 2009
61990 to 1999
12Before 1990
Facilities with environmental interests located in this zip code:
RUSSIAVILLE WWTP (CR 775 WEST in RUSSIAVILLE, IN)
STATE MASTER (Indiana facility tracking) - CRTK-1052, EPCRA National Pollutant Discharge Elimination System NON-MAJOR (Tracking pollutant discharge elimination systems) - permit Business SIC classification: SEWERAGE SYSTEMS Organizations: ROBERT HEWITT 13370 (CONTACT/OPERATOR)
, RUSSIAVILLE TOWN COUNCIL (CONTACT/OWNER)
Alternative names: RUSSIAVILLE MUNICIPAL STP
NEW LONDON CD (PERU STREET CR 766 W in RUSSIAVILLE, IN)
STATE MASTER (Indiana facility tracking) National Pollutant Discharge Elimination System NON-MAJOR (Tracking pollutant discharge elimination systems) - permit Business SIC classification: SEWERAGE SYSTEMS Organizations: ROBERT HEWITT 13370 EXP 63006 (CONTACT/OPERATOR)
, STEVE JOHNSON PRESIDENT (CONTACT/OWNER)
Alternative names: NEW LONDON C.D., NEW LONDON CONSERVANCY DISTRCT
LINTON OIL CO (407 S UNION ST in RUSSIAVILLE, IN)
National Pollutant Discharge Elimination System NON-MAJOR (Tracking pollutant discharge elimination systems) - permit Business SIC classification: PETROLEUM BULK STATIONS AND TERMINALS Organizations: DAN FASBINDER CERT #17481 (CONTACT/OPERATOR)
, MR BYRON LINTON PRESIDENT (CONTACT/OWNER)
MARTIN MARIETTA KOKOMO SAND P (3891 S 500 W in RUSSIAVILLE, IN)
National Pollutant Discharge Elimination System NON-MAJOR (Tracking pollutant discharge elimination systems) - permit Business SIC classification: CONSTRUCTION SAND AND GRAVEL Organizations: CERTIFIED OPERATOR (CONTACT/OPERATOR)
Alternative names: KOKOMO SAND PLANT, MARTIN MARIETTA, KOKOMO SAND
Housing units lacking complete plumbing facilities: 1.0% Housing units lacking complete kitchen facilities: 1.0%
54.1%Utility gas
29.8%Electricity
10.8%Bottled, tank, or LP gas
4.7%Wood
0.6%Solar energy
Population in 1990: 1,724. Population change in the 1990s: +2,728 (+158.2%).
Place of birth for U.S.-born residents:
This state: 4,328
Northeast: 56
Midwest: 249
South: 406
West: 74
61% of the 46979 zip code residents lived in the same house 5 years ago. Out of people who lived in different houses, 62% lived in this county. Out of people who lived in different counties, 50% lived in Indiana.
90% of the 46979 zip code residents lived in the same house 1 year ago. Out of people who lived in different houses, 76% moved from this county. Out of people who lived in different houses, 23% moved from different county within same state.
Private vs. public school enrollment:
Students in private schools in grades 1 to 8 (elementary and middle school): 11
Here:
1.7%
Indiana:
14.9%
Students in private schools in grades 9 to 12 (high school):
Here:
0.0%
Indiana:
11.4%
Students in private undergraduate colleges: 13
Here:
9.6%
Indiana:
22.3%
Occupation by median earnings in the past 12 months ($)
106,603Architecture and engineering occupations
82,475Health diagnosing and treating practitioners and other technical occupations
80,807Business and financial operations occupations
67,922Production occupations
59,043Personal care and service occupations
56,521Installation, maintenance, and repair occupations
Top industries in this zip code by the number of employees in 2005:
Other Services (except Public Administration): Religious Organizations (5-9 employees: 1 establishment, 1-4 employees: 6 establishments)
Health Care and Social Assistance: Offices of Physicians (except Mental Health Specialists) (10-19: 1)
Finance and Insurance: Commercial Banking (10-19: 1)
Construction: Residential Remodelers (1-4: 5)
Accommodation and Food Services: Limited-Service Restaurants (5-9: 1, 1-4: 1)
Administrative and Support and Waste Management and Remediation Services: Landscaping Services (5-9: 1, 1-4: 1)
Fatal accident statistics in 2014:
Fatal accident count: 1
Vehicles involved in fatal accidents: 1
Fatal accidents caused by drunken drivers: 0
Fatalities: 1
Persons involved in fatal accidents: 1
Pedestrians involved in fatal accidents: 0
Fatal accident statistics in 2012:
Fatal accident count: 1
Vehicles involved in fatal accidents: 2
Fatal accidents caused by drunken drivers: 0
Fatalities: 1
Persons involved in fatal accidents: 5
Pedestrians involved in fatal accidents: 0
Home Mortgage Disclosure Act Aggregated Statistics For Year 2009 (Based on 4 partial tracts)
A) FHA, FSA/RHS & VA Home Purchase Loans
B) Conventional Home Purchase Loans
C) Refinancings
D) Home Improvement Loans
F) Non-occupant Loans on < 5 Family Dwellings (A B C & D)
G) Loans On Manufactured Home Dwelling (A B C & D)
Number
Average Value
Number
Average Value
Number
Average Value
Number
Average Value
Number
Average Value
Number
Average Value
LOANS ORIGINATED
46
$108,708
36
$98,168
257
$129,155
3
$94,920
13
$43,438
2
$12,065
APPLICATIONS APPROVED, NOT ACCEPTED
2
$127,095
2
$136,820
19
$143,268
0
$0
0
$0
0
$0
APPLICATIONS DENIED
10
$91,912
4
$70,138
114
$136,905
8
$54,421
6
$67,838
3
$100,817
APPLICATIONS WITHDRAWN
0
$0
3
$116,527
70
$132,147
0
$0
0
$0
2
$93,310
FILES CLOSED FOR INCOMPLETENESS
0
$0
0
$0
20
$147,626
0
$0
0
$0
0
$0
Aggregated Statistics For Year 2008 (Based on 4 partial tracts)
A) FHA, FSA/RHS & VA Home Purchase Loans
B) Conventional Home Purchase Loans
C) Refinancings
D) Home Improvement Loans
F) Non-occupant Loans on < 5 Family Dwellings (A B C & D)
G) Loans On Manufactured Home Dwelling (A B C & D)
Number
Average Value
Number
Average Value
Number
Average Value
Number
Average Value
Number
Average Value
Number
Average Value
LOANS ORIGINATED
29
$113,909
70
$150,787
131
$131,132
14
$23,296
8
$85,822
5
$71,752
APPLICATIONS APPROVED, NOT ACCEPTED
3
$87,947
5
$211,288
19
$149,558
5
$45,368
0
$0
0
$0
APPLICATIONS DENIED
6
$119,063
10
$141,224
84
$128,510
15
$29,646
2
$170,535
7
$75,596
APPLICATIONS WITHDRAWN
3
$194,663
11
$92,975
37
$138,554
4
$43,592
0
$0
2
$82,050
FILES CLOSED FOR INCOMPLETENESS
2
$68,375
2
$96,530
10
$120,588
0
$0
0
$0
0
$0
Aggregated Statistics For Year 2007 (Based on 4 partial tracts)
A) FHA, FSA/RHS & VA Home Purchase Loans
B) Conventional Home Purchase Loans
C) Refinancings
D) Home Improvement Loans
F) Non-occupant Loans on < 5 Family Dwellings (A B C & D)
G) Loans On Manufactured Home Dwelling (A B C & D)
Number
Average Value
Number
Average Value
Number
Average Value
Number
Average Value
Number
Average Value
Number
Average Value
LOANS ORIGINATED
17
$132,666
113
$105,917
171
$110,389
16
$41,771
14
$72,495
12
$76,686
APPLICATIONS APPROVED, NOT ACCEPTED
4
$115,715
9
$113,297
37
$114,829
7
$38,986
1
$56,230
0
$0
APPLICATIONS DENIED
3
$76,543
29
$92,906
160
$129,661
23
$61,379
3
$102,863
10
$74,759
APPLICATIONS WITHDRAWN
0
$0
6
$152,732
56
$142,619
4
$32,318
1
$76,820
2
$64,350
FILES CLOSED FOR INCOMPLETENESS
0
$0
2
$159,270
16
$157,233
0
$0
0
$0
0
$0
Aggregated Statistics For Year 2006 (Based on 4 partial tracts)
A) FHA, FSA/RHS & VA Home Purchase Loans
B) Conventional Home Purchase Loans
C) Refinancings
D) Home Improvement Loans
F) Non-occupant Loans on < 5 Family Dwellings (A B C & D)
G) Loans On Manufactured Home Dwelling (A B C & D)
Number
Average Value
Number
Average Value
Number
Average Value
Number
Average Value
Number
Average Value
Number
Average Value
LOANS ORIGINATED
4
$150,780
106
$119,871
195
$111,306
31
$55,132
11
$138,315
7
$81,444
APPLICATIONS APPROVED, NOT ACCEPTED
0
$0
19
$91,269
37
$100,651
7
$48,596
0
$0
4
$65,532
APPLICATIONS DENIED
0
$0
34
$93,174
140
$114,790
18
$68,577
9
$55,428
6
$36,198
APPLICATIONS WITHDRAWN
0
$0
13
$92,908
64
$126,211
8
$67,315
2
$64,350
2
$48,265
FILES CLOSED FOR INCOMPLETENESS
0
$0
2
$101,340
18
$181,190
0
$0
0
$0
0
$0
Aggregated Statistics For Year 2005 (Based on 4 partial tracts)
A) FHA, FSA/RHS & VA Home Purchase Loans
B) Conventional Home Purchase Loans
C) Refinancings
D) Home Improvement Loans
F) Non-occupant Loans on < 5 Family Dwellings (A B C & D)
G) Loans On Manufactured Home Dwelling (A B C & D)
Number
Average Value
Number
Average Value
Number
Average Value
Number
Average Value
Number
Average Value
Number
Average Value
LOANS ORIGINATED
5
$144,266
160
$131,420
248
$125,770
46
$58,107
14
$114,409
6
$81,075
APPLICATIONS APPROVED, NOT ACCEPTED
2
$38,610
13
$100,356
29
$124,608
9
$19,613
0
$0
2
$40,195
APPLICATIONS DENIED
7
$141,779
20
$89,259
150
$120,728
46
$51,060
4
$156,208
16
$79,171
APPLICATIONS WITHDRAWN
0
$0
24
$128,188
97
$123,340
17
$90,830
3
$93,523
4
$97,555
FILES CLOSED FOR INCOMPLETENESS
0
$0
6
$123,320
37
$137,097
0
$0
0
$0
0
$0
Aggregated Statistics For Year 2004 (Based on 4 partial tracts)
A) FHA, FSA/RHS & VA Home Purchase Loans
B) Conventional Home Purchase Loans
C) Refinancings
D) Home Improvement Loans
F) Non-occupant Loans on < 5 Family Dwellings (A B C & D)
G) Loans On Manufactured Home Dwelling (A B C & D)
Number
Average Value
Number
Average Value
Number
Average Value
Number
Average Value
Number
Average Value
Number
Average Value
LOANS ORIGINATED
21
$127,395
146
$127,870
298
$115,187
40
$32,288
12
$50,481
15
$50,569
APPLICATIONS APPROVED, NOT ACCEPTED
0
$0
12
$98,072
62
$129,998
6
$60,095
1
$70,880
0
$0
APPLICATIONS DENIED
8
$93,879
38
$82,075
128
$111,781
48
$45,191
5
$91,474
14
$51,642
APPLICATIONS WITHDRAWN
2
$55,505
15
$114,901
78
$131,616
11
$29,431
2
$130,745
2
$84,460
FILES CLOSED FOR INCOMPLETENESS
0
$0
8
$114,345
11
$145,169
1
$43,960
0
$0
0
$0
Aggregated Statistics For Year 2003 (Based on 4 partial tracts)
A) FHA, FSA/RHS & VA Home Purchase Loans
B) Conventional Home Purchase Loans
C) Refinancings
D) Home Improvement Loans
F) Non-occupant Loans on < 5 Family Dwellings (A B C & D)
Number
Average Value
Number
Average Value
Number
Average Value
Number
Average Value
Number
Average Value
LOANS ORIGINATED
18
$117,160
128
$120,311
683
$114,911
73
$37,753
25
$72,293
APPLICATIONS APPROVED, NOT ACCEPTED
0
$0
14
$88,729
57
$101,778
9
$16,822
0
$0
APPLICATIONS DENIED
4
$123,622
31
$83,042
147
$107,121
49
$18,412
9
$65,913
APPLICATIONS WITHDRAWN
0
$0
9
$91,209
98
$121,118
23
$26,007
2
$26,420
FILES CLOSED FOR INCOMPLETENESS
0
$0
4
$112,850
22
$133,603
4
$87,022
0
$0
Aggregated Statistics For Year 2002 (Based on 4 partial tracts)
A) FHA, FSA/RHS & VA Home Purchase Loans
B) Conventional Home Purchase Loans
C) Refinancings
D) Home Improvement Loans
F) Non-occupant Loans on < 5 Family Dwellings (A B C & D)
Number
Average Value
Number
Average Value
Number
Average Value
Number
Average Value
Number
Average Value
LOANS ORIGINATED
40
$114,680
147
$120,752
517
$117,479
26
$39,497
9
$66,824
APPLICATIONS APPROVED, NOT ACCEPTED
0
$0
15
$93,149
63
$102,230
7
$41,726
3
$83,657
APPLICATIONS DENIED
4
$93,385
12
$76,885
88
$108,454
21
$25,177
8
$75,446
APPLICATIONS WITHDRAWN
0
$0
20
$99,822
60
$110,613
1
$11,090
5
$52,446
FILES CLOSED FOR INCOMPLETENESS
2
$89,290
2
$103,580
23
$114,824
0
$0
0
$0
Aggregated Statistics For Year 2001 (Based on 4 partial tracts)
A) FHA, FSA/RHS & VA Home Purchase Loans
B) Conventional Home Purchase Loans
C) Refinancings
D) Home Improvement Loans
F) Non-occupant Loans on < 5 Family Dwellings (A B C & D)
Number
Average Value
Number
Average Value
Number
Average Value
Number
Average Value
Number
Average Value
LOANS ORIGINATED
30
$109,291
141
$114,606
479
$106,356
61
$23,453
22
$59,651
APPLICATIONS APPROVED, NOT ACCEPTED
2
$144,220
10
$109,806
56
$96,971
7
$24,457
0
$0
APPLICATIONS DENIED
2
$67,570
19
$83,981
121
$93,166
16
$18,509
2
$47,275
APPLICATIONS WITHDRAWN
2
$78,830
8
$153,671
63
$101,942
2
$16,585
4
$102,950
FILES CLOSED FOR INCOMPLETENESS
0
$0
9
$73,900
18
$148,331
2
$12,065
0
$0
Aggregated Statistics For Year 2000 (Based on 4 partial tracts)
A) FHA, FSA/RHS & VA Home Purchase Loans
B) Conventional Home Purchase Loans
C) Refinancings
D) Home Improvement Loans
F) Non-occupant Loans on < 5 Family Dwellings (A B C & D)
Number
Average Value
Number
Average Value
Number
Average Value
Number
Average Value
Number
Average Value
LOANS ORIGINATED
23
$104,913
129
$102,010
113
$93,103
77
$20,829
9
$67,382
APPLICATIONS APPROVED, NOT ACCEPTED
4
$80,935
18
$74,924
42
$76,237
14
$17,294
0
$0
APPLICATIONS DENIED
4
$87,040
20
$65,574
49
$60,833
10
$42,945
4
$80,415
APPLICATIONS WITHDRAWN
0
$0
7
$109,589
26
$64,322
0
$0
0
$0
FILES CLOSED FOR INCOMPLETENESS
0
$0
0
$0
8
$73,126
0
$0
0
$0
Aggregated Statistics For Year 1999 (Based on 2 partial tracts)
A) FHA, FSA/RHS & VA Home Purchase Loans
B) Conventional Home Purchase Loans
C) Refinancings
D) Home Improvement Loans
F) Non-occupant Loans on < 5 Family Dwellings (A B C & D)
Detailed PMIC statistics for the following Tracts:0104.00
, 0105.00
2002 - 2018 National Fire Incident Reporting System (NFIRS) incidents
According to the data from the years 2002 - 2018 the average number of fire incidents per year is 14. The highest number of fire incidents - 37 took place in 2002, and the least - 0 in 2013. The data has a dropping trend.
When looking into fire subcategories, the most reports belonged to: Structure Fires (47.3%), and Outside Fires (41.1%).
Fire incident types reported to NFIRS in Zip Code 46979


 Nearest zip codes: 46039, 46915, 46057, 46049, 46901, 46998.


 According to the data from the years 2002 - 2018 the average number of fire incidents per year is 14. The highest number of fire incidents - 37 took place in 2002, and the least - 0 in 2013. The data has a dropping trend.
 When looking into fire subcategories, the most reports belonged to: Structure Fires (47.3%), and Outside Fires (41.1%).