Estimated zip code population in 2022: 3,458 Zip code population in 2010: 3,143 Zip code population in 2000: 3,301
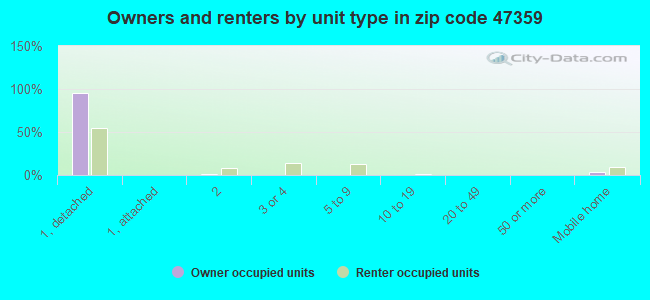
Houses and condos: 1,501 Renter-occupied apartments: 341
% of renters here:
27%
State:
29%
March 2022 cost of living index in zip code 47359: 84.2 (less than average, U.S. average is 100)
Land area: 60.3 sq. mi. Water area: 0.2 sq. mi.
Population density: 57 people per square mile
(very low).
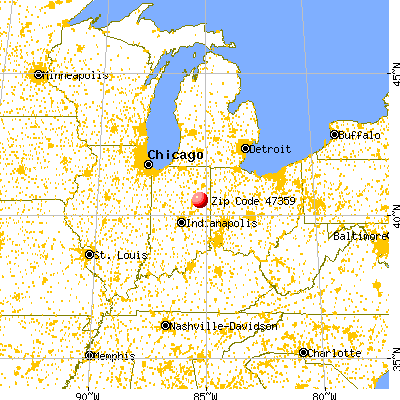
OSM Map
General Map
Google Map
MSN Map
OSM Map
General Map
Google Map
MSN Map
OSM Map
General Map
Google Map
MSN Map
OSM Map
General Map
Google Map
MSN Map
Please wait while loading the map...
Real estate property taxes paid for housing units in 2022:
This zip code:
0.9% ($956)
Indiana:
0.7% ($1,467)
Median real estate property taxes paid for housing units with mortgages in 2022: $1,209 (0.9%) Median real estate property taxes paid for housing units with no mortgage in 2022: $667 (0.8%)
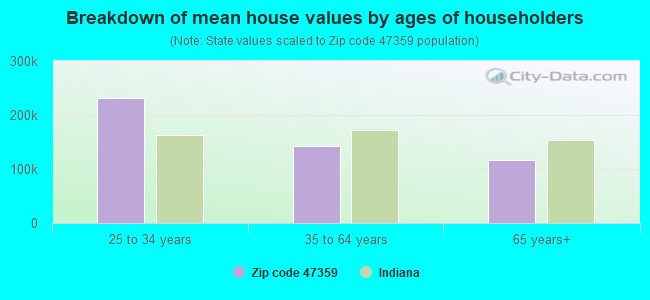
Estimated median house/condo value in 2022: $110,943
47359:
$110,943
Indiana:
$208,700
According to our research of Indiana and other state lists, there were 4 registered sex offenders living in 47359 zip code as of June 19, 2024. The ratio of all residents to sex offenders in zip code 47359 is 729 to 1. The ratio of registered sex offenders to all residents in this zip code is lower than the state average.
Median resident age:
This zip code:
41.6 years
Indiana median age:
38.2 years
Average household size:
This zip code:
2.8 people
Indiana:
2.4 people
Averages for the 2020 tax year for zip code 47359, filed in 2021:
Average Adjusted Gross Income (AGI) in 2020: $48,046 (Individual Income Tax Returns)
Here:
$48,046
State:
$64,978
Salary/wage: $42,212 (reported on 82.1% of returns)
Here:
$42,212
State:
$55,245
(% of AGI for various income ranges: 1154.5% for AGIs below $25k, 3758.1% for AGIs $25k-50k, 6334.7% for AGIs $50k-75k, 9267.8% for AGIs $75k-100k, 18550.0% for AGIs $100k-200k)
Taxable interest for individuals: $812 (reported on 24.6% of returns)
This zip code:
$812
Indiana:
$1,351
(% of AGI for various income ranges: 13.5% for AGIs below $25k, 10.6% for AGIs $25k-50k, 17.3% for AGIs $50k-75k, 27.8% for AGIs $75k-100k, 201.4% for AGIs $100k-200k)
Ordinary dividends: $2,324 (reported on 15.7% of returns)
Here:
$2,324
State:
$5,827
(% of AGI for various income ranges: 20.0% for AGIs below $25k, 13.1% for AGIs $25k-50k, 41.3% for AGIs $50k-75k, 114.4% for AGIs $75k-100k, 312.9% for AGIs $100k-200k)
Net capital gain/loss in AGI: +$5,181 (reported on 15.7% of returns)
Here:
+$5,181
State:
+$17,730
(% of AGI for various income ranges: 7.1% for AGIs below $25k, 8.8% for AGIs $25k-50k, 11.3% for AGIs $50k-75k, 165.6% for AGIs $75k-100k, 1245.7% for AGIs $100k-200k)
Profit/loss from business: +$3,820 (reported on 11.2% of returns)
Here:
+$3,820
State:
+$12,144
(% of AGI for various income ranges: 49.7% for AGIs below $25k, 61.9% for AGIs $25k-50k, 102.0% for AGIs $50k-75k, 97.1% for AGIs $100k-200k)
Taxable individual retirement arrangement distribution: $11,285 (reported on 9.7% of returns)
47359:
$11,285
Indiana:
$18,302
(% of AGI for various income ranges: 63.2% for AGIs below $25k, 58.4% for AGIs $25k-50k, 161.3% for AGIs $50k-75k, 482.2% for AGIs $75k-100k, 582.9% for AGIs $100k-200k)
Earned income credit: $2,104 (reported on 18.7% of returns)
Here:
$2,104
State:
$2,298
(% of AGI for various income ranges: 96.5% for AGIs below $25k, 70.9% for AGIs $25k-50k)
Percentage of individuals using paid preparers for their 2020 taxes: 96.3%
Here:
96%
State:
94%
(% for various income ranges: 96.0% for AGIs below $25k, 94.9% for AGIs $25k-50k, 95.0% for AGIs $50k-75k, 100.0% for AGIs $75k-100k, 100.0% for AGIs $100k-200k)
Averages for the 2012 tax year for zip code 47359, filed in 2013:
Average Adjusted Gross Income (AGI) in 2012: $38,806 (Individual Income Tax Returns)
Here:
$38,806
State:
$52,932
Salary/wage: $33,895 (reported on 81.8% of returns)
Here:
$33,895
State:
$45,173
(% of AGI for various income ranges: 68.6% for AGIs below $25k, 81.4% for AGIs $25k-50k, 80.9% for AGIs $50k-75k, 78.3% for AGIs $75k-100k, 49.8% for AGIs $100k-200k)
Taxable interest for individuals: $924 (reported on 26.6% of returns)
This zip code:
$924
Indiana:
$1,311
(% of AGI for various income ranges: 1.5% for AGIs below $25k, 0.6% for AGIs $25k-50k, 0.4% for AGIs $50k-75k, 0.3% for AGIs $75k-100k, 0.5% for AGIs $100k-200k)
Ordinary dividends: $1,959 (reported on 15.4% of returns)
Here:
$1,959
State:
$4,690
(% of AGI for various income ranges: 1.1% for AGIs below $25k, 0.4% for AGIs $25k-50k, 0.4% for AGIs $50k-75k, 0.3% for AGIs $75k-100k, 1.5% for AGIs $100k-200k)
Net capital gain/loss in AGI: +$3,474 (reported on 13.3% of returns)
Here:
+$3,474
State:
+$10,406
(% of AGI for various income ranges: 0.3% for AGIs $50k-75k, 0.6% for AGIs $75k-100k, 4.5% for AGIs $100k-200k)
Profit/loss from business: +$3,920 (reported on 10.5% of returns)
Here:
+$3,920
State:
+$11,105
(% of AGI for various income ranges: 3.1% for AGIs below $25k, 1.9% for AGIs $25k-50k, 1.0% for AGIs $75k-100k)
Taxable individual retirement arrangement distribution: $6,182 (reported on 11.9% of returns)
47359:
$6,182
Indiana:
$13,841
(% of AGI for various income ranges: 4.1% for AGIs below $25k, 1.7% for AGIs $25k-50k, 1.7% for AGIs $50k-75k, 3.3% for AGIs $75k-100k)
Total itemized deductions: $18,406 (20% of AGI, reported on 11.9% of returns)
Here:
$18,406
State:
$20,913
Here:
20.4% of AGI
State:
18.2% of AGI
(% of AGI for various income ranges: 3.3% for AGIs below $25k, 4.2% for AGIs $25k-50k, 4.1% for AGIs $50k-75k, 6.3% for AGIs $75k-100k, 9.5% for AGIs $100k-200k)
Charity contributions: $6,191 (reported on 7.7% of returns)
Here:
$6,191
State:
$4,697
(% of AGI for various income ranges: 0.7% for AGIs $25k-50k, 0.5% for AGIs $50k-75k, 1.1% for AGIs $75k-100k, 3.2% for AGIs $100k-200k)
Taxes paid: $5,971 (reported on 11.9% of returns)
47359:
$5,971
State:
$7,456
(% of AGI for various income ranges: 0.6% for AGIs below $25k, 0.8% for AGIs $25k-50k, 1.3% for AGIs $50k-75k, 1.8% for AGIs $75k-100k, 4.2% for AGIs $100k-200k)
Earned income credit: $2,373 (reported on 21.0% of returns)
Here:
$2,373
State:
$2,265
(% of AGI for various income ranges: 6.7% for AGIs below $25k, 1.4% for AGIs $25k-50k)
Percentage of individuals using paid preparers for their 2012 taxes: 74.1%
Here:
74%
State:
53%
(% for various income ranges: 71.6% for AGIs below $25k, 73.7% for AGIs $25k-50k, 75.0% for AGIs $50k-75k, 80.0% for AGIs $75k-100k, 87.5% for AGIs $100k-200k)
Averages for the 2004 tax year for zip code 47359, filed in 2005:
Average Adjusted Gross Income (AGI) in 2004: $33,939 (Individual Income Tax Returns)
Here:
$33,939
State:
$44,790
Salary/wage: $32,001 (reported on 87.0% of returns)
Here:
$32,001
State:
$39,615
(% of AGI for various income ranges: 91.3% for AGIs below $10k, 79.0% for AGIs $10k-25k, 86.2% for AGIs $25k-50k, 89.3% for AGIs $50k-75k, 84.4% for AGIs $75k-100k, 61.7% for AGIs over 100k)
Taxable interest for individuals: $1,197 (reported on 43.7% of returns)
This zip code:
$1,197
Indiana:
$1,535
(% of AGI for various income ranges: 8.0% for AGIs below $10k, 2.9% for AGIs $10k-25k, 0.9% for AGIs $25k-50k, 0.8% for AGIs $50k-75k, 0.6% for AGIs $75k-100k, 2.6% for AGIs over 100k)
Taxable dividends: $1,273 (reported on 18.4% of returns)
Here:
$1,273
State:
$2,998
(% of AGI for various income ranges: 2.8% for AGIs below $10k, 0.8% for AGIs $10k-25k, 0.7% for AGIs $25k-50k, 0.4% for AGIs $50k-75k, 0.3% for AGIs $75k-100k, 0.9% for AGIs over 100k)
Net capital gain/loss: +$1,493 (reported on 14.0% of returns)
Here:
+$1,493
State:
+$8,619
(% of AGI for various income ranges: -1.2% for AGIs below $10k, 0.3% for AGIs $10k-25k, 0.1% for AGIs $25k-50k, -0.1% for AGIs $50k-75k, 1.3% for AGIs $75k-100k, 2.7% for AGIs over 100k)
Profit/loss from business: +$4,406 (reported on 11.4% of returns)
Here:
+$4,406
State:
+$10,071
(% of AGI for various income ranges: 4.1% for AGIs below $10k, 2.5% for AGIs $10k-25k, 1.5% for AGIs $25k-50k, 0.0% for AGIs $50k-75k, -0.4% for AGIs $75k-100k, 4.0% for AGIs over 100k)
IRA payment deduction: $2,390 (reported on 2.8% of returns)
47359:
$2,390
Indiana:
$2,840
Total itemized deductions: $14,253 (21% of AGI, reported on 15.8% of returns)
Here:
$14,253
State:
$17,065
Here:
20.8% of AGI
State:
19.5% of AGI
(% of AGI for various income ranges: 4.5% for AGIs $10k-25k, 4.4% for AGIs $25k-50k, 7.5% for AGIs $50k-75k, 8.7% for AGIs $75k-100k, 10.8% for AGIs over 100k)
Charity contributions deductions: $3,730 (5% of AGI, reported on 11.0% of returns)
Here:
$3,730
State:
$3,550
Here:
5.0% of AGI
State:
3.8% of AGI
(% of AGI for various income ranges: 2.2% for AGIs below $10k, 0.5% for AGIs $25k-50k, 0.9% for AGIs $50k-75k, 2.0% for AGIs $75k-100k, 3.2% for AGIs over 100k)
Total tax: $4,023 (reported on 72.2% of returns)
47359:
$4,023
State:
$6,914
(% of AGI for various income ranges: 2.7% for AGIs below $10k, 3.8% for AGIs $10k-25k, 6.2% for AGIs $25k-50k, 8.4% for AGIs $50k-75k, 10.4% for AGIs $75k-100k, 17.1% for AGIs over 100k)
Earned income credit: $1,725 (reported on 18.1% of returns)
Here:
$1,725
State:
$1,685
Percentage of individuals using paid preparers for their 2004 taxes: 71.5%
Here:
72%
State:
59%
(% for various income ranges: 68.9% for AGIs below $10k, 70.6% for AGIs $10k-25k, 68.9% for AGIs $25k-50k, 77.5% for AGIs $50k-75k, 77.5% for AGIs $75k-100k, 84.9% for AGIs over 100k)
Likely homosexual households (counted as self-reported same-sex unmarried-partner households)
Lesbian couples: 0.3% of all households
Gay men: 0.0% of all households
Household received Food Stamps/SNAP in the past 12 months: 182 Household did not receive Food Stamps/SNAP in the past 12 months: 1,061
Women who had a birth in the past 12 months: 5 (0 now married, 4 unmarried) Women who did not have a birth in the past 12 months: 737 (327 now married, 410 unmarried)
Housing units in zip code 47359 with a mortgage: 615 (130 second mortgage, 123 both second mortgage and home equity loan) Median monthly owner costs for units with a mortgage: $1,164 Median monthly owner costs for units without a mortgage: $451
Residents with income below the poverty level in 2022:
This zip code:
9.8%
Whole state:
12.6%
Residents with income below 50% of the poverty level in 2022:
This zip code:
6.7%
Whole state:
6.3%
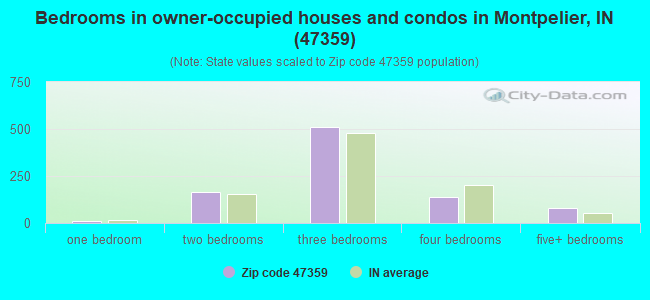
Median number of rooms in houses and condos:
Here:
7.1
State:
6.6
Median number of rooms in apartments:
Here:
5.3
State:
4.3
Notable locations in this zip code not listed on our city pages
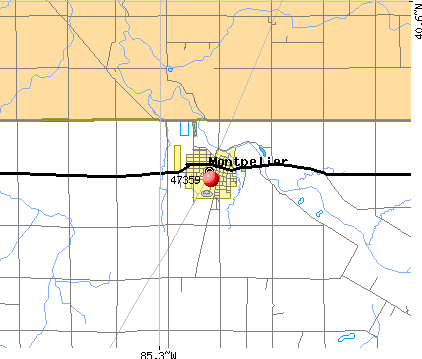
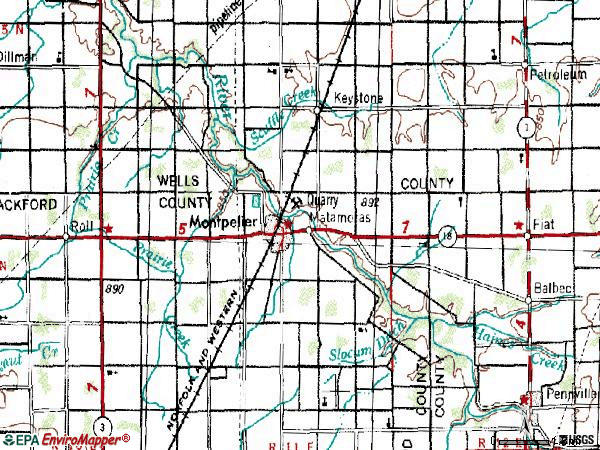
Notable locations in zip code 47359: Oswalt Hog Farm (A), Montpelier - Harrison Township Volunteer Fire Department Station 1 (B), Montpelier - Harrison Township Volunteer Fire Department Station 2 (C). Display/hide their locations on the map
Size of family households: 342 2-persons, 186 3-persons, 124 4-persons, 11 5-persons, 160 6-persons, 14 7-or-more-persons
Size of nonfamily households: 364 1-person, 43 2-persons
545 married couples with children.
92 single-parent households (16 men, 76 women).
98.1% of residents of 47359 zip code speak English at home.
0.4% of residents speak Spanish at home (27% very well, 73% well).
0.5% of residents speak other Indo-European language at home (100% very well).
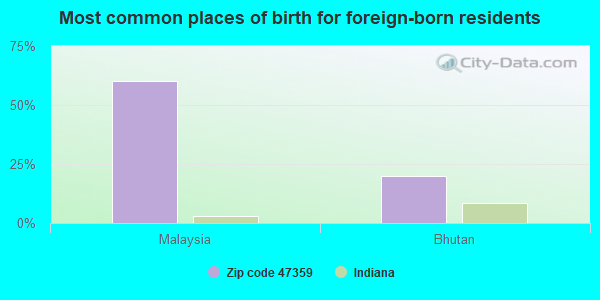
Foreign born population: 15 (0.4%) (0.0% of them are naturalized citizens)
:
0.4%
Whole state:
6.1%
60%Malaysia
20%Bhutan
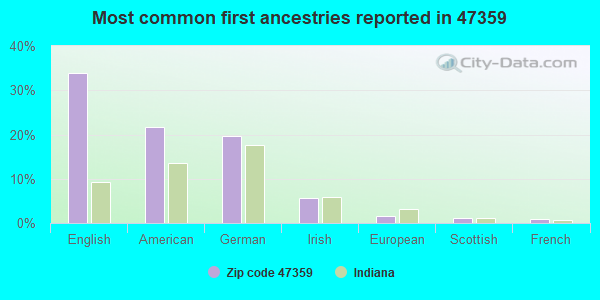
34%English
22%American
20%German
6%Irish
2%European
1%Scottish
1%French
Year of entry for the foreign-born population
72010 or later
112000 to 2009
01990 to 1999
0Before 1990
Facilities with environmental interests located in this zip code:
GRIPCO A BLACK & DECKER CO (7345 N 400 E in MONTPELIER, IN)
(Integrated Compliance Information System) - ICIS-05-1994-0337, FORMAL ENFORCEMENT ACTION STATE MASTER (Indiana facility tracking) - CRTK-832, EPCRA, UST-2297, UNDERGROUND STORAGE TANK PROGRAM, ACES-CP-0017, AIR PROGRAM, ACES-CP-00900017, ACES-OP-00900017, National Pollutant Discharge Elimination System NON-MAJOR (Tracking pollutant discharge elimination systems) - permit Conditionally Exempt Small Quantity Generators, less than 100 kg/month of hazardous waste (Resource Conservation and Recovery Act (tracking hazardous waste)) - notification TRI REPORTER (Tracking of toxic chemicals releasing facilities) Business SIC classification: BOLTS, NUTS, SCREWS, RIVETS, AND WASHERS Organizations: MICHAEL E WALKER (CONTACT/OPERATOR)
, GRIPCO FASTENER DIVISION OF MITE CORP (CONTACT/OWNER)
, EMHART TEKNOLOGIES (CONTACT/OWNER)
Alternative names: BLACK & DECKER CORP. GRIPCO FASTENER DIV., EMHART AUTOMOTIVE, EMHART AUTOMOTIVE GRIPCO, GRIPCO FASTENER DIV BLACK AND DECKER
MONTPELIER STONE CO (5067 E CUMMINGS RD in MONTPELIER, IN)
AIR MINOR (AIRS/AFS) STATE MASTER (Indiana facility tracking) - ACES-OP-00900001, AIR PROGRAM, UST-1681, UNDERGROUND STORAGE TANK PROGRAM National Pollutant Discharge Elimination System NON-MAJOR (Tracking pollutant discharge elimination systems) - permit Business SIC classification: CRUSHED AND BROKEN LIMESTONE Organizations: KATRINA F SMART (CONTACT/OPERATOR)
, IRVING MATERIALS INC (CONTACT/OWNER)
Alternative names: IMI/MONTPELIER PLANT
MONTPELIER MIDDLE SCHOOL (107 E MONROE ST in MONTPELIER, IN)
STATE MASTER (Indiana facility tracking) - UST-4409, UNDERGROUND STORAGE TANK PROGRAM (National Center for Education Statistics) - STATE ID-0485 Organizations: BLACKFORD COUNTY SCHOOLS (SCHOOL DISTRICT)
BRC RUBBER GROUP (623 W MONROE ST in MONTPELIER, IN)
AIR SYNTHETIC MINOR (AIRS/AFS) STATE MASTER (Indiana facility tracking) - CRTK-1664, EPCRA, CRTK-19154, UST-359, UNDERGROUND STORAGE TANK PROGRAM, ACES-OP-00900002, AIR PROGRAM, LUST-199211534, LEAKING STORAGE TANK CRITERIA AND HAZARDOUS AIR POLLUTANT INVENTORY (Inventory of air pollution sources) Small Quantity Generators, between 100 kg and 1000 kg of hazardous waste/month (Resource Conservation and Recovery Act (tracking hazardous waste)) - notification TSD (Resource Conservation and Recovery Act (tracking hazardous waste)) TRI REPORTER (Tracking of toxic chemicals releasing facilities) Business SIC classification: MOLDED, EXTRUDED, AND LATHE-CUT MECHANICAL RUBBER GOODS; FABRICATED RUBBER PRODUCTS Organizations: BRC RUBBER GROUP INC (CONTACT/OWNER)
Alternative names: BRC MONTPELIER DIV, BRC RUBBER & PLASTICS INC., BRC RUBBER & PLASTICS INC., BRC RUBBER GROUP INC., MONTPELIER DIV., BRC RUBBER GROUP MONTPELIER, BRC RUBBER GROUP-MONTPELIER DIVISION
AG BEST CO OP MONTPELIER (5202 E 800 N in MONTPELIER, IN)
ENFORCEMENT/COMPLIANCE ACTIVITY (Integrated Compliance Information System) STATE MASTER (Indiana facility tracking) - CRTK-8039, EPCRA COMPLIANCE ACTIVITY (Tracking inspections of insecticide, fungicide, and rodenticide, and toxic substances) Alternative names: MONTPELIER AG CENTER, MONTPELIER AG CENTER-FARM
MONTPELIER MUNICIPAL WWTP (7611 N 450 E in MONTPELIER, IN)
STATE MASTER (Indiana facility tracking) National Pollutant Discharge Elimination System NON-MAJOR (Tracking pollutant discharge elimination systems) - permit Business SIC classification: SEWERAGE SYSTEMS Organizations: G R KIRBY CERT OPER (CONTACT/OPERATOR)
, MONTPELIER CITY HALL (CONTACT/OWNER)
Alternative names: MONTPELIER MUNICIPAL STP
CENTRAL STATES ENTERPRISES INCORPORATED (C. R. 400 E in MONTPELIER, IN)
AIR SYNTHETIC MINOR (AIRS/AFS) STATE MASTER (Indiana facility tracking) Business SIC classification: GRAIN AND FIELD BEANS
Housing units lacking complete plumbing facilities: 8.0% Housing units lacking complete kitchen facilities: 4.5%
44.9%Electricity
32.6%Utility gas
12.3%Bottled, tank, or LP gas
6.2%Wood
4.1%Fuel oil, kerosene, etc.
Population in 1990: 3,753.
Place of birth for U.S.-born residents:
This state: 2,742
Northeast: 90
Midwest: 381
South: 138
West: 67
59% of the 47359 zip code residents lived in the same house 5 years ago. Out of people who lived in different houses, 54% lived in this county. Out of people who lived in different counties, 50% lived in Indiana.
90% of the 47359 zip code residents lived in the same house 1 year ago. Out of people who lived in different houses, 28% moved from this county. Out of people who lived in different houses, 41% moved from different county within same state. Out of people who lived in different houses, 30% moved from different state. Out of people who lived in different houses, 2% moved from abroad.
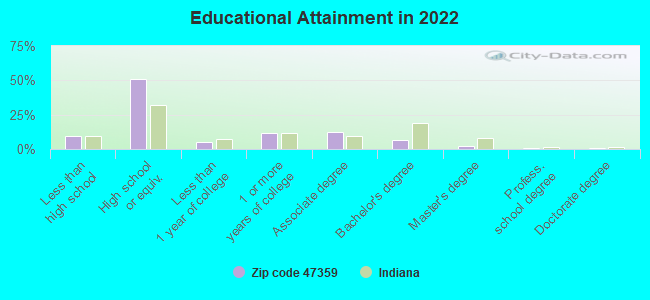
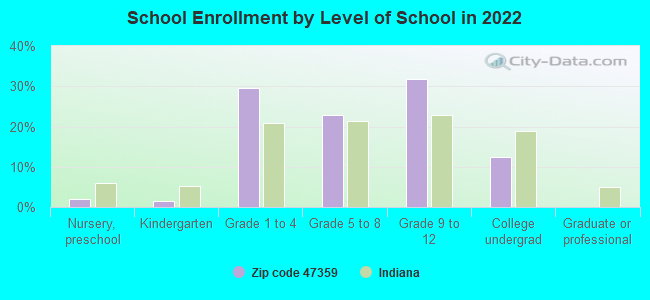
Private vs. public school enrollment:
Students in private schools in grades 1 to 8 (elementary and middle school): 36
Here:
7.9%
Indiana:
14.9%
Students in private schools in grades 9 to 12 (high school):
Here:
0.0%
Indiana:
11.4%
Students in private undergraduate colleges: 15
Here:
14.3%
Indiana:
22.3%
Occupation by median earnings in the past 12 months ($)
70,024Transportation occupations
68,886Management occupations
63,455Health diagnosing and treating practitioners and other technical occupations
48,161Architecture and engineering occupations
46,732Installation, maintenance, and repair occupations
41,132Office and administrative support occupations
Top industries in this zip code by the number of employees in 2005:
Professional, Scientific, and Technical Services: Process, Physical Distribution, and Logistics Consulting Services (20-49 employees: 1 establishment)
Finance and Insurance: Investment Advice (20-49: 1)
Wholesale Trade: Grain and Field Bean Merchant Wholesalers (10-19: 1, 5-9: 1)
Fatal accident statistics in 2011:
Fatal accident count: 1
Vehicles involved in fatal accidents: 1
Fatal accidents caused by drunken drivers: 0
Fatalities: 2
Persons involved in fatal accidents: 4
Pedestrians involved in fatal accidents: 0
2002 - 2018 National Fire Incident Reporting System (NFIRS) incidents
According to the data from the years 2002 - 2018 the average number of fire incidents per year is 16. The highest number of fire incidents - 29 took place in 2010, and the least - 0 in 2014. The data has a dropping trend.
When looking into fire subcategories, the most incidents belonged to: Outside Fires (46.2%), and Structure Fires (30.3%).
Fire incident types reported to NFIRS in Zip Code 47359


 Nearest zip codes: 46781, 47348, 46759, 47369, 46766, 47336.


 According to the data from the years 2002 - 2018 the average number of fire incidents per year is 16. The highest number of fire incidents - 29 took place in 2010, and the least - 0 in 2014. The data has a dropping trend.
 When looking into fire subcategories, the most incidents belonged to: Outside Fires (46.2%), and Structure Fires (30.3%).