Estimated zip code population in 2022: 4,623 Zip code population in 2010: 4,069 Zip code population in 2000: 3,532
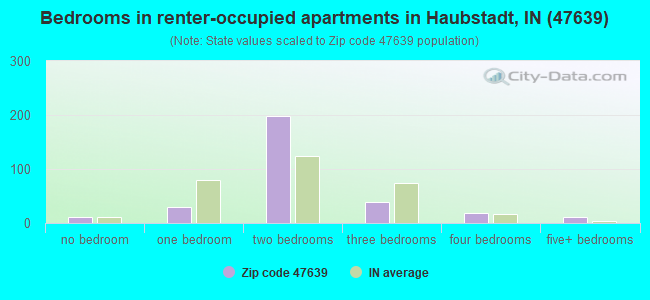
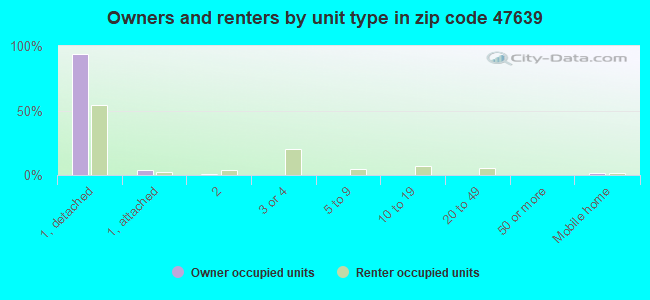
Houses and condos: 1,811 Renter-occupied apartments: 313
% of renters here:
18%
State:
29%
March 2022 cost of living index in zip code 47639: 86.3 (less than average, U.S. average is 100)
Land area: 43.1 sq. mi. Water area: 0.1 sq. mi.
Population density: 107 people per square mile
(very low).
OSM Map
General Map
Google Map
MSN Map
OSM Map
General Map
Google Map
MSN Map
OSM Map
General Map
Google Map
MSN Map
OSM Map
General Map
Google Map
MSN Map
Please wait while loading the map...
Real estate property taxes paid for housing units in 2022:
This zip code:
0.7% ($1,828)
Indiana:
0.7% ($1,467)
Median real estate property taxes paid for housing units with mortgages in 2022: $1,950 (0.6%) Median real estate property taxes paid for housing units with no mortgage in 2022: $1,632 (0.8%)
Estimated median house/condo value in 2022: $280,767
47639:
$280,767
Indiana:
$208,700
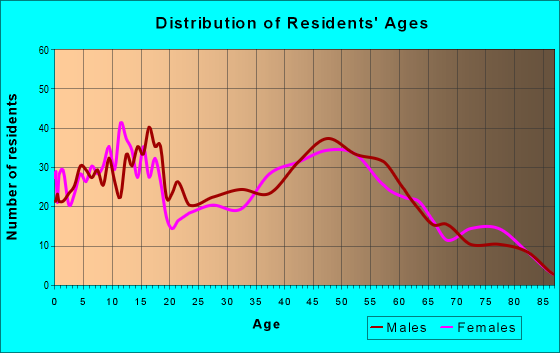
Median resident age:
This zip code:
38.1 years
Indiana median age:
38.2 years
Average household size:
This zip code:
2.7 people
Indiana:
2.4 people
Averages for the 2020 tax year for zip code 47639, filed in 2021:
Average Adjusted Gross Income (AGI) in 2020: $83,013 (Individual Income Tax Returns)
Here:
$83,013
State:
$64,978
Salary/wage: $71,102 (reported on 80.4% of returns)
Here:
$71,102
State:
$55,245
(% of AGI for various income ranges: 1086.6% for AGIs below $25k, 3504.1% for AGIs $25k-50k, 6505.2% for AGIs $50k-75k, 8868.0% for AGIs $75k-100k, 16778.6% for AGIs $100k-200k, 50346.0% for AGIs over 200k)
Taxable interest for individuals: $1,363 (reported on 48.3% of returns)
This zip code:
$1,363
Indiana:
$1,351
(% of AGI for various income ranges: 36.6% for AGIs below $25k, 52.2% for AGIs $25k-50k, 64.3% for AGIs $50k-75k, 55.5% for AGIs $75k-100k, 90.6% for AGIs $100k-200k, 1318.0% for AGIs over 200k)
Ordinary dividends: $4,684 (reported on 37.0% of returns)
Here:
$4,684
State:
$5,827
(% of AGI for various income ranges: 80.0% for AGIs below $25k, 135.2% for AGIs $25k-50k, 253.5% for AGIs $50k-75k, 236.5% for AGIs $75k-100k, 319.4% for AGIs $100k-200k, 2260.0% for AGIs over 200k)
Net capital gain/loss in AGI: +$13,284 (reported on 31.7% of returns)
Here:
+$13,284
State:
+$17,730
(% of AGI for various income ranges: 19.7% for AGIs below $25k, 46.7% for AGIs $25k-50k, 244.8% for AGIs $50k-75k, 271.5% for AGIs $75k-100k, 485.0% for AGIs $100k-200k, 13300.0% for AGIs over 200k)
Profit/loss from business: +$13,957 (reported on 13.0% of returns)
Here:
+$13,957
State:
+$12,144
(% of AGI for various income ranges: 85.7% for AGIs below $25k, 167.8% for AGIs $25k-50k, 142.6% for AGIs $50k-75k, 61.5% for AGIs $75k-100k, 413.3% for AGIs $100k-200k, 2990.0% for AGIs over 200k)
Taxable individual retirement arrangement distribution: $19,073 (reported on 16.1% of returns)
47639:
$19,073
Indiana:
$18,302
(% of AGI for various income ranges: 163.7% for AGIs below $25k, 274.1% for AGIs $25k-50k, 423.5% for AGIs $50k-75k, 572.0% for AGIs $75k-100k, 716.7% for AGIs $100k-200k, 2092.0% for AGIs over 200k)
Total itemized deductions: $31,992 (reported on 5.2% of returns)
Here:
$31,992
State:
$35,601
(% of AGI for various income ranges: 421.3% for AGIs $50k-75k, 356.1% for AGIs $100k-200k, 3176.0% for AGIs over 200k)
Charity contributions: $10,030 (reported on 4.3% of returns)
Here:
$10,030
State:
$15,596
(% of AGI for various income ranges: 23.4% for AGIs below $25k, 106.7% for AGIs $100k-200k, 1074.0% for AGIs over 200k)
Taxes paid: $7,642 (reported on 5.2% of returns)
47639:
$7,642
State:
$7,542
(% of AGI for various income ranges: 80.0% for AGIs $50k-75k, 100.3% for AGIs $100k-200k, 744.0% for AGIs over 200k)
Earned income credit: $1,593 (reported on 6.1% of returns)
Here:
$1,593
State:
$2,298
(% of AGI for various income ranges: 33.4% for AGIs below $25k, 39.3% for AGIs $25k-50k)
Percentage of individuals using paid preparers for their 2020 taxes: 96.5%
Here:
97%
State:
94%
(% for various income ranges: 93.3% for AGIs below $25k, 97.3% for AGIs $25k-50k, 97.1% for AGIs $50k-75k, 96.6% for AGIs $75k-100k, 98.2% for AGIs $100k-200k, 100.0% for AGIs over 200k)
Averages for the 2012 tax year for zip code 47639, filed in 2013:
Average Adjusted Gross Income (AGI) in 2012: $62,331 (Individual Income Tax Returns)
Here:
$62,331
State:
$52,932
Salary/wage: $54,656 (reported on 84.5% of returns)
Here:
$54,656
State:
$45,173
(% of AGI for various income ranges: 68.7% for AGIs below $25k, 73.4% for AGIs $25k-50k, 75.1% for AGIs $50k-75k, 80.1% for AGIs $75k-100k, 80.2% for AGIs $100k-200k, 47.3% for AGIs over 200k)
Taxable interest for individuals: $1,022 (reported on 50.7% of returns)
This zip code:
$1,022
Indiana:
$1,311
(% of AGI for various income ranges: 2.7% for AGIs below $25k, 1.8% for AGIs $25k-50k, 0.9% for AGIs $50k-75k, 0.7% for AGIs $75k-100k, 0.4% for AGIs $100k-200k, 0.7% for AGIs over 200k)
Ordinary dividends: $2,922 (reported on 35.2% of returns)
Here:
$2,922
State:
$4,690
(% of AGI for various income ranges: 2.3% for AGIs below $25k, 2.1% for AGIs $25k-50k, 1.9% for AGIs $50k-75k, 1.1% for AGIs $75k-100k, 1.3% for AGIs $100k-200k, 2.8% for AGIs over 200k)
Net capital gain/loss in AGI: +$2,849 (reported on 24.2% of returns)
Here:
+$2,849
State:
+$10,406
(% of AGI for various income ranges: 0.6% for AGIs $25k-50k, 1.0% for AGIs $50k-75k, 0.6% for AGIs $75k-100k, 1.7% for AGIs $100k-200k, 1.4% for AGIs over 200k)
Profit/loss from business: +$13,521 (reported on 12.8% of returns)
Here:
+$13,521
State:
+$11,105
(% of AGI for various income ranges: 2.7% for AGIs below $25k, 1.1% for AGIs $25k-50k, 3.0% for AGIs $50k-75k, 2.5% for AGIs $75k-100k, 4.2% for AGIs $100k-200k)
Taxable individual retirement arrangement distribution: $10,742 (reported on 14.2% of returns)
47639:
$10,742
Indiana:
$13,841
(% of AGI for various income ranges: 6.6% for AGIs below $25k, 3.0% for AGIs $25k-50k, 3.5% for AGIs $50k-75k, 2.5% for AGIs $75k-100k, 2.0% for AGIs $100k-200k)
Total itemized deductions: $18,145 (17% of AGI, reported on 31.5% of returns)
Here:
$18,145
State:
$20,913
Here:
16.7% of AGI
State:
18.2% of AGI
(% of AGI for various income ranges: 7.6% for AGIs below $25k, 7.1% for AGIs $25k-50k, 8.3% for AGIs $50k-75k, 8.5% for AGIs $75k-100k, 10.6% for AGIs $100k-200k, 9.2% for AGIs over 200k)
Charity contributions: $3,816 (reported on 26.5% of returns)
Here:
$3,816
State:
$4,697
(% of AGI for various income ranges: 0.7% for AGIs below $25k, 1.0% for AGIs $25k-50k, 1.4% for AGIs $50k-75k, 1.6% for AGIs $75k-100k, 1.9% for AGIs $100k-200k, 2.0% for AGIs over 200k)
Taxes paid: $6,454 (reported on 31.5% of returns)
47639:
$6,454
State:
$7,456
(% of AGI for various income ranges: 1.2% for AGIs below $25k, 1.5% for AGIs $25k-50k, 2.3% for AGIs $50k-75k, 2.8% for AGIs $75k-100k, 4.1% for AGIs $100k-200k, 4.9% for AGIs over 200k)
Earned income credit: $1,985 (reported on 5.9% of returns)
Here:
$1,985
State:
$2,265
(% of AGI for various income ranges: 2.3% for AGIs below $25k, 0.6% for AGIs $25k-50k)
Percentage of individuals using paid preparers for their 2012 taxes: 65.8%
Here:
66%
State:
53%
(% for various income ranges: 62.0% for AGIs below $25k, 62.5% for AGIs $25k-50k, 67.6% for AGIs $50k-75k, 65.5% for AGIs $75k-100k, 72.5% for AGIs $100k-200k, 80.0% for AGIs over 200k)
Averages for the 2004 tax year for zip code 47639, filed in 2005:
Average Adjusted Gross Income (AGI) in 2004: $47,705 (Individual Income Tax Returns)
Here:
$47,705
State:
$44,790
Salary/wage: $43,393 (reported on 85.7% of returns)
Here:
$43,393
State:
$39,615
(% of AGI for various income ranges: 90.7% for AGIs below $10k, 63.3% for AGIs $10k-25k, 77.0% for AGIs $25k-50k, 84.4% for AGIs $50k-75k, 87.7% for AGIs $75k-100k, 66.3% for AGIs over 100k)
Taxable interest for individuals: $1,409 (reported on 63.0% of returns)
This zip code:
$1,409
Indiana:
$1,535
(% of AGI for various income ranges: 8.5% for AGIs below $10k, 5.9% for AGIs $10k-25k, 2.4% for AGIs $25k-50k, 1.3% for AGIs $50k-75k, 1.2% for AGIs $75k-100k, 1.4% for AGIs over 100k)
Taxable dividends: $1,991 (reported on 40.0% of returns)
Here:
$1,991
State:
$2,998
(% of AGI for various income ranges: 2.8% for AGIs below $10k, 3.0% for AGIs $10k-25k, 1.8% for AGIs $25k-50k, 1.2% for AGIs $50k-75k, 0.7% for AGIs $75k-100k, 2.5% for AGIs over 100k)
Net capital gain/loss: +$4,385 (reported on 30.4% of returns)
Here:
+$4,385
State:
+$8,619
(% of AGI for various income ranges: -1.6% for AGIs below $10k, 2.0% for AGIs $10k-25k, 1.4% for AGIs $25k-50k, 1.6% for AGIs $50k-75k, 1.2% for AGIs $75k-100k, 6.5% for AGIs over 100k)
Profit/loss from business: +$12,105 (reported on 14.1% of returns)
Here:
+$12,105
State:
+$10,071
(% of AGI for various income ranges: 3.5% for AGIs below $10k, 5.2% for AGIs $10k-25k, 3.8% for AGIs $25k-50k, 2.1% for AGIs $50k-75k, 1.8% for AGIs $75k-100k, 6.1% for AGIs over 100k)
Profit/loss from farming: +$3,224 (reported on 5.0% of returns)
Here:
+$3,224
State:
-$2,212
(% of AGI for various income ranges: -1.9% for AGIs below $10k, 1.4% for AGIs $25k-50k, -0.2% for AGIs $50k-75k, 0.0% for AGIs $75k-100k, 0.7% for AGIs over 100k)
IRA payment deduction: $3,743 (reported on 3.6% of returns)
47639:
$3,743
Indiana:
$2,840
Self-employed pension: $8,625 (reported on 0.8% of returns)
Here:
$8,625
Indiana:
$15,305
Total itemized deductions: $15,398 (19% of AGI, reported on 31.8% of returns)
Here:
$15,398
State:
$17,065
Here:
19.1% of AGI
State:
19.5% of AGI
(% of AGI for various income ranges: 5.1% for AGIs below $10k, 6.4% for AGIs $10k-25k, 8.7% for AGIs $25k-50k, 9.8% for AGIs $50k-75k, 11.2% for AGIs $75k-100k, 11.9% for AGIs over 100k)
Charity contributions deductions: $3,038 (4% of AGI, reported on 28.2% of returns)
Here:
$3,038
State:
$3,550
Here:
3.7% of AGI
State:
3.8% of AGI
(% of AGI for various income ranges: 1.4% for AGIs $10k-25k, 1.3% for AGIs $25k-50k, 1.6% for AGIs $50k-75k, 1.8% for AGIs $75k-100k, 2.4% for AGIs over 100k)
Total tax: $6,067 (reported on 80.7% of returns)
47639:
$6,067
State:
$6,914
(% of AGI for various income ranges: 2.1% for AGIs below $10k, 4.6% for AGIs $10k-25k, 7.7% for AGIs $25k-50k, 8.3% for AGIs $50k-75k, 10.0% for AGIs $75k-100k, 15.4% for AGIs over 100k)
Earned income credit: $1,550 (reported on 5.6% of returns)
Here:
$1,550
State:
$1,685
Percentage of individuals using paid preparers for their 2004 taxes: 68.6%
Here:
69%
State:
59%
(% for various income ranges: 60.2% for AGIs below $10k, 71.4% for AGIs $10k-25k, 71.8% for AGIs $25k-50k, 69.4% for AGIs $50k-75k, 70.2% for AGIs $75k-100k, 71.8% for AGIs over 100k)
Household received Food Stamps/SNAP in the past 12 months: 29 Household did not receive Food Stamps/SNAP in the past 12 months: 1,699
Women who had a birth in the past 12 months: 139 (146 now married, 3 unmarried) Women who did not have a birth in the past 12 months: 840 (539 now married, 303 unmarried)
Housing units in zip code 47639 with a mortgage: 779 (78 second mortgage, 80 both second mortgage and home equity loan) Median monthly owner costs for units with a mortgage: $1,572 Median monthly owner costs for units without a mortgage: $565
Residents with income below the poverty level in 2022:
This zip code:
7.5%
Whole state:
12.6%
Residents with income below 50% of the poverty level in 2022:
This zip code:
5.9%
Whole state:
6.3%
Median number of rooms in houses and condos:
Here:
6.7
State:
6.6
Median number of rooms in apartments:
Here:
4.7
State:
4.3
Notable locations in this zip code not listed on our city pages
Churches in zip code 47639 include: Calverts Chapel (A), Nobles Chapel (B), Saint Stephen Church (C), Tabor Church (D). Display/hide their locations on the map
In group quarters: 8 (-1 institutionalized population)
Size of family households: 591 2-persons, 193 3-persons, 187 4-persons, 178 5-persons, 86 6-persons, 11 7-or-more-persons
Size of nonfamily households: 350 1-person, 134 2-persons
1,069 married couples with children.
244 single-parent households (31 men, 213 women).
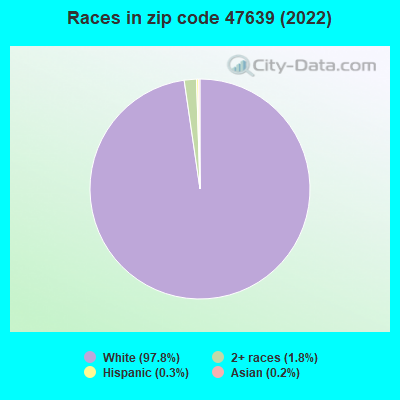
98.1% of residents of 47639 zip code speak English at home.
0.3% of residents speak Spanish at home (71% very well, 29% not well).
0.5% of residents speak other Indo-European language at home (100% very well).
0.2% of residents speak Asian or Pacific Island language at home (100% very well).
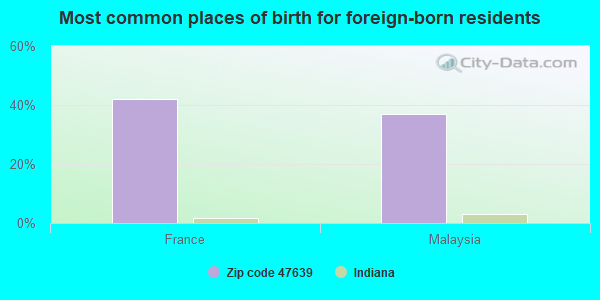
Foreign born population: 19 (0.4%) (45.7% of them are naturalized citizens)
This zip code:
0.4%
Whole state:
6.1%
42%France
37%Malaysia
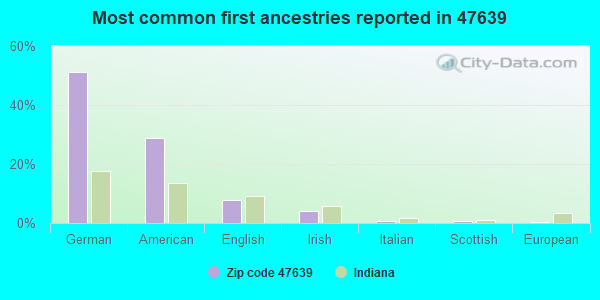
51%German
29%American
8%English
4%Irish
1%Italian
1%Scottish
0%European
Year of entry for the foreign-born population
02010 or later
02000 to 2009
91990 to 1999
7Before 1990
Facilities with environmental interests located in this zip code:
DEWIG BROTHERS PACKING CO (100 E MAPLE ST in HAUBSTADT, IN)
(Integrated Compliance Information System) - ICIS-05-1997-0222, FORMAL ENFORCEMENT ACTION STATE MASTER (Indiana facility tracking) - CRTK-21562, EPCRA Business SIC classification: MEAT PACKING PLANTS
R & C FARM SUPPLIES INCORPORATED (HIGHWAY 68 EAST in HAUBSTADT, IN)
ENFORCEMENT/COMPLIANCE ACTIVITY (Integrated Compliance Information System) STATE MASTER (Indiana facility tracking) - CRTK-9168, EPCRA, UST-12693, UNDERGROUND STORAGE TANK PROGRAM TRANSPORTER (Resource Conservation and Recovery Act (tracking hazardous waste)) Organizations: R&C FARM SUPPLIES INC (CONTACT/OWNER)
CONRADY OIL INC (ADDRESS UNREPORTED in HAUBSTADT, IN)
(Integrated Compliance Information System) - ICIS-05-1987-0392, FORMAL ENFORCEMENT ACTION STATE MASTER (Indiana facility tracking)
C P S FARM CTR HAUBSTADT (CO RD 1200 SW N HWY 41 AND 164 in HAUBSTADT, IN)
STATE MASTER (Indiana facility tracking) (Resource Conservation and Recovery Act (tracking hazardous waste)) Organizations: CROP PRODUCTION SERRVICES INC (CONTACT/OWNER)
STATE MASTER (Indiana facility tracking) TRANSPORTER (Resource Conservation and Recovery Act (tracking hazardous waste)) Organizations: NAAS & SONS INC (CONTACT/OWNER)
SAINT JAMES CATHOLIC 82 (RR 1 BOX 278B in HAUBSTADT, IN)
STATE MASTER (Indiana facility tracking) COMPLIANCE ACTIVITY (Tracking inspections of insecticide, fungicide, and rodenticide, and toxic substances)
Housing units lacking complete plumbing facilities: 2.2% Housing units lacking complete kitchen facilities: 3.7%
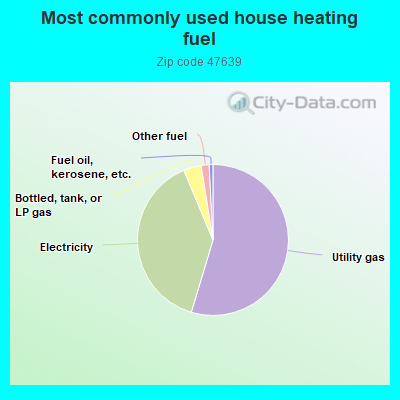
54.6%Utility gas
39.0%Electricity
3.8%Bottled, tank, or LP gas
1.7%Other fuel
0.8%Fuel oil, kerosene, etc.
Population in 1990: 3,568.
Place of birth for U.S.-born residents:
This state: 4,036
Northeast: 8
Midwest: 287
South: 202
West: 32
69% of the 47639 zip code residents lived in the same house 5 years ago. Out of people who lived in different houses, 52% lived in this county. Out of people who lived in different counties, 50% lived in Indiana.
95% of the 47639 zip code residents lived in the same house 1 year ago. Out of people who lived in different houses, 34% moved from this county. Out of people who lived in different houses, 69% moved from different county within same state. Out of people who lived in different houses, 6% moved from different state.
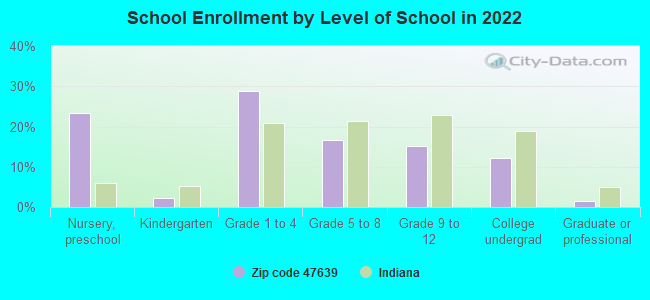
Private vs. public school enrollment:
Students in private schools in grades 1 to 8 (elementary and middle school): 185
Here:
33.3%
Indiana:
14.9%
Students in private schools in grades 9 to 12 (high school): 5
Here:
3.2%
Indiana:
11.4%
Students in private undergraduate colleges: 7
Here:
5.2%
Indiana:
22.3%
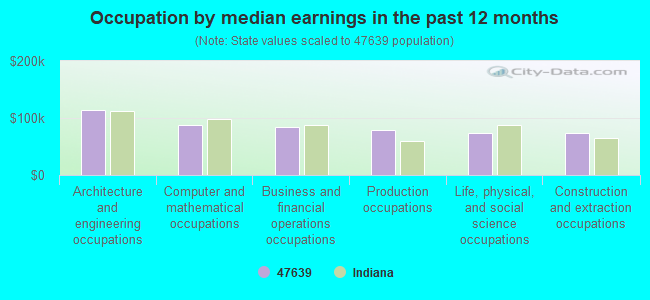
Occupation by median earnings in the past 12 months ($)
113,588Architecture and engineering occupations
87,608Computer and mathematical occupations
84,891Business and financial operations occupations
79,372Production occupations
73,700Life, physical, and social science occupations
72,970Construction and extraction occupations
Companies with federal contracts located in this zip code:
NAAS AND SONS, INC (RR 1 BOX 73 in HAUBSTADT, IN) : $25,440 in 2 contractsin 2005
$12,720 with U.S. Army Corps of Engineers - civil program financing only for Construction of Structures and Facilities -- Highways, Roads, Streets, Bridges, and Railways (includes resurfacing). Signed on 2005-04-15. Completion date: 2005-03-29.
$12,720 with Army for Construction of Structures and Facilities -- Highways, Roads, Streets, Bridges, and Railways (includes resurfacing). Signed on 2005-04-15. Completion date: 2005-03-29.
Top industries in this zip code by the number of employees in 2005:
Detailed PMIC statistics for the following Tracts:0106.00
, 0502.00
2002 - 2018 National Fire Incident Reporting System (NFIRS) incidents
Based on the data from the years 2002 - 2018 the average number of fires per year is 16. The highest number of fire incidents - 36 took place in 2002, and the least - 0 in 2013. The data has a decreasing trend.
When looking into fire subcategories, the most reports belonged to: Outside Fires (39.2%), and Mobile Property/Vehicle Fires (26.5%).
Fire incident types reported to NFIRS in Zip Code 47639


+$3,224
-$2,212
(% of AGI for various income ranges: -1.9% for AGIs below $10k, 1.4% for AGIs $25k-50k, -0.2% for AGIs $50k-75k, 0.0% for AGIs $75k-100k, 0.7% for AGIs over 100k) Nearest zip codes: 47648, 47725, 47612, 47720, 47710, 47613.
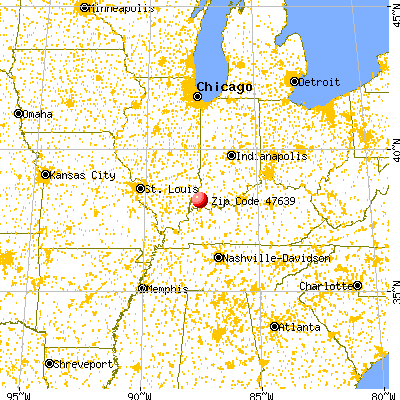


 Based on the data from the years 2002 - 2018 the average number of fires per year is 16. The highest number of fire incidents - 36 took place in 2002, and the least - 0 in 2013. The data has a decreasing trend.
 When looking into fire subcategories, the most reports belonged to: Outside Fires (39.2%), and Mobile Property/Vehicle Fires (26.5%).