Estimated zip code population in 2022: 2,422 Zip code population in 2010: 1,949 Zip code population in 2000: 2,072
Houses and condos: 934 Renter-occupied apartments: 168
% of renters here:
19%
State:
29%
March 2022 cost of living index in zip code 47963: 84.8 (less than average, U.S. average is 100)
Land area: 103.5 sq. mi. Water area: 1.4 sq. mi.
Population density: 23 people per square mile
(very low).
OSM Map
General Map
Google Map
MSN Map
OSM Map
General Map
Google Map
MSN Map
OSM Map
General Map
Google Map
MSN Map
OSM Map
General Map
Google Map
MSN Map
Please wait while loading the map...
Real estate property taxes paid for housing units in 2022:
This zip code:
0.9% ($1,500)
Indiana:
0.7% ($1,467)
Median real estate property taxes paid for housing units with mortgages in 2022: $1,787 (1.0%) Median real estate property taxes paid for housing units with no mortgage in 2022: $1,378 (1.0%)
Business Search- 14 Million verified businesses
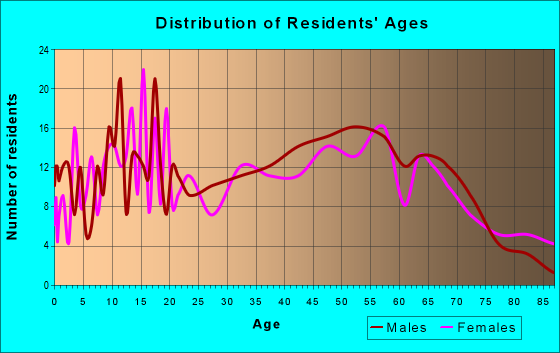
Males: 1,221
(50.4%)
Females: 1,200
(49.6%)
For population 25 years and over in 47963:
High school or higher: 90.2%
Bachelor's degree or higher: 12.4%
Graduate or professional degree: 3.6%
Unemployed: 4.2%
Mean travel time to work (commute): 27.0 minutes
For population 15 years and over in 47963:
Never married: 25.1%
Now married: 51.3%
Separated: 2.0%
Widowed: 8.0%
Divorced: 13.6%
Zip code 47963 compared to state average:
Black race population percentage significantly below state average.
Hispanic race population percentage below state average.
Foreign-born population percentage below state average.
Renting percentage below state average.
House age above state average.
Number of college students below state average.
Percentage of population with a bachelor's degree or higher significantly below state average.
Estimated median house/condo value in 2022: $160,731
47963:
$160,731
Indiana:
$208,700
According to our research of Indiana and other state lists, there was 1 registered sex offender living in 47963 zip code as of May 24, 2024. The ratio of all residents to sex offenders in zip code 47963 is 1,824 to 1. The ratio of registered sex offenders to all residents in this zip code is much lower than the state average.
Median resident age:
This zip code:
38.8 years
Indiana median age:
38.2 years
Average household size:
This zip code:
2.7 people
Indiana:
2.4 people
Averages for the 2020 tax year for zip code 47963, filed in 2021:
Average Adjusted Gross Income (AGI) in 2020: $49,283 (Individual Income Tax Returns)
Here:
$49,283
State:
$64,978
Salary/wage: $41,345 (reported on 79.8% of returns)
Here:
$41,345
State:
$55,245
(% of AGI for various income ranges: 1077.0% for AGIs below $25k, 3607.1% for AGIs $25k-50k, 6343.0% for AGIs $50k-75k, 10330.0% for AGIs $75k-100k, 14710.0% for AGIs $100k-200k)
Taxable interest for individuals: $935 (reported on 24.5% of returns)
This zip code:
$935
Indiana:
$1,351
(% of AGI for various income ranges: 11.7% for AGIs below $25k, 30.6% for AGIs $25k-50k, 25.0% for AGIs $50k-75k, 47.1% for AGIs $75k-100k, 130.0% for AGIs $100k-200k)
Ordinary dividends: $1,609 (reported on 11.7% of returns)
Here:
$1,609
State:
$5,827
(% of AGI for various income ranges: 12.6% for AGIs below $25k, 32.9% for AGIs $25k-50k, 5.7% for AGIs $75k-100k, 146.7% for AGIs $100k-200k)
Net capital gain/loss in AGI: +$9,822 (reported on 9.6% of returns)
Here:
+$9,822
State:
+$17,730
(% of AGI for various income ranges: 20.4% for AGIs below $25k, 88.0% for AGIs $50k-75k, 1248.3% for AGIs $100k-200k)
Profit/loss from business: +$9,733 (reported on 9.6% of returns)
Here:
+$9,733
State:
+$12,144
(% of AGI for various income ranges: 107.8% for AGIs below $25k, 61.2% for AGIs $25k-50k, 90.0% for AGIs $50k-75k, 620.0% for AGIs $75k-100k)
Taxable individual retirement arrangement distribution: $9,338 (reported on 8.5% of returns)
47963:
$9,338
Indiana:
$18,302
(% of AGI for various income ranges: 55.2% for AGIs below $25k, 134.7% for AGIs $25k-50k, 558.6% for AGIs $75k-100k)
Earned income credit: $2,557 (reported on 14.9% of returns)
Here:
$2,557
State:
$2,298
(% of AGI for various income ranges: 112.2% for AGIs below $25k, 58.8% for AGIs $25k-50k)
Percentage of individuals using paid preparers for their 2020 taxes: 92.6%
Here:
93%
State:
94%
(% for various income ranges: 91.4% for AGIs below $25k, 95.7% for AGIs $25k-50k, 92.9% for AGIs $50k-75k, 90.9% for AGIs $75k-100k, 90.9% for AGIs $100k-200k)
Averages for the 2012 tax year for zip code 47963, filed in 2013:
Average Adjusted Gross Income (AGI) in 2012: $43,392 (Individual Income Tax Returns)
Here:
$43,392
State:
$52,932
Salary/wage: $35,872 (reported on 82.1% of returns)
Here:
$35,872
State:
$45,173
(% of AGI for various income ranges: 69.0% for AGIs below $25k, 76.9% for AGIs $25k-50k, 73.4% for AGIs $50k-75k, 75.1% for AGIs $75k-100k, 50.7% for AGIs $100k-200k)
Taxable interest for individuals: $855 (reported on 30.5% of returns)
This zip code:
$855
Indiana:
$1,311
(% of AGI for various income ranges: 1.2% for AGIs below $25k, 0.5% for AGIs $25k-50k, 0.5% for AGIs $50k-75k, 0.3% for AGIs $75k-100k, 0.7% for AGIs $100k-200k)
Ordinary dividends: $1,871 (reported on 14.7% of returns)
Here:
$1,871
State:
$4,690
(% of AGI for various income ranges: 0.2% for AGIs below $25k, 0.2% for AGIs $25k-50k, 0.8% for AGIs $50k-75k, 1.5% for AGIs $100k-200k)
Net capital gain/loss in AGI: +$414 (reported on 7.4% of returns)
Here:
+$414
State:
+$10,406
Profit/loss from business: +$7,725 (reported on 12.6% of returns)
Here:
+$7,725
State:
+$11,105
(% of AGI for various income ranges: 9.4% for AGIs below $25k, 1.8% for AGIs $50k-75k, 4.6% for AGIs $75k-100k)
Taxable individual retirement arrangement distribution: $6,267 (reported on 9.5% of returns)
47963:
$6,267
Indiana:
$13,841
Total itemized deductions: $17,421 (22% of AGI, reported on 20.0% of returns)
Here:
$17,421
State:
$20,913
Here:
22.1% of AGI
State:
18.2% of AGI
(% of AGI for various income ranges: 6.8% for AGIs below $25k, 4.7% for AGIs $25k-50k, 9.6% for AGIs $50k-75k, 8.1% for AGIs $75k-100k, 9.6% for AGIs $100k-200k)
Charity contributions: $1,946 (reported on 13.7% of returns)
Here:
$1,946
State:
$4,697
(% of AGI for various income ranges: 0.6% for AGIs below $25k, 1.0% for AGIs $50k-75k, 1.1% for AGIs $100k-200k)
Taxes paid: $5,337 (reported on 20.0% of returns)
47963:
$5,337
State:
$7,456
(% of AGI for various income ranges: 1.8% for AGIs $25k-50k, 2.3% for AGIs $50k-75k, 2.3% for AGIs $75k-100k, 4.2% for AGIs $100k-200k)
Earned income credit: $2,306 (reported on 17.9% of returns)
Here:
$2,306
State:
$2,265
(% of AGI for various income ranges: 6.6% for AGIs below $25k, 1.1% for AGIs $25k-50k)
Percentage of individuals using paid preparers for their 2012 taxes: 57.9%
Here:
58%
State:
53%
(% for various income ranges: 51.3% for AGIs below $25k, 60.9% for AGIs $25k-50k, 58.8% for AGIs $50k-75k, 62.5% for AGIs $75k-100k, 75.0% for AGIs $100k-200k)
Averages for the 2004 tax year for zip code 47963, filed in 2005:
Average Adjusted Gross Income (AGI) in 2004: $34,988 (Individual Income Tax Returns)
Here:
$34,988
State:
$44,790
Salary/wage: $31,542 (reported on 85.0% of returns)
Here:
$31,542
State:
$39,615
(% of AGI for various income ranges: 84.5% for AGIs below $10k, 69.7% for AGIs $10k-25k, 83.7% for AGIs $25k-50k, 80.6% for AGIs $50k-75k, 76.3% for AGIs $75k-100k, 48.9% for AGIs over 100k)
Taxable interest for individuals: $1,193 (reported on 42.1% of returns)
This zip code:
$1,193
Indiana:
$1,535
(% of AGI for various income ranges: 5.7% for AGIs below $10k, 3.1% for AGIs $10k-25k, 1.3% for AGIs $25k-50k, 0.9% for AGIs $50k-75k, 1.1% for AGIs $75k-100k, 0.8% for AGIs over 100k)
Taxable dividends: $872 (reported on 15.5% of returns)
Here:
$872
State:
$2,998
(% of AGI for various income ranges: 0.5% for AGIs below $10k, 1.6% for AGIs $10k-25k, 0.4% for AGIs $25k-50k, 0.1% for AGIs $50k-75k, 0.3% for AGIs $75k-100k)
Net capital gain/loss: +$1,648 (reported on 10.0% of returns)
Here:
+$1,648
State:
+$8,619
(% of AGI for various income ranges: 0.1% for AGIs $10k-25k, -0.0% for AGIs $25k-50k, 0.7% for AGIs $50k-75k, 1.6% for AGIs $75k-100k)
Profit/loss from business: +$1,851 (reported on 12.5% of returns)
Here:
+$1,851
State:
+$10,071
(% of AGI for various income ranges: 5.8% for AGIs below $10k, 5.0% for AGIs $10k-25k, -0.8% for AGIs $25k-50k, 0.4% for AGIs $50k-75k)
Profit/loss from farming: +$7,569 (reported on 5.6% of returns)
Here:
+$7,569
State:
-$2,212
IRA payment deduction: $2,800 (reported on 2.2% of returns)
47963:
$2,800
Indiana:
$2,840
Total itemized deductions: $13,719 (24% of AGI, reported on 21.5% of returns)
Here:
$13,719
State:
$17,065
Here:
23.9% of AGI
State:
19.5% of AGI
(% of AGI for various income ranges: 8.0% for AGIs $10k-25k, 6.9% for AGIs $25k-50k, 9.0% for AGIs $50k-75k, 12.4% for AGIs $75k-100k, 7.6% for AGIs over 100k)
Charity contributions deductions: $2,110 (3% of AGI, reported on 15.9% of returns)
Here:
$2,110
State:
$3,550
Here:
3.5% of AGI
State:
3.8% of AGI
(% of AGI for various income ranges: 0.6% for AGIs $10k-25k, 0.7% for AGIs $25k-50k, 1.2% for AGIs $50k-75k, 0.9% for AGIs $75k-100k, 1.8% for AGIs over 100k)
Total tax: $3,980 (reported on 75.9% of returns)
47963:
$3,980
State:
$6,914
(% of AGI for various income ranges: 2.1% for AGIs below $10k, 4.7% for AGIs $10k-25k, 6.6% for AGIs $25k-50k, 8.8% for AGIs $50k-75k, 10.9% for AGIs $75k-100k, 17.6% for AGIs over 100k)
Earned income credit: $1,492 (reported on 14.3% of returns)
Here:
$1,492
State:
$1,685
Percentage of individuals using paid preparers for their 2004 taxes: 68.3%
Here:
68%
State:
59%
(% for various income ranges: 60.2% for AGIs below $10k, 64.6% for AGIs $10k-25k, 71.9% for AGIs $25k-50k, 73.5% for AGIs $50k-75k, 72.4% for AGIs $75k-100k, 81.8% for AGIs over 100k)
Household received Food Stamps/SNAP in the past 12 months: 96 Household did not receive Food Stamps/SNAP in the past 12 months: 808
Women who had a birth in the past 12 months: 34 (32 now married, 4 unmarried) Women who did not have a birth in the past 12 months: 463 (225 now married, 238 unmarried)
Housing units in zip code 47963 with a mortgage: 361 (5 second mortgage, 2 both second mortgage and home equity loan) Houses without a mortgage: 3
Median monthly owner costs for units with a mortgage: $1,301 Median monthly owner costs for units without a mortgage: $514
Residents with income below the poverty level in 2022:
This zip code:
4.5%
Whole state:
12.6%
Residents with income below 50% of the poverty level in 2022:
This zip code:
2.2%
Whole state:
6.3%
Median number of rooms in houses and condos:
Here:
6.8
State:
6.6
Median number of rooms in apartments:
Here:
5.2
State:
4.3
Notable locations in this zip code not listed on our city pages
Size of family households: 344 2-persons, 57 3-persons, 90 4-persons, 112 5-persons, 6 6-persons, 71 7-or-more-persons
Size of nonfamily households: 211 1-person, 6 2-persons, 4 4-persons
443 married couples with children.
154 single-parent households (58 men, 96 women).
91.6% of residents of 47963 zip code speak English at home.
0.5% of residents speak Spanish at home (100% very well).
8.4% of residents speak other Indo-European language at home (100% very well).
Foreign born population: 64 (2.7%) (100.0% of them are naturalized citizens)
This zip code:
2.7%
Whole state:
6.1%
81%Poland
6%Germany
5%Greece
23%Romanian
21%Irish
10%German
8%American
5%English
4%Polish
3%Canadian
Year of entry for the foreign-born population
632010 or later
02000 to 2009
01990 to 1999
5Before 1990
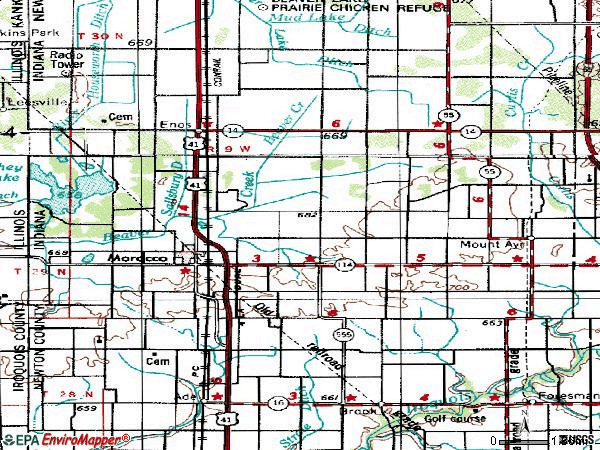
Facilities with environmental interests located in this zip code:
NORTH NEWTON BUS BARN (1641 W 250 N in MOROCCO, IN)
STATE MASTER (Indiana facility tracking) - UST-6339, UNDERGROUND STORAGE TANK PROGRAM (National Center for Education Statistics) - STATE ID-6411 National Pollutant Discharge Elimination System NON-MAJOR (Tracking pollutant discharge elimination systems) - permit Business SIC classification: ELEMENTARY AND SECONDARY SCHOOLS Organizations: MILORAD MILATOVIC 5482 090102 (CONTACT/OPERATOR)
, NORTH NEWTON SCHOOL CORP (CONTACT/OWNER)
Alternative names: NORTH NEWTON JR-SR HIGH SCHOOL
DAWSON FARM CENTER INC (5202 S OLD US 41 in MOROCCO, IN)
ENFORCEMENT/COMPLIANCE ACTIVITY (Integrated Compliance Information System) STATE MASTER (Indiana facility tracking) - CRTK-3099, EPCRA COMPLIANCE ACTIVITY (Tracking inspections of insecticide, fungicide, and rodenticide, and toxic substances)
MOROCCO ELEMENTARY SCHOOL (310 S LINCOLN - PO BOX 50 in MOROCCO, IN)
(Geographic Names Information System) (National Center for Education Statistics) - STATE ID-6397 Organizations: NORTH NEWTON SCHOOL CORP (SCHOOL DISTRICT)
AMOCO FERTILIZER PLT (SO ON OLD 41 APPROX 2 MIL in MOROCCO, IN)
STATE MASTER (Indiana facility tracking) (Resource Conservation and Recovery Act (tracking hazardous waste))
NEWTON AG SERVICE ENOS ELEVATOR (RURAL ROUTE 1 in MOROCCO, IN)
AIR MINOR (AIRS/AFS) STATE MASTER (Indiana facility tracking) Business SIC classification: GRAIN AND FIELD BEANS
NORTH NEWTON SC (30 E. STATE ST PO BOX 8 in MOROCCO, IN)
STATE MASTER (Indiana facility tracking) COMPLIANCE ACTIVITY (Tracking inspections of insecticide, fungicide, and rodenticide, and toxic substances)
Housing units lacking complete plumbing facilities: 0.9% Housing units lacking complete kitchen facilities: 1.3%
50.4%Utility gas
31.5%Bottled, tank, or LP gas
9.4%Wood
6.9%Electricity
1.5%Fuel oil, kerosene, etc.
Population in 1990: 2,461.
Place of birth for U.S.-born residents:
This state: 1,581
Northeast: 13
Midwest: 453
South: 170
West: 139
65% of the 47963 zip code residents lived in the same house 5 years ago. Out of people who lived in different houses, 45% lived in this county. Out of people who lived in different counties, 50% lived in Indiana.
82% of the 47963 zip code residents lived in the same house 1 year ago. Out of people who lived in different houses, 77% moved from this county. Out of people who lived in different houses, 17% moved from different county within same state.
Private vs. public school enrollment:
Students in private schools in grades 1 to 8 (elementary and middle school): 21
Here:
7.3%
Indiana:
14.9%
Students in private schools in grades 9 to 12 (high school): 28
Here:
11.9%
Indiana:
11.4%
Students in private undergraduate colleges:
Here:
0.0%
Indiana:
22.3%
Occupation by median earnings in the past 12 months ($)
72,717Health technologists and technicians
69,551Business and financial operations occupations
68,492Arts, design, entertainment, sports, and media occupations
59,026Personal care and service occupations
51,372Construction and extraction occupations
50,047Production occupations
Top industries in this zip code by the number of employees in 2005:
Health Care and Social Assistance: Other Individual and Family Services (20-49 employees: 1 establishment)
Accommodation and Food Services: Full-Service Restaurants (10-19: 1, 1-4: 1)
Finance and Insurance: Commercial Banking (10-19: 1)
2002 - 2018 National Fire Incident Reporting System (NFIRS) incidents
According to the data from the years 2002 - 2018 the average number of fires per year is 20. The highest number of fires - 36 took place in 2012, and the least - 7 in 2014. The data has a dropping trend.
When looking into fire subcategories, the most reports belonged to: Outside Fires (46.2%), and Structure Fires (31.6%).
Fire incident types reported to NFIRS in Zip Code 47963


+$7,569
-$2,212
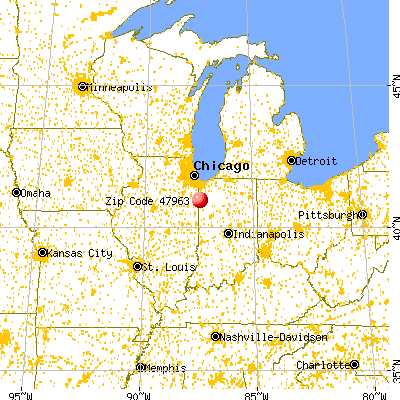
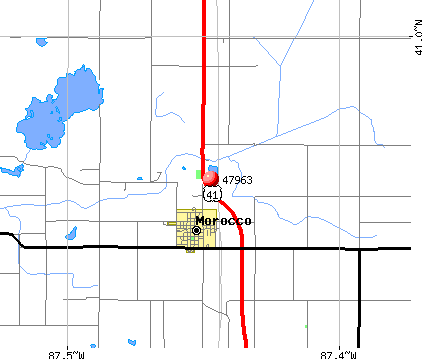 Nearest zip codes: 46349, 47922, 47964, 60912, 47943, 60958.


 According to the data from the years 2002 - 2018 the average number of fires per year is 20. The highest number of fires - 36 took place in 2012, and the least - 7 in 2014. The data has a dropping trend.
 When looking into fire subcategories, the most reports belonged to: Outside Fires (46.2%), and Structure Fires (31.6%).