Estimated zip code population in 2022: 2,886 Zip code population in 2010: 3,336 Zip code population in 2000: 3,367
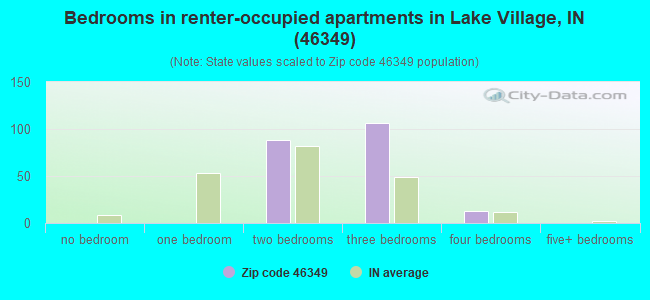
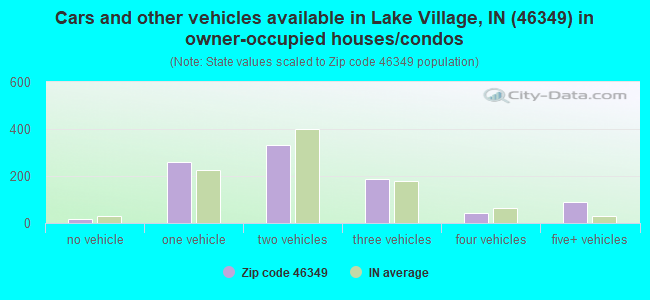
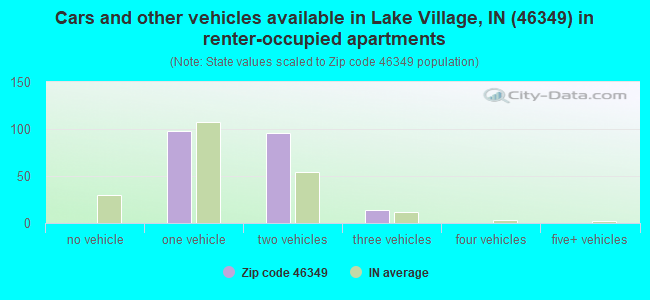
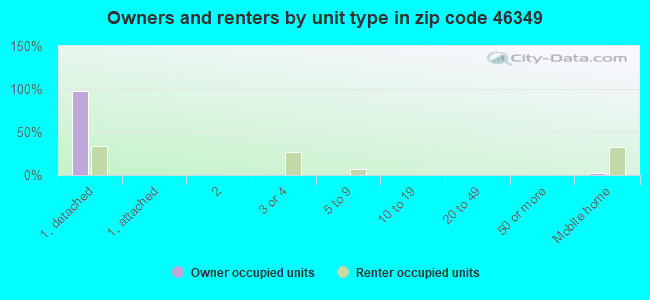
Houses and condos: 1,300 Renter-occupied apartments: 208
% of renters here:
18%
State:
29%
March 2022 cost of living index in zip code 46349: 86.0 (less than average, U.S. average is 100)
Land area: 84.1 sq. mi. Water area: 0.0 sq. mi.
Population density: 34 people per square mile
(very low).
OSM Map
General Map
Google Map
MSN Map
OSM Map
General Map
Google Map
MSN Map
OSM Map
General Map
Google Map
MSN Map
OSM Map
General Map
Google Map
MSN Map
Please wait while loading the map...
Real estate property taxes paid for housing units in 2022:
This zip code:
0.8% ($1,703)
Indiana:
0.7% ($1,467)
Median real estate property taxes paid for housing units with mortgages in 2022: $1,613 (0.8%) Median real estate property taxes paid for housing units with no mortgage in 2022: $1,926 (0.7%)
Estimated median house/condo value in 2022: $217,566
46349:
$217,566
Indiana:
$208,700
According to our research of Indiana and other state lists, there were 2 registered sex offenders living in 46349 zip code as of June 16, 2024. The ratio of all residents to sex offenders in zip code 46349 is 1,524 to 1. The ratio of registered sex offenders to all residents in this zip code is much lower than the state average.
Median resident age:
This zip code:
37.8 years
Indiana median age:
38.2 years
Average household size:
This zip code:
2.5 people
Indiana:
2.4 people
Averages for the 2020 tax year for zip code 46349, filed in 2021:
Average Adjusted Gross Income (AGI) in 2020: $60,141 (Individual Income Tax Returns)
Here:
$60,141
State:
$64,978
Salary/wage: $56,293 (reported on 81.7% of returns)
Here:
$56,293
State:
$55,245
(% of AGI for various income ranges: 1058.7% for AGIs below $25k, 3563.6% for AGIs $25k-50k, 5842.0% for AGIs $50k-75k, 8892.5% for AGIs $75k-100k, 14390.9% for AGIs $100k-200k)
Taxable interest for individuals: $451 (reported on 26.6% of returns)
This zip code:
$451
Indiana:
$1,351
(% of AGI for various income ranges: 9.5% for AGIs below $25k, 12.5% for AGIs $25k-50k, 29.5% for AGIs $50k-75k, 11.9% for AGIs $75k-100k, 24.5% for AGIs $100k-200k)
Ordinary dividends: $1,810 (reported on 12.4% of returns)
Here:
$1,810
State:
$5,827
(% of AGI for various income ranges: 20.5% for AGIs below $25k, 17.1% for AGIs $25k-50k, 53.0% for AGIs $50k-75k, 10.0% for AGIs $75k-100k, 60.0% for AGIs $100k-200k)
Net capital gain/loss in AGI: +$7,011 (reported on 10.7% of returns)
Here:
+$7,011
State:
+$17,730
(% of AGI for various income ranges: 11.6% for AGIs below $25k, 8.2% for AGIs $25k-50k, 36.5% for AGIs $50k-75k, 70.6% for AGIs $75k-100k, 458.6% for AGIs $100k-200k)
Profit/loss from business: +$7,153 (reported on 11.2% of returns)
Here:
+$7,153
State:
+$12,144
(% of AGI for various income ranges: 107.6% for AGIs below $25k, 55.4% for AGIs $25k-50k, 69.5% for AGIs $50k-75k, 86.9% for AGIs $75k-100k, 235.0% for AGIs $100k-200k)
Taxable individual retirement arrangement distribution: $11,908 (reported on 7.7% of returns)
46349:
$11,908
Indiana:
$18,302
(% of AGI for various income ranges: 59.5% for AGIs below $25k, 59.3% for AGIs $25k-50k, 289.0% for AGIs $50k-75k, 262.7% for AGIs $100k-200k)
Total itemized deductions: $23,050 (reported on 3.6% of returns)
Here:
$23,050
State:
$35,601
(% of AGI for various income ranges: 178.2% for AGIs $25k-50k, 401.8% for AGIs $100k-200k)
Charity contributions: $2,000 (reported on 1.8% of returns)
Here:
$2,000
State:
$15,596
(% of AGI for various income ranges: 27.3% for AGIs $100k-200k)
Taxes paid: $8,367 (reported on 3.6% of returns)
46349:
$8,367
State:
$7,542
(% of AGI for various income ranges: 53.9% for AGIs $25k-50k, 159.5% for AGIs $100k-200k)
Earned income credit: $2,132 (reported on 13.0% of returns)
Here:
$2,132
State:
$2,298
(% of AGI for various income ranges: 77.6% for AGIs below $25k, 62.1% for AGIs $25k-50k)
Percentage of individuals using paid preparers for their 2020 taxes: 90.5%
Here:
91%
State:
94%
(% for various income ranges: 90.7% for AGIs below $25k, 91.7% for AGIs $25k-50k, 88.5% for AGIs $50k-75k, 90.0% for AGIs $75k-100k, 90.0% for AGIs $100k-200k, 100.0% for AGIs over 200k)
Averages for the 2012 tax year for zip code 46349, filed in 2013:
Average Adjusted Gross Income (AGI) in 2012: $49,947 (Individual Income Tax Returns)
Here:
$49,947
State:
$52,932
Salary/wage: $46,787 (reported on 84.2% of returns)
Here:
$46,787
State:
$45,173
(% of AGI for various income ranges: 67.1% for AGIs below $25k, 75.6% for AGIs $25k-50k, 77.6% for AGIs $50k-75k, 88.5% for AGIs $75k-100k, 78.6% for AGIs $100k-200k)
Taxable interest for individuals: $698 (reported on 28.3% of returns)
This zip code:
$698
Indiana:
$1,311
(% of AGI for various income ranges: 1.4% for AGIs below $25k, 0.4% for AGIs $25k-50k, 0.5% for AGIs $50k-75k, 0.2% for AGIs $75k-100k, 0.2% for AGIs $100k-200k)
Ordinary dividends: $1,341 (reported on 11.2% of returns)
Here:
$1,341
State:
$4,690
(% of AGI for various income ranges: 0.4% for AGIs below $25k, 0.7% for AGIs $25k-50k, 0.5% for AGIs $50k-75k, 0.1% for AGIs $75k-100k)
Net capital gain/loss in AGI: +$210 (reported on 6.6% of returns)
Here:
+$210
State:
+$10,406
(% of AGI for various income ranges: 0.2% for AGIs $25k-50k)
Profit/loss from business: +$5,312 (reported on 10.5% of returns)
Here:
+$5,312
State:
+$11,105
(% of AGI for various income ranges: 1.6% for AGIs below $25k, 2.6% for AGIs $25k-50k, 1.7% for AGIs $50k-75k, 0.3% for AGIs $75k-100k, 0.5% for AGIs $100k-200k)
Taxable individual retirement arrangement distribution: $11,027 (reported on 7.2% of returns)
46349:
$11,027
Indiana:
$13,841
(% of AGI for various income ranges: 2.1% for AGIs below $25k, 1.9% for AGIs $25k-50k, 2.5% for AGIs $50k-75k, 3.2% for AGIs $75k-100k)
Total itemized deductions: $17,305 (20% of AGI, reported on 28.3% of returns)
Here:
$17,305
State:
$20,913
Here:
19.7% of AGI
State:
18.2% of AGI
(% of AGI for various income ranges: 5.2% for AGIs below $25k, 6.7% for AGIs $25k-50k, 11.0% for AGIs $50k-75k, 10.3% for AGIs $75k-100k, 11.4% for AGIs $100k-200k)
Charity contributions: $2,136 (reported on 18.4% of returns)
Here:
$2,136
State:
$4,697
(% of AGI for various income ranges: 0.5% for AGIs $25k-50k, 1.0% for AGIs $50k-75k, 1.0% for AGIs $75k-100k, 0.9% for AGIs $100k-200k)
Taxes paid: $6,344 (reported on 28.3% of returns)
46349:
$6,344
State:
$7,456
(% of AGI for various income ranges: 1.1% for AGIs below $25k, 1.9% for AGIs $25k-50k, 3.3% for AGIs $50k-75k, 3.6% for AGIs $75k-100k, 5.1% for AGIs $100k-200k)
Earned income credit: $2,171 (reported on 13.8% of returns)
Here:
$2,171
State:
$2,265
(% of AGI for various income ranges: 5.1% for AGIs below $25k, 1.0% for AGIs $25k-50k)
Percentage of individuals using paid preparers for their 2012 taxes: 59.2%
Here:
59%
State:
53%
(% for various income ranges: 50.9% for AGIs below $25k, 61.8% for AGIs $25k-50k, 60.9% for AGIs $50k-75k, 66.7% for AGIs $75k-100k, 70.0% for AGIs $100k-200k)
Averages for the 2004 tax year for zip code 46349, filed in 2005:
Average Adjusted Gross Income (AGI) in 2004: $40,371 (Individual Income Tax Returns)
Here:
$40,371
State:
$44,790
Salary/wage: $38,856 (reported on 86.8% of returns)
Here:
$38,856
State:
$39,615
(% of AGI for various income ranges: 109.4% for AGIs below $10k, 73.3% for AGIs $10k-25k, 79.6% for AGIs $25k-50k, 87.1% for AGIs $50k-75k, 91.4% for AGIs $75k-100k, 75.6% for AGIs over 100k)
Taxable interest for individuals: $688 (reported on 42.5% of returns)
This zip code:
$688
Indiana:
$1,535
(% of AGI for various income ranges: 5.9% for AGIs below $10k, 1.7% for AGIs $10k-25k, 0.6% for AGIs $25k-50k, 0.6% for AGIs $50k-75k, 0.2% for AGIs $75k-100k, 0.6% for AGIs over 100k)
Taxable dividends: $775 (reported on 12.2% of returns)
Here:
$775
State:
$2,998
(% of AGI for various income ranges: 1.2% for AGIs below $10k, 0.2% for AGIs $10k-25k, 0.2% for AGIs $25k-50k, 0.2% for AGIs $50k-75k, 0.0% for AGIs $75k-100k, 0.4% for AGIs over 100k)
Net capital gain/loss: +$2,899 (reported on 8.8% of returns)
Here:
+$2,899
State:
+$8,619
(% of AGI for various income ranges: -1.2% for AGIs below $10k, 0.2% for AGIs $10k-25k, 0.7% for AGIs $25k-50k, 0.9% for AGIs $50k-75k, -0.1% for AGIs $75k-100k, 1.5% for AGIs over 100k)
Profit/loss from business: +$6,244 (reported on 13.2% of returns)
Here:
+$6,244
State:
+$10,071
(% of AGI for various income ranges: 1.5% for AGIs below $10k, 6.8% for AGIs $10k-25k, 3.6% for AGIs $25k-50k, 0.6% for AGIs $50k-75k, 0.2% for AGIs $75k-100k, 2.1% for AGIs over 100k)
Profit/loss from farming: +$903 (reported on 2.1% of returns)
Here:
+$903
State:
-$2,212
IRA payment deduction: $2,844 (reported on 2.2% of returns)
46349:
$2,844
Indiana:
$2,840
Total itemized deductions: $14,414 (22% of AGI, reported on 31.9% of returns)
Here:
$14,414
State:
$17,065
Here:
21.8% of AGI
State:
19.5% of AGI
(% of AGI for various income ranges: 11.5% for AGIs $10k-25k, 10.1% for AGIs $25k-50k, 12.2% for AGIs $50k-75k, 11.9% for AGIs $75k-100k, 12.5% for AGIs over 100k)
Charity contributions deductions: $1,687 (2% of AGI, reported on 25.1% of returns)
Here:
$1,687
State:
$3,550
Here:
2.4% of AGI
State:
3.8% of AGI
(% of AGI for various income ranges: 0.7% for AGIs $10k-25k, 1.0% for AGIs $25k-50k, 1.2% for AGIs $50k-75k, 0.9% for AGIs $75k-100k, 1.3% for AGIs over 100k)
Total tax: $4,818 (reported on 76.9% of returns)
46349:
$4,818
State:
$6,914
(% of AGI for various income ranges: 2.0% for AGIs below $10k, 4.3% for AGIs $10k-25k, 6.8% for AGIs $25k-50k, 8.7% for AGIs $50k-75k, 10.0% for AGIs $75k-100k, 15.5% for AGIs over 100k)
Earned income credit: $1,444 (reported on 11.1% of returns)
Here:
$1,444
State:
$1,685
Percentage of individuals using paid preparers for their 2004 taxes: 62.4%
Here:
62%
State:
59%
(% for various income ranges: 49.7% for AGIs below $10k, 59.1% for AGIs $10k-25k, 65.8% for AGIs $25k-50k, 70.1% for AGIs $50k-75k, 65.7% for AGIs $75k-100k, 76.6% for AGIs over 100k)
Household received Food Stamps/SNAP in the past 12 months: 75 Household did not receive Food Stamps/SNAP in the past 12 months: 1,061
Women who had a birth in the past 12 months: 87 (22 now married, 56 unmarried) Women who did not have a birth in the past 12 months: 452 (236 now married, 216 unmarried)
Housing units in zip code 46349 with a mortgage: 643 (20 second mortgage, 15 both second mortgage and home equity loan) Median monthly owner costs for units with a mortgage: $1,205 Median monthly owner costs for units without a mortgage: $502
Residents with income below the poverty level in 2022:
This zip code:
23.2%
Whole state:
12.6%
Residents with income below 50% of the poverty level in 2022:
This zip code:
8.2%
Whole state:
6.3%
Median number of rooms in houses and condos:
Here:
6.3
State:
6.6
Median number of rooms in apartments:
Here:
5.1
State:
4.3
Notable locations in this zip code not listed on our city pages
Churches in zip code 46349 include: House of God Church (A), Village Baptist Church (B), Knight Chapel (C), Saint Augusta Church (D). Display/hide their locations on the map
NEWTON COUNTY, IN PUBLIC LIBRARY -- LAKE VILLAGE (9458 NORTH 315 WEST in LAKE VILLAGE, IN)
(Integrated Compliance Information System) - ICIS-05-2003-4078, FORMAL ENFORCEMENT ACTION
Housing units lacking complete plumbing facilities: 1.9% Housing units lacking complete kitchen facilities: 2.0%
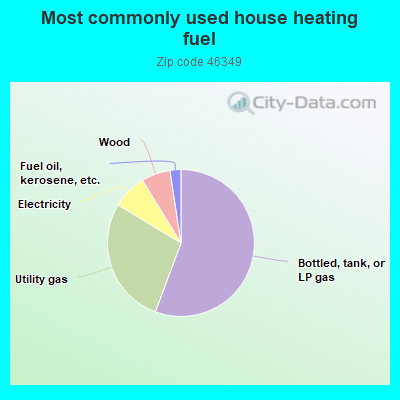
55.9%Bottled, tank, or LP gas
28.1%Utility gas
7.6%Electricity
6.4%Wood
2.4%Fuel oil, kerosene, etc.
Population in 1990: 2,208. Population change in the 1990s: +1,159 (+52.5%).
Place of birth for U.S.-born residents:
This state: 1,731
Northeast: 1
Midwest: 1,083
South: 37
West: 27
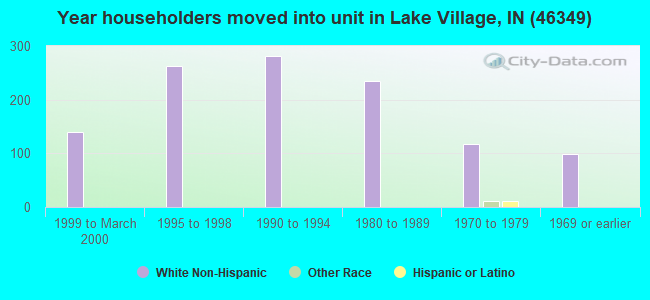
67% of the 46349 zip code residents lived in the same house 5 years ago. Out of people who lived in different houses, 45% lived in this county. Out of people who lived in different counties, 50% lived in Indiana.
93% of the 46349 zip code residents lived in the same house 1 year ago. Out of people who lived in different houses, 20% moved from this county. Out of people who lived in different houses, 55% moved from different county within same state. Out of people who lived in different houses, 30% moved from different state. Out of people who lived in different houses, 1% moved from abroad.
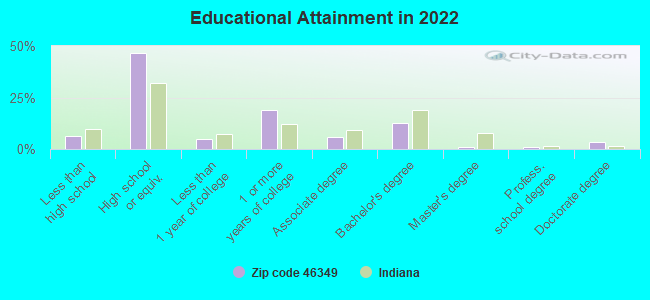
Private vs. public school enrollment:
Students in private schools in grades 1 to 8 (elementary and middle school): 69
Here:
19.7%
Indiana:
14.9%
Students in private schools in grades 9 to 12 (high school): 33
Here:
54.1%
Indiana:
11.4%
Students in private undergraduate colleges: 11
Here:
48.4%
Indiana:
22.3%
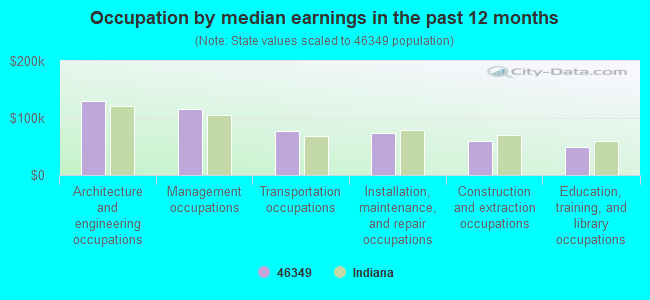
Occupation by median earnings in the past 12 months ($)
129,929Architecture and engineering occupations
116,054Management occupations
77,106Transportation occupations
73,338Installation, maintenance, and repair occupations
59,231Construction and extraction occupations
49,012Education, training, and library occupations
Top industries in this zip code by the number of employees in 2005:
Other Services (except Public Administration): Beauty Salons (5-9: 1, 1-4: 1)
Arts, Entertainment, and Recreation: Fitness and Recreational Sports Centers (5-9: 1)
Fatal accident statistics in 2014:
Fatal accident count: 1
Vehicles involved in fatal accidents: 1
Fatal accidents caused by drunken drivers: 1
Fatalities: 1
Persons involved in fatal accidents: 1
Pedestrians involved in fatal accidents: 0
Fatal accident statistics in 2013:
Fatal accident count: 1
Vehicles involved in fatal accidents: 2
Fatal accidents caused by drunken drivers: 0
Fatalities: 1
Persons involved in fatal accidents: 3
Pedestrians involved in fatal accidents: 0
2002 - 2018 National Fire Incident Reporting System (NFIRS) incidents
According to the data from the years 2002 - 2018 the average number of fire incidents per year is 31. The highest number of fire incidents - 62 took place in 2005, and the least - 4 in 2017. The data has a declining trend.
When looking into fire subcategories, the most incidents belonged to: Outside Fires (56.6%), and Structure Fires (29.2%).
Fire incident types reported to NFIRS in Zip Code 46349


+$903
-$2,212
 Nearest zip codes: 46379, 46376, 46381, 47963, 46377, 47943.


 According to the data from the years 2002 - 2018 the average number of fire incidents per year is 31. The highest number of fire incidents - 62 took place in 2005, and the least - 4 in 2017. The data has a declining trend.
 When looking into fire subcategories, the most incidents belonged to: Outside Fires (56.6%), and Structure Fires (29.2%).