Estimated zip code population in 2022: 25,777
Zip code population in 2010: 25,366
Zip code population in 2000: 30,115
Houses and condos: 11,141
Renter-occupied apartments: 5,099
% of renters here:
55%State:
27%
March 2022 cost of living index in zip code 48141: 94.6
(less than average, U.S. average is 100)
Land area: 6.3
sq. mi.
Water area: 0.0
sq. mi.
Population density: 4,123 people per square mile (average).
OSM Map
General Map
Google Map
MSN Map
OSM Map
General Map
Google Map
MSN Map
OSM Map
General Map
Google Map
MSN Map
OSM Map
General Map
Google Map
MSN Map
Please wait while loading the map...
Real estate property taxes paid for housing units in 2022:
This zip code:
2.3% ($1,765)Michigan:
1.2% ($2,746)
Median real estate property taxes paid for housing units with mortgages in 2022: $1,811 (2.1%)
Median real estate property taxes paid for housing units with no mortgage in 2022: $1,732 (2.4%)
Profiles of local businesses
Business Search - 14 Million verified businesses
Males: 12,546 Females: 13,231
For population 25 years and over in 48141:
High school or higher: 82.9%Bachelor's degree or higher: 12.5%Graduate or professional degree: 3.6%Unemployed: 9.3%Mean travel time to work (commute): 26.4 minutes
For population 15 years and over in 48141:
Never married: 51.3%Now married: 27.7%Separated: 3.5%Widowed: 5.0%Divorced: 12.5%
Zip code 48141 compared to state average:
Median household income below state average. Median house value significantly below state average. Unemployed percentage above state average. Black race population percentage significantly above state average. Hispanic race population percentage below state average. Median age below state average. Foreign-born population percentage below state average. Renting percentage above state average. Length of stay since moving in significantly above state average. Percentage of population with a bachelor's degree or higher significantly below state average. 19,231 74.6% Black 4,047 15.7% White 1,523 5.9% Two or more races 507 2.0% Hispanic or Latino 312 1.2% Asian 138 0.5% Some other race 14 0.05% American Indian
Data:
Median household income ($)
Median household income (% change since 2000)
Household income diversity
Ratio of average income to average house value (%)
Ratio of average income to average rent
Median household income ($) - White
Median household income ($) - Black or African American
Median household income ($) - Asian
Median household income ($) - Hispanic or Latino
Median household income ($) - American Indian and Alaska Native
Median household income ($) - Multirace
Median household income ($) - Other Race
Median household income for houses/condos with a mortgage ($)
Median household income for apartments without a mortgage ($)
Races - White alone (%)
Races - White alone (% change since 2000)
Races - Black alone (%)
Races - Black alone (% change since 2000)
Races - American Indian alone (%)
Races - American Indian alone (% change since 2000)
Races - Asian alone (%)
Races - Asian alone (% change since 2000)
Races - Hispanic (%)
Races - Hispanic (% change since 2000)
Races - Native Hawaiian and Other Pacific Islander alone (%)
Races - Native Hawaiian and Other Pacific Islander alone (% change since 2000)
Races - Two or more races (%)
Races - Two or more races (% change since 2000)
Races - Other race alone (%)
Races - Other race alone (% change since 2000)
Racial diversity
Unemployment (%)
Unemployment (% change since 2000)
Unemployment (%) - White
Unemployment (%) - Black or African American
Unemployment (%) - Asian
Unemployment (%) - Hispanic or Latino
Unemployment (%) - American Indian and Alaska Native
Unemployment (%) - Multirace
Unemployment (%) - Other Race
Population density (people per square mile)
Population - Males (%)
Population - Females (%)
Population - Males (%) - White
Population - Males (%) - Black or African American
Population - Males (%) - Asian
Population - Males (%) - Hispanic or Latino
Population - Males (%) - American Indian and Alaska Native
Population - Males (%) - Multirace
Population - Males (%) - Other Race
Population - Females (%) - White
Population - Females (%) - Black or African American
Population - Females (%) - Asian
Population - Females (%) - Hispanic or Latino
Population - Females (%) - American Indian and Alaska Native
Population - Females (%) - Multirace
Population - Females (%) - Other Race
Coronavirus confirmed cases (Apr 30, 2024)
Deaths caused by coronavirus (Apr 30, 2024)
Coronavirus confirmed cases (per 100k population) (Apr 30, 2024)
Deaths caused by coronavirus (per 100k population) (Apr 30, 2024)
Daily increase in number of cases (Apr 30, 2024)
Weekly increase in number of cases (Apr 30, 2024)
Cases doubled (in days) (Apr 30, 2024)
Hospitalized patients (Apr 18, 2022)
Negative test results (Apr 18, 2022)
Total test results (Apr 18, 2022)
COVID Vaccine doses distributed (per 100k population) (Sep 19, 2023)
COVID Vaccine doses administered (per 100k population) (Sep 19, 2023)
COVID Vaccine doses distributed (Sep 19, 2023)
COVID Vaccine doses administered (Sep 19, 2023)
Likely homosexual households (%)
Likely homosexual households (% change since 2000)
Likely homosexual households - Lesbian couples (%)
Likely homosexual households - Lesbian couples (% change since 2000)
Likely homosexual households - Gay men (%)
Likely homosexual households - Gay men (% change since 2000)
Cost of living index
Median gross rent ($)
Median contract rent ($)
Median monthly housing costs ($)
Median house or condo value ($)
Median house or condo value ($ change since 2000)
Mean house or condo value by units in structure - 1, detached ($)
Mean house or condo value by units in structure - 1, attached ($)
Mean house or condo value by units in structure - 2 ($)
Mean house or condo value by units in structure by units in structure - 3 or 4 ($)
Mean house or condo value by units in structure - 5 or more ($)
Mean house or condo value by units in structure - Boat, RV, van, etc. ($)
Mean house or condo value by units in structure - Mobile home ($)
Median house or condo value ($) - White
Median house or condo value ($) - Black or African American
Median house or condo value ($) - Asian
Median house or condo value ($) - Hispanic or Latino
Median house or condo value ($) - American Indian and Alaska Native
Median house or condo value ($) - Multirace
Median house or condo value ($) - Other Race
Median resident age
Resident age diversity
Median resident age - Males
Median resident age - Females
Median resident age - White
Median resident age - Black or African American
Median resident age - Asian
Median resident age - Hispanic or Latino
Median resident age - American Indian and Alaska Native
Median resident age - Multirace
Median resident age - Other Race
Median resident age - Males - White
Median resident age - Males - Black or African American
Median resident age - Males - Asian
Median resident age - Males - Hispanic or Latino
Median resident age - Males - American Indian and Alaska Native
Median resident age - Males - Multirace
Median resident age - Males - Other Race
Median resident age - Females - White
Median resident age - Females - Black or African American
Median resident age - Females - Asian
Median resident age - Females - Hispanic or Latino
Median resident age - Females - American Indian and Alaska Native
Median resident age - Females - Multirace
Median resident age - Females - Other Race
Commute - mean travel time to work (minutes)
Travel time to work - Less than 5 minutes (%)
Travel time to work - Less than 5 minutes (% change since 2000)
Travel time to work - 5 to 9 minutes (%)
Travel time to work - 5 to 9 minutes (% change since 2000)
Travel time to work - 10 to 19 minutes (%)
Travel time to work - 10 to 19 minutes (% change since 2000)
Travel time to work - 20 to 29 minutes (%)
Travel time to work - 20 to 29 minutes (% change since 2000)
Travel time to work - 30 to 39 minutes (%)
Travel time to work - 30 to 39 minutes (% change since 2000)
Travel time to work - 40 to 59 minutes (%)
Travel time to work - 40 to 59 minutes (% change since 2000)
Travel time to work - 60 to 89 minutes (%)
Travel time to work - 60 to 89 minutes (% change since 2000)
Travel time to work - 90 or more minutes (%)
Travel time to work - 90 or more minutes (% change since 2000)
Marital status - Never married (%)
Marital status - Now married (%)
Marital status - Separated (%)
Marital status - Widowed (%)
Marital status - Divorced (%)
Median family income ($)
Median family income (% change since 2000)
Median non-family income ($)
Median non-family income (% change since 2000)
Median per capita income ($)
Median per capita income (% change since 2000)
Median family income ($) - White
Median family income ($) - Black or African American
Median family income ($) - Asian
Median family income ($) - Hispanic or Latino
Median family income ($) - American Indian and Alaska Native
Median family income ($) - Multirace
Median family income ($) - Other Race
Median year house/condo built
Median year apartment built
Year house built - Built 2005 or later (%)
Year house built - Built 2000 to 2004 (%)
Year house built - Built 1990 to 1999 (%)
Year house built - Built 1980 to 1989 (%)
Year house built - Built 1970 to 1979 (%)
Year house built - Built 1960 to 1969 (%)
Year house built - Built 1950 to 1959 (%)
Year house built - Built 1940 to 1949 (%)
Year house built - Built 1939 or earlier (%)
Average household size
Household density (households per square mile)
Average household size - White
Average household size - Black or African American
Average household size - Asian
Average household size - Hispanic or Latino
Average household size - American Indian and Alaska Native
Average household size - Multirace
Average household size - Other Race
Occupied housing units (%)
Vacant housing units (%)
Owner occupied housing units (%)
Renter occupied housing units (%)
Vacancy status - For rent (%)
Vacancy status - For sale only (%)
Vacancy status - Rented or sold, not occupied (%)
Vacancy status - For seasonal, recreational, or occasional use (%)
Vacancy status - For migrant workers (%)
Vacancy status - Other vacant (%)
Residents with income below the poverty level (%)
Residents with income below 50% of the poverty level (%)
Children below poverty level (%)
Poor families by family type - Married-couple family (%)
Poor families by family type - Male, no wife present (%)
Poor families by family type - Female, no husband present (%)
Poverty status for native-born residents (%)
Poverty status for foreign-born residents (%)
Poverty among high school graduates not in families (%)
Poverty among people who did not graduate high school not in families (%)
Residents with income below the poverty level (%) - White
Residents with income below the poverty level (%) - Black or African American
Residents with income below the poverty level (%) - Asian
Residents with income below the poverty level (%) - Hispanic or Latino
Residents with income below the poverty level (%) - American Indian and Alaska Native
Residents with income below the poverty level (%) - Multirace
Residents with income below the poverty level (%) - Other Race
Air pollution - Air Quality Index (AQI)
Air pollution - CO
Air pollution - NO2
Air pollution - SO2
Air pollution - Ozone
Air pollution - PM10
Air pollution - PM25
Air pollution - Pb
Crime - Murders per 100,000 population
Crime - Rapes per 100,000 population
Crime - Robberies per 100,000 population
Crime - Assaults per 100,000 population
Crime - Burglaries per 100,000 population
Crime - Thefts per 100,000 population
Crime - Auto thefts per 100,000 population
Crime - Arson per 100,000 population
Crime - City-data.com crime index
Crime - Violent crime index
Crime - Property crime index
Crime - Murders per 100,000 population (5 year average)
Crime - Rapes per 100,000 population (5 year average)
Crime - Robberies per 100,000 population (5 year average)
Crime - Assaults per 100,000 population (5 year average)
Crime - Burglaries per 100,000 population (5 year average)
Crime - Thefts per 100,000 population (5 year average)
Crime - Auto thefts per 100,000 population (5 year average)
Crime - Arson per 100,000 population (5 year average)
Crime - City-data.com crime index (5 year average)
Crime - Violent crime index (5 year average)
Crime - Property crime index (5 year average)
1996 Presidential Elections Results (%) - Democratic Party (Clinton)
1996 Presidential Elections Results (%) - Republican Party (Dole)
1996 Presidential Elections Results (%) - Other
2000 Presidential Elections Results (%) - Democratic Party (Gore)
2000 Presidential Elections Results (%) - Republican Party (Bush)
2000 Presidential Elections Results (%) - Other
2004 Presidential Elections Results (%) - Democratic Party (Kerry)
2004 Presidential Elections Results (%) - Republican Party (Bush)
2004 Presidential Elections Results (%) - Other
2008 Presidential Elections Results (%) - Democratic Party (Obama)
2008 Presidential Elections Results (%) - Republican Party (McCain)
2008 Presidential Elections Results (%) - Other
2012 Presidential Elections Results (%) - Democratic Party (Obama)
2012 Presidential Elections Results (%) - Republican Party (Romney)
2012 Presidential Elections Results (%) - Other
2016 Presidential Elections Results (%) - Democratic Party (Clinton)
2016 Presidential Elections Results (%) - Republican Party (Trump)
2016 Presidential Elections Results (%) - Other
2020 Presidential Elections Results (%) - Democratic Party (Biden)
2020 Presidential Elections Results (%) - Republican Party (Trump)
2020 Presidential Elections Results (%) - Other
Ancestries Reported - Arab (%)
Ancestries Reported - Czech (%)
Ancestries Reported - Danish (%)
Ancestries Reported - Dutch (%)
Ancestries Reported - English (%)
Ancestries Reported - French (%)
Ancestries Reported - French Canadian (%)
Ancestries Reported - German (%)
Ancestries Reported - Greek (%)
Ancestries Reported - Hungarian (%)
Ancestries Reported - Irish (%)
Ancestries Reported - Italian (%)
Ancestries Reported - Lithuanian (%)
Ancestries Reported - Norwegian (%)
Ancestries Reported - Polish (%)
Ancestries Reported - Portuguese (%)
Ancestries Reported - Russian (%)
Ancestries Reported - Scotch-Irish (%)
Ancestries Reported - Scottish (%)
Ancestries Reported - Slovak (%)
Ancestries Reported - Subsaharan African (%)
Ancestries Reported - Swedish (%)
Ancestries Reported - Swiss (%)
Ancestries Reported - Ukrainian (%)
Ancestries Reported - United States (%)
Ancestries Reported - Welsh (%)
Ancestries Reported - West Indian (%)
Ancestries Reported - Other (%)
Educational Attainment - No schooling completed (%)
Educational Attainment - Less than high school (%)
Educational Attainment - High school or equivalent (%)
Educational Attainment - Less than 1 year of college (%)
Educational Attainment - 1 or more years of college (%)
Educational Attainment - Associate degree (%)
Educational Attainment - Bachelor's degree (%)
Educational Attainment - Master's degree (%)
Educational Attainment - Professional school degree (%)
Educational Attainment - Doctorate degree (%)
School Enrollment - Nursery, preschool (%)
School Enrollment - Kindergarten (%)
School Enrollment - Grade 1 to 4 (%)
School Enrollment - Grade 5 to 8 (%)
School Enrollment - Grade 9 to 12 (%)
School Enrollment - College undergrad (%)
School Enrollment - Graduate or professional (%)
School Enrollment - Not enrolled in school (%)
School enrollment - Public schools (%)
School enrollment - Private schools (%)
School enrollment - Not enrolled (%)
Median number of rooms in houses and condos
Median number of rooms in apartments
Housing units lacking complete plumbing facilities (%)
Housing units lacking complete kitchen facilities (%)
Density of houses
Urban houses (%)
Rural houses (%)
Households with people 60 years and over (%)
Households with people 65 years and over (%)
Households with people 75 years and over (%)
Households with one or more nonrelatives (%)
Households with no nonrelatives (%)
Population in households (%)
Family households (%)
Nonfamily households (%)
Population in families (%)
Family households with own children (%)
Median number of bedrooms in owner occupied houses
Mean number of bedrooms in owner occupied houses
Median number of bedrooms in renter occupied houses
Mean number of bedrooms in renter occupied houses
Median number of vehichles in owner occupied houses
Mean number of vehichles in owner occupied houses
Median number of vehichles in renter occupied houses
Mean number of vehichles in renter occupied houses
Mortgage status - with mortgage (%)
Mortgage status - with second mortgage (%)
Mortgage status - with home equity loan (%)
Mortgage status - with both second mortgage and home equity loan (%)
Mortgage status - without a mortgage (%)
Average family size
Average family size - White
Average family size - Black or African American
Average family size - Asian
Average family size - Hispanic or Latino
Average family size - American Indian and Alaska Native
Average family size - Multirace
Average family size - Other Race
Geographical mobility - Same house 1 year ago (%)
Geographical mobility - Moved within same county (%)
Geographical mobility - Moved from different county within same state (%)
Geographical mobility - Moved from different state (%)
Geographical mobility - Moved from abroad (%)
Place of birth - Born in state of residence (%)
Place of birth - Born in other state (%)
Place of birth - Native, outside of US (%)
Place of birth - Foreign born (%)
Housing units in structures - 1, detached (%)
Housing units in structures - 1, attached (%)
Housing units in structures - 2 (%)
Housing units in structures - 3 or 4 (%)
Housing units in structures - 5 to 9 (%)
Housing units in structures - 10 to 19 (%)
Housing units in structures - 20 to 49 (%)
Housing units in structures - 50 or more (%)
Housing units in structures - Mobile home (%)
Housing units in structures - Boat, RV, van, etc. (%)
House/condo owner moved in on average (years ago)
Renter moved in on average (years ago)
Year householder moved into unit - Moved in 1999 to March 2000 (%)
Year householder moved into unit - Moved in 1995 to 1998 (%)
Year householder moved into unit - Moved in 1990 to 1994 (%)
Year householder moved into unit - Moved in 1980 to 1989 (%)
Year householder moved into unit - Moved in 1970 to 1979 (%)
Year householder moved into unit - Moved in 1969 or earlier (%)
Means of transportation to work - Drove car alone (%)
Means of transportation to work - Carpooled (%)
Means of transportation to work - Public transportation (%)
Means of transportation to work - Bus or trolley bus (%)
Means of transportation to work - Streetcar or trolley car (%)
Means of transportation to work - Subway or elevated (%)
Means of transportation to work - Railroad (%)
Means of transportation to work - Ferryboat (%)
Means of transportation to work - Taxicab (%)
Means of transportation to work - Motorcycle (%)
Means of transportation to work - Bicycle (%)
Means of transportation to work - Walked (%)
Means of transportation to work - Other means (%)
Working at home (%)
Industry diversity
Most Common Industries - Agriculture, forestry, fishing and hunting, and mining (%)
Most Common Industries - Agriculture, forestry, fishing and hunting (%)
Most Common Industries - Mining, quarrying, and oil and gas extraction (%)
Most Common Industries - Construction (%)
Most Common Industries - Manufacturing (%)
Most Common Industries - Wholesale trade (%)
Most Common Industries - Retail trade (%)
Most Common Industries - Transportation and warehousing, and utilities (%)
Most Common Industries - Transportation and warehousing (%)
Most Common Industries - Utilities (%)
Most Common Industries - Information (%)
Most Common Industries - Finance and insurance, and real estate and rental and leasing (%)
Most Common Industries - Finance and insurance (%)
Most Common Industries - Real estate and rental and leasing (%)
Most Common Industries - Professional, scientific, and management, and administrative and waste management services (%)
Most Common Industries - Professional, scientific, and technical services (%)
Most Common Industries - Management of companies and enterprises (%)
Most Common Industries - Administrative and support and waste management services (%)
Most Common Industries - Educational services, and health care and social assistance (%)
Most Common Industries - Educational services (%)
Most Common Industries - Health care and social assistance (%)
Most Common Industries - Arts, entertainment, and recreation, and accommodation and food services (%)
Most Common Industries - Arts, entertainment, and recreation (%)
Most Common Industries - Accommodation and food services (%)
Most Common Industries - Other services, except public administration (%)
Most Common Industries - Public administration (%)
Occupation diversity
Most Common Occupations - Management, business, science, and arts occupations (%)
Most Common Occupations - Management, business, and financial occupations (%)
Most Common Occupations - Management occupations (%)
Most Common Occupations - Business and financial operations occupations (%)
Most Common Occupations - Computer, engineering, and science occupations (%)
Most Common Occupations - Computer and mathematical occupations (%)
Most Common Occupations - Architecture and engineering occupations (%)
Most Common Occupations - Life, physical, and social science occupations (%)
Most Common Occupations - Education, legal, community service, arts, and media occupations (%)
Most Common Occupations - Community and social service occupations (%)
Most Common Occupations - Legal occupations (%)
Most Common Occupations - Education, training, and library occupations (%)
Most Common Occupations - Arts, design, entertainment, sports, and media occupations (%)
Most Common Occupations - Healthcare practitioners and technical occupations (%)
Most Common Occupations - Health diagnosing and treating practitioners and other technical occupations (%)
Most Common Occupations - Health technologists and technicians (%)
Most Common Occupations - Service occupations (%)
Most Common Occupations - Healthcare support occupations (%)
Most Common Occupations - Protective service occupations (%)
Most Common Occupations - Fire fighting and prevention, and other protective service workers including supervisors (%)
Most Common Occupations - Law enforcement workers including supervisors (%)
Most Common Occupations - Food preparation and serving related occupations (%)
Most Common Occupations - Building and grounds cleaning and maintenance occupations (%)
Most Common Occupations - Personal care and service occupations (%)
Most Common Occupations - Sales and office occupations (%)
Most Common Occupations - Sales and related occupations (%)
Most Common Occupations - Office and administrative support occupations (%)
Most Common Occupations - Natural resources, construction, and maintenance occupations (%)
Most Common Occupations - Farming, fishing, and forestry occupations (%)
Most Common Occupations - Construction and extraction occupations (%)
Most Common Occupations - Installation, maintenance, and repair occupations (%)
Most Common Occupations - Production, transportation, and material moving occupations (%)
Most Common Occupations - Production occupations (%)
Most Common Occupations - Transportation occupations (%)
Most Common Occupations - Material moving occupations (%)
People in Group quarters - Institutionalized population (%)
People in Group quarters - Correctional institutions (%)
People in Group quarters - Federal prisons and detention centers (%)
People in Group quarters - Halfway houses (%)
People in Group quarters - Local jails and other confinement facilities (including police lockups) (%)
People in Group quarters - Military disciplinary barracks (%)
People in Group quarters - State prisons (%)
People in Group quarters - Other types of correctional institutions (%)
People in Group quarters - Nursing homes (%)
People in Group quarters - Hospitals/wards, hospices, and schools for the handicapped (%)
People in Group quarters - Hospitals/wards and hospices for chronically ill (%)
People in Group quarters - Hospices or homes for chronically ill (%)
People in Group quarters - Military hospitals or wards for chronically ill (%)
People in Group quarters - Other hospitals or wards for chronically ill (%)
People in Group quarters - Hospitals or wards for drug/alcohol abuse (%)
People in Group quarters - Mental (Psychiatric) hospitals or wards (%)
People in Group quarters - Schools, hospitals, or wards for the mentally retarded (%)
People in Group quarters - Schools, hospitals, or wards for the physically handicapped (%)
People in Group quarters - Institutions for the deaf (%)
People in Group quarters - Institutions for the blind (%)
People in Group quarters - Orthopedic wards and institutions for the physically handicapped (%)
People in Group quarters - Wards in general hospitals for patients who have no usual home elsewhere (%)
People in Group quarters - Wards in military hospitals for patients who have no usual home elsewhere (%)
People in Group quarters - Juvenile institutions (%)
People in Group quarters - Long-term care (%)
People in Group quarters - Homes for abused, dependent, and neglected children (%)
People in Group quarters - Residential treatment centers for emotionally disturbed children (%)
People in Group quarters - Training schools for juvenile delinquents (%)
People in Group quarters - Short-term care, detention or diagnostic centers for delinquent children (%)
People in Group quarters - Type of juvenile institution unknown (%)
People in Group quarters - Noninstitutionalized population (%)
People in Group quarters - College dormitories (includes college quarters off campus) (%)
People in Group quarters - Military quarters (%)
People in Group quarters - On base (%)
People in Group quarters - Barracks, unaccompanied personnel housing (UPH), (Enlisted/Officer), ;and similar group living quarters for military personnel (%)
People in Group quarters - Transient quarters for temporary residents (%)
People in Group quarters - Military ships (%)
People in Group quarters - Group homes (%)
People in Group quarters - Homes or halfway houses for drug/alcohol abuse (%)
People in Group quarters - Homes for the mentally ill (%)
People in Group quarters - Homes for the mentally retarded (%)
People in Group quarters - Homes for the physically handicapped (%)
People in Group quarters - Other group homes (%)
People in Group quarters - Religious group quarters (%)
People in Group quarters - Dormitories (%)
People in Group quarters - Agriculture workers' dormitories on farms (%)
People in Group quarters - Job Corps and vocational training facilities (%)
People in Group quarters - Other workers' dormitories (%)
People in Group quarters - Crews of maritime vessels (%)
People in Group quarters - Other nonhousehold living situations (%)
People in Group quarters - Other noninstitutional group quarters (%)
Residents speaking English at home (%)
Residents speaking English at home - Born in the United States (%)
Residents speaking English at home - Native, born elsewhere (%)
Residents speaking English at home - Foreign born (%)
Residents speaking Spanish at home (%)
Residents speaking Spanish at home - Born in the United States (%)
Residents speaking Spanish at home - Native, born elsewhere (%)
Residents speaking Spanish at home - Foreign born (%)
Residents speaking other language at home (%)
Residents speaking other language at home - Born in the United States (%)
Residents speaking other language at home - Native, born elsewhere (%)
Residents speaking other language at home - Foreign born (%)
Class of Workers - Employee of private company (%)
Class of Workers - Self-employed in own incorporated business (%)
Class of Workers - Private not-for-profit wage and salary workers (%)
Class of Workers - Local government workers (%)
Class of Workers - State government workers (%)
Class of Workers - Federal government workers (%)
Class of Workers - Self-employed workers in own not incorporated business and Unpaid family workers (%)
House heating fuel used in houses and condos - Utility gas (%)
House heating fuel used in houses and condos - Bottled, tank, or LP gas (%)
House heating fuel used in houses and condos - Electricity (%)
House heating fuel used in houses and condos - Fuel oil, kerosene, etc. (%)
House heating fuel used in houses and condos - Coal or coke (%)
House heating fuel used in houses and condos - Wood (%)
House heating fuel used in houses and condos - Solar energy (%)
House heating fuel used in houses and condos - Other fuel (%)
House heating fuel used in houses and condos - No fuel used (%)
House heating fuel used in apartments - Utility gas (%)
House heating fuel used in apartments - Bottled, tank, or LP gas (%)
House heating fuel used in apartments - Electricity (%)
House heating fuel used in apartments - Fuel oil, kerosene, etc. (%)
House heating fuel used in apartments - Coal or coke (%)
House heating fuel used in apartments - Wood (%)
House heating fuel used in apartments - Solar energy (%)
House heating fuel used in apartments - Other fuel (%)
House heating fuel used in apartments - No fuel used (%)
Armed forces status - In Armed Forces (%)
Armed forces status - Civilian (%)
Armed forces status - Civilian - Veteran (%)
Armed forces status - Civilian - Nonveteran (%)
Fatal accidents locations in years 2005-2021
Fatal accidents locations in 2005
Fatal accidents locations in 2006
Fatal accidents locations in 2007
Fatal accidents locations in 2008
Fatal accidents locations in 2009
Fatal accidents locations in 2010
Fatal accidents locations in 2011
Fatal accidents locations in 2012
Fatal accidents locations in 2013
Fatal accidents locations in 2014
Fatal accidents locations in 2015
Fatal accidents locations in 2016
Fatal accidents locations in 2017
Fatal accidents locations in 2018
Fatal accidents locations in 2019
Fatal accidents locations in 2020
Fatal accidents locations in 2021
Alcohol use - People drinking some alcohol every month (%)
Alcohol use - People not drinking at all (%)
Alcohol use - Average days/month drinking alcohol
Alcohol use - Average drinks/week
Alcohol use - Average days/year people drink much
Audiometry - Average condition of hearing (%)
Audiometry - People that can hear a whisper from across a quiet room (%)
Audiometry - People that can hear normal voice from across a quiet room (%)
Audiometry - Ears ringing, roaring, buzzing (%)
Audiometry - Had a job exposure to loud noise (%)
Audiometry - Had off-work exposure to loud noise (%)
Blood Pressure & Cholesterol - Has high blood pressure (%)
Blood Pressure & Cholesterol - Checking blood pressure at home (%)
Blood Pressure & Cholesterol - Frequently checking blood cholesterol (%)
Blood Pressure & Cholesterol - Has high cholesterol level (%)
Consumer Behavior - Money monthly spent on food at supermarket/grocery store
Consumer Behavior - Money monthly spent on food at other stores
Consumer Behavior - Money monthly spent on eating out
Consumer Behavior - Money monthly spent on carryout/delivered foods
Consumer Behavior - Income spent on food at supermarket/grocery store (%)
Consumer Behavior - Income spent on food at other stores (%)
Consumer Behavior - Income spent on eating out (%)
Consumer Behavior - Income spent on carryout/delivered foods (%)
Current Health Status - General health condition (%)
Current Health Status - Blood donors (%)
Current Health Status - Has blood ever tested for HIV virus (%)
Current Health Status - Left-handed people (%)
Dermatology - People using sunscreen (%)
Diabetes - Diabetics (%)
Diabetes - Had a blood test for high blood sugar (%)
Diabetes - People taking insulin (%)
Diet Behavior & Nutrition - Diet health (%)
Diet Behavior & Nutrition - Milk product consumption (# of products/month)
Diet Behavior & Nutrition - Meals not home prepared (#/week)
Diet Behavior & Nutrition - Meals from fast food or pizza place (#/week)
Diet Behavior & Nutrition - Ready-to-eat foods (#/month)
Diet Behavior & Nutrition - Frozen meals/pizza (#/month)
Drug Use - People that ever used marijuana or hashish (%)
Drug Use - Ever used hard drugs (%)
Drug Use - Ever used any form of cocaine (%)
Drug Use - Ever used heroin (%)
Drug Use - Ever used methamphetamine (%)
Health Insurance - People covered by health insurance (%)
Kidney Conditions-Urology - Avg. # of times urinating at night
Medical Conditions - People with asthma (%)
Medical Conditions - People with anemia (%)
Medical Conditions - People with psoriasis (%)
Medical Conditions - People with overweight (%)
Medical Conditions - Elderly people having difficulties in thinking or remembering (%)
Medical Conditions - People who ever received blood transfusion (%)
Medical Conditions - People having trouble seeing even with glass/contacts (%)
Medical Conditions - People with arthritis (%)
Medical Conditions - People with gout (%)
Medical Conditions - People with congestive heart failure (%)
Medical Conditions - People with coronary heart disease (%)
Medical Conditions - People with angina pectoris (%)
Medical Conditions - People who ever had heart attack (%)
Medical Conditions - People who ever had stroke (%)
Medical Conditions - People with emphysema (%)
Medical Conditions - People with thyroid problem (%)
Medical Conditions - People with chronic bronchitis (%)
Medical Conditions - People with any liver condition (%)
Medical Conditions - People who ever had cancer or malignancy (%)
Mental Health - People who have little interest in doing things (%)
Mental Health - People feeling down, depressed, or hopeless (%)
Mental Health - People who have trouble sleeping or sleeping too much (%)
Mental Health - People feeling tired or having little energy (%)
Mental Health - People with poor appetite or overeating (%)
Mental Health - People feeling bad about themself (%)
Mental Health - People who have trouble concentrating on things (%)
Mental Health - People moving or speaking slowly or too fast (%)
Mental Health - People having thoughts they would be better off dead (%)
Oral Health - Average years since last visit a dentist
Oral Health - People embarrassed because of mouth (%)
Oral Health - People with gum disease (%)
Oral Health - General health of teeth and gums (%)
Oral Health - Average days a week using dental floss/device
Oral Health - Average days a week using mouthwash for dental problem
Oral Health - Average number of teeth
Pesticide Use - Households using pesticides to control insects (%)
Pesticide Use - Households using pesticides to kill weeds (%)
Physical Activity - People doing vigorous-intensity work activities (%)
Physical Activity - People doing moderate-intensity work activities (%)
Physical Activity - People walking or bicycling (%)
Physical Activity - People doing vigorous-intensity recreational activities (%)
Physical Activity - People doing moderate-intensity recreational activities (%)
Physical Activity - Average hours a day doing sedentary activities
Physical Activity - Average hours a day watching TV or videos
Physical Activity - Average hours a day using computer
Physical Functioning - People having limitations keeping them from working (%)
Physical Functioning - People limited in amount of work they can do (%)
Physical Functioning - People that need special equipment to walk (%)
Physical Functioning - People experiencing confusion/memory problems (%)
Physical Functioning - People requiring special healthcare equipment (%)
Prescription Medications - Average number of prescription medicines taking
Preventive Aspirin Use - Adults 40+ taking low-dose aspirin (%)
Reproductive Health - Vaginal deliveries (%)
Reproductive Health - Cesarean deliveries (%)
Reproductive Health - Deliveries resulted in a live birth (%)
Reproductive Health - Pregnancies resulted in a delivery (%)
Reproductive Health - Women breastfeeding newborns (%)
Reproductive Health - Women that had a hysterectomy (%)
Reproductive Health - Women that had both ovaries removed (%)
Reproductive Health - Women that have ever taken birth control pills (%)
Reproductive Health - Women taking birth control pills (%)
Reproductive Health - Women that have ever used Depo-Provera or injectables (%)
Reproductive Health - Women that have ever used female hormones (%)
Sexual Behavior - People 18+ that ever had sex (vaginal, anal, or oral) (%)
Sexual Behavior - Males 18+ that ever had vaginal sex with a woman (%)
Sexual Behavior - Males 18+ that ever performed oral sex on a woman (%)
Sexual Behavior - Males 18+ that ever had anal sex with a woman (%)
Sexual Behavior - Males 18+ that ever had any sex with a man (%)
Sexual Behavior - Females 18+ that ever had vaginal sex with a man (%)
Sexual Behavior - Females 18+ that ever performed oral sex on a man (%)
Sexual Behavior - Females 18+ that ever had anal sex with a man (%)
Sexual Behavior - Females 18+ that ever had any kind of sex with a woman (%)
Sexual Behavior - Average age people first had sex
Sexual Behavior - Average number of female sex partners in lifetime (males 18+)
Sexual Behavior - Average number of female vaginal sex partners in lifetime (males 18+)
Sexual Behavior - Average age people first performed oral sex on a woman (18+)
Sexual Behavior - Average number of woman performed oral sex on in lifetime (18+)
Sexual Behavior - Average number of male sex partners in lifetime (males 18+)
Sexual Behavior - Average number of male anal sex partners in lifetime (males 18+)
Sexual Behavior - Average age people first performed oral sex on a man (18+)
Sexual Behavior - Average number of male oral sex partners in lifetime (18+)
Sexual Behavior - People using protection when performing oral sex (%)
Sexual Behavior - Average number of times people have vaginal or anal sex a year
Sexual Behavior - People having sex without condom (%)
Sexual Behavior - Average number of male sex partners in lifetime (females 18+)
Sexual Behavior - Average number of male vaginal sex partners in lifetime (females 18+)
Sexual Behavior - Average number of female sex partners in lifetime (females 18+)
Sexual Behavior - Circumcised males 18+ (%)
Sleep Disorders - Average hours sleeping at night
Sleep Disorders - People that has trouble sleeping (%)
Smoking-Cigarette Use - People smoking cigarettes (%)
Taste & Smell - People 40+ having problems with smell (%)
Taste & Smell - People 40+ having problems with taste (%)
Taste & Smell - People 40+ that ever had wisdom teeth removed (%)
Taste & Smell - People 40+ that ever had tonsils teeth removed (%)
Taste & Smell - People 40+ that ever had a loss of consciousness because of a head injury (%)
Taste & Smell - People 40+ that ever had a broken nose or other serious injury to face or skull (%)
Taste & Smell - People 40+ that ever had two or more sinus infections (%)
Weight - Average height (inches)
Weight - Average weight (pounds)
Weight - Average BMI
Weight - People that are obese (%)
Weight - People that ever were obese (%)
Weight - People trying to lose weight (%)
100%
urban population.
Estimated median house/condo value in 2022: $76,995
48141:
$76,995Michigan:
$224,400
Median resident age: This zip code:
32.6 yearsMichigan median age:
40.3 years
Average household size: This zip code:
2.7 peopleMichigan:
2.4 people
Averages for the 2020 tax year for zip code 48141, filed in 2021:
Average Adjusted Gross Income (AGI) in 2020: $31,211 (Individual Income Tax Returns) Here:
$31,211State:
$68,945
Salary/wage: $28,350 (reported on 77.7% of returns )Here:
$28,350State:
$57,142
(% of AGI for various income ranges: 929.0% for AGIs below $25k , 3079.0% for AGIs $25k-50k , 6886.7% for AGIs $50k-75k , 11494.8% for AGIs $75k-100k , 15387.8% for AGIs $100k-200k ) Taxable interest for individuals: $317 (reported on 9.7% of returns )This zip code:
$317Michigan:
$1,630
(% of AGI for various income ranges: 2.6% for AGIs below $25k , 2.7% for AGIs $25k-50k , 4.9% for AGIs $50k-75k , 10.4% for AGIs $75k-100k , 47.2% for AGIs $100k-200k ) Ordinary dividends: $1,331 (reported on 3.5% of returns )(% of AGI for various income ranges: 2.6% for AGIs below $25k , 3.4% for AGIs $25k-50k , 18.5% for AGIs $50k-75k , 33.6% for AGIs $75k-100k , 39.4% for AGIs $100k-200k ) Net capital gain/loss in AGI: +$4,271 (reported on 3.0% of returns )Here:
+$4,271State:
+$20,064
(% of AGI for various income ranges: 1.8% for AGIs below $25k , 4.1% for AGIs $25k-50k , 28.7% for AGIs $50k-75k , 73.2% for AGIs $75k-100k , 467.2% for AGIs $100k-200k ) Profit/loss from business: +$1,200 (reported on 19.3% of returns )Here:
+$1,200State:
+$11,172
(% of AGI for various income ranges: 45.7% for AGIs below $25k , 21.1% for AGIs $50k-75k , 122.0% for AGIs $75k-100k , 153.3% for AGIs $100k-200k ) Taxable individual retirement arrangement distribution: $8,413 (reported on 2.8% of returns )48141:
$8,413Michigan:
$19,803
(% of AGI for various income ranges: 12.1% for AGIs below $25k , 16.2% for AGIs $25k-50k , 95.3% for AGIs $50k-75k , 116.0% for AGIs $75k-100k , 303.9% for AGIs $100k-200k ) Total itemized deductions: $22,243 (reported on 2.7% of returns )Here:
$22,243State:
$34,117
(% of AGI for various income ranges: 11.7% for AGIs below $25k , 57.7% for AGIs $25k-50k , 233.4% for AGIs $50k-75k , 450.0% for AGIs $75k-100k , 814.4% for AGIs $100k-200k ) Charity contributions: $9,921 (reported on 2.1% of returns )(% of AGI for various income ranges: 18.8% for AGIs $25k-50k , 93.9% for AGIs $50k-75k , 184.0% for AGIs $75k-100k , 343.9% for AGIs $100k-200k ) Taxes paid: $4,670 (reported on 2.7% of returns )(% of AGI for various income ranges: 1.6% for AGIs below $25k , 10.4% for AGIs $25k-50k , 52.5% for AGIs $50k-75k , 104.8% for AGIs $75k-100k , 191.1% for AGIs $100k-200k ) Earned income credit: $2,755 (reported on 35.3% of returns )(% of AGI for various income ranges: 162.2% for AGIs below $25k , 124.1% for AGIs $25k-50k , 1.9% for AGIs $50k-75k ) Percentage of individuals using paid preparers for their 2020 taxes: 91.7%(% for various income ranges: 92.2% for AGIs below $25k , 92.3% for AGIs $25k-50k , 88.8% for AGIs $50k-75k , 88.1% for AGIs $75k-100k , 96.7% for AGIs $100k-200k , 0.0% for AGIs over 200k )
Averages for the 2012 tax year for zip code 48141, filed in 2013:
Average Adjusted Gross Income (AGI) in 2012: $26,404 (Individual Income Tax Returns) Here:
$26,404State:
$55,609
Salary/wage: $24,442 (reported on 81.3% of returns )Here:
$24,442State:
$46,782
(% of AGI for various income ranges: 68.1% for AGIs below $25k , 77.9% for AGIs $25k-50k , 80.3% for AGIs $50k-75k , 77.4% for AGIs $75k-100k , 75.6% for AGIs $100k-200k ) Taxable interest for individuals: $526 (reported on 12.8% of returns )This zip code:
$526Michigan:
$1,491
(% of AGI for various income ranges: 0.4% for AGIs below $25k , 0.2% for AGIs $25k-50k , 0.2% for AGIs $50k-75k , 0.1% for AGIs $75k-100k , 0.4% for AGIs $100k-200k ) Ordinary dividends: $1,026 (reported on 4.8% of returns )(% of AGI for various income ranges: 0.2% for AGIs below $25k , 0.1% for AGIs $25k-50k , 0.3% for AGIs $50k-75k , 0.2% for AGIs $75k-100k , 0.2% for AGIs $100k-200k ) Profit/loss from business: +$5,789 (reported on 18.4% of returns )Here:
+$5,789State:
+$11,523
(% of AGI for various income ranges: 13.6% for AGIs below $25k , 0.1% for AGIs $25k-50k , 0.2% for AGIs $75k-100k , 1.1% for AGIs $100k-200k ) Taxable individual retirement arrangement distribution: $8,850 (reported on 4.0% of returns )48141:
$8,850Michigan:
$15,298
(% of AGI for various income ranges: 0.7% for AGIs below $25k , 1.2% for AGIs $25k-50k , 1.5% for AGIs $50k-75k , 1.8% for AGIs $75k-100k , 3.1% for AGIs $100k-200k ) Total itemized deductions: $14,588 (27% of AGI, reported on 14.8% of returns )Here:
$14,588State:
$21,628
Here:
26.9% of AGIState:
18.4% of AGI
(% of AGI for various income ranges: 4.5% for AGIs below $25k , 7.8% for AGIs $25k-50k , 10.2% for AGIs $50k-75k , 12.2% for AGIs $75k-100k , 12.3% for AGIs $100k-200k ) Charity contributions: $3,868 (reported on 12.3% of returns )(% of AGI for various income ranges: 0.7% for AGIs below $25k , 1.7% for AGIs $25k-50k , 2.4% for AGIs $50k-75k , 3.3% for AGIs $75k-100k , 2.8% for AGIs $100k-200k ) Taxes paid: $4,761 (reported on 14.7% of returns )(% of AGI for various income ranges: 1.1% for AGIs below $25k , 2.3% for AGIs $25k-50k , 3.5% for AGIs $50k-75k , 4.3% for AGIs $75k-100k , 5.1% for AGIs $100k-200k ) Earned income credit: $2,898 (reported on 39.8% of returns )(% of AGI for various income ranges: 13.3% for AGIs below $25k , 1.6% for AGIs $25k-50k ) Percentage of individuals using paid preparers for their 2012 taxes: 56.7%(% for various income ranges: 56.5% for AGIs below $25k , 55.3% for AGIs $25k-50k , 59.6% for AGIs $50k-75k , 61.1% for AGIs $75k-100k , 61.9% for AGIs $100k-200k )
Averages for the 2004 tax year for zip code 48141, filed in 2005:
Average Adjusted Gross Income (AGI) in 2004: $30,362 (Individual Income Tax Returns) Here:
$30,362State:
$48,204
Salary/wage: $29,310 (reported on 87.5% of returns )Here:
$29,310State:
$42,791
(% of AGI for various income ranges: 81.3% for AGIs below $10k , 76.6% for AGIs $10k-25k , 85.1% for AGIs $25k-50k , 88.2% for AGIs $50k-75k , 87.8% for AGIs $75k-100k , 83.0% for AGIs over 100k ) Taxable interest for individuals: $613 (reported on 24.3% of returns )This zip code:
$613Michigan:
$1,725
(% of AGI for various income ranges: 1.6% for AGIs below $10k , 0.6% for AGIs $10k-25k , 0.4% for AGIs $25k-50k , 0.3% for AGIs $50k-75k , 0.6% for AGIs $75k-100k , 0.2% for AGIs over 100k ) Taxable dividends: $805 (reported on 9.4% of returns )(% of AGI for various income ranges: 0.6% for AGIs below $10k , 0.3% for AGIs $10k-25k , 0.2% for AGIs $25k-50k , 0.2% for AGIs $50k-75k , 0.2% for AGIs $75k-100k , 0.2% for AGIs over 100k ) Net capital gain/loss: +$962 (reported on 5.2% of returns )(% of AGI for various income ranges: -0.6% for AGIs below $10k , -0.0% for AGIs $10k-25k , 0.1% for AGIs $25k-50k , 0.1% for AGIs $50k-75k , 0.3% for AGIs $75k-100k , 1.1% for AGIs over 100k ) Profit/loss from business: +$2,860 (reported on 9.8% of returns )Here:
+$2,860State:
+$9,547
(% of AGI for various income ranges: 5.1% for AGIs below $10k , 3.6% for AGIs $10k-25k , 0.2% for AGIs $25k-50k , 0.3% for AGIs $50k-75k , -0.3% for AGIs $75k-100k , 0.6% for AGIs over 100k ) IRA payment deduction: $1,718 (reported on 1.0% of returns )48141:
$1,718Michigan:
$2,875
Total itemized deductions: $13,642 (26% of AGI, reported on 27.9% of returns )Here:
$13,642State:
$18,509
Here:
26.4% of AGIState:
20.7% of AGI
(% of AGI for various income ranges: 8.0% for AGIs below $10k , 8.5% for AGIs $10k-25k , 12.9% for AGIs $25k-50k , 14.1% for AGIs $50k-75k , 13.7% for AGIs $75k-100k , 14.4% for AGIs over 100k ) Charity contributions deductions: $3,234 (6% of AGI, reported on 24.6% of returns )Here:
6.0% of AGIState:
3.6% of AGI
(% of AGI for various income ranges: 0.7% for AGIs below $10k , 1.4% for AGIs $10k-25k , 2.5% for AGIs $25k-50k , 3.0% for AGIs $50k-75k , 3.1% for AGIs $75k-100k , 4.0% for AGIs over 100k ) Total tax: $3,705 (reported on 64.6% of returns )(% of AGI for various income ranges: 1.8% for AGIs below $10k , 3.1% for AGIs $10k-25k , 6.2% for AGIs $25k-50k , 9.5% for AGIs $50k-75k , 11.6% for AGIs $75k-100k , 14.6% for AGIs over 100k ) Earned income credit: $1,930 (reported on 28.6% of returns )Percentage of individuals using paid preparers for their 2004 taxes: 65.5%(% for various income ranges: 63.0% for AGIs below $10k , 70.7% for AGIs $10k-25k , 61.4% for AGIs $25k-50k , 66.3% for AGIs $50k-75k , 62.7% for AGIs $75k-100k , 71.7% for AGIs over 100k )
Estimated median household income in 2022: This zip code:
$37,530Michigan:
$66,986
Nearest zip codes: 48135 ,
48186 ,
48127 ,
48125 ,
48128 ,
48124 .
Inkster Zip Code Map
Percentage of family households: This zip code:
48.0%Michigan:
43.3%
Percentage of households with unmarried partners: This zip code:
6.7%Michigan:
45.7%
Likely homosexual households (counted as self-reported same-sex unmarried-partner households)
Lesbian couples: 0.5% of all households Gay men: 0.0% of all households
Household received Food Stamps/SNAP in the past 12 months: 3,496Household did not receive Food Stamps/SNAP in the past 12 months: 6,081
Women who had a birth in the past 12 months: 389 (87 now married , 290 unmarried) Women who did not have a birth in the past 12 months: 6,091 (1,463 now married , 4,649 unmarried)
Housing units in zip code 48141 with a mortgage: 1,619 (179
second mortgage , 146
both second mortgage and home equity loan )
Houses without a mortgage: 30
Median monthly owner costs for units with a mortgage: $1,110
Median monthly owner costs for units without a mortgage: $493
Residents with income below the poverty level in 2022:
This zip code:
35.7%Whole state:
13.4%
Residents with income below 50% of the poverty level in 2022:
This zip code:
18.5%Whole state:
6.9%
Median number of rooms in houses and condos: Median number of rooms in apartments: Notable locations in this zip code not listed on our city pages
Click to draw/clear zip code borders Notable locations in zip code 48141: (A) , Inkster City Hall (B) , Inkster Court House (C) , Inkster Fire Department (D) , Inkster Library (E) , Inkster Police Station (F) . Display/hide their locations on the map
Shopping Centers: (1) , IGA - Inkster Center Shopping Center (2) . Display/hide their locations on the map
Cemeteries: (1) , Westwood Cemetery (2) . Display/hide their locations on the map
Streams, rivers, and creeks: (A) . Display/hide its location on the map
Parks in zip code 48141 include: (1) , Westwood Park (2) , Bel-Aire Park (3) , Demby Park (4) , Oakgrove Park (5) , Colonial Park (6) , Lemoyne Park (7) , Lower Rouge Parkway (8) , Northwest Park (9) . Display/hide their locations on the map
Year house built (houses)
0 2020 or later38 2010 to 2019502 2000 to 2009441 1990 to 1999263 1980 to 19891,422 1970 to 19791,270 1960 to 19694,718 1950 to 19591,472 1940 to 1949755 1939 or earlier
Zip code 48141 household income distribution in 2022 1,202 Less than $10,0001,187 $10,000 to $14,999356 $15,000 to $19,999550 $20,000 to $24,999626 $25,000 to $29,999706 $30,000 to $34,999307 $35,000 to $39,999316 $40,000 to $44,999339 $45,000 to $49,999752 $50,000 to $59,999900 $60,000 to $74,9991,234 $75,000 to $99,999351 $100,000 to $124,999153 $125,000 to $149,999259 $150,000 to $199,999237 $200,000 or moreEstimate of home value of owner-occupied houses/condos in 2022 in zip code 48141 52 Less than $10,00033 $10,000 to $14,99978 $15,000 to $19,99988 $20,000 to $24,999174 $25,000 to $29,999139 $30,000 to $34,999103 $35,000 to $39,999409 $40,000 to $49,999312 $50,000 to $59,999517 $60,000 to $69,999433 $70,000 to $79,999282 $80,000 to $89,999158 $90,000 to $99,999294 $100,000 to $124,999109 $125,000 to $149,999264 $150,000 to $174,9994 $175,000 to $199,99943 $200,000 to $249,99954 $250,000 to $299,999147 $300,000 to $399,99949 $400,000 to $499,99999 $500,000 to $749,9998 $1,000,000 to $1,499,999Rent paid by renters in 2022 in zip code 48141 178 Less than $10034 $100 to $14988 $150 to $199156 $200 to $249217 $250 to $29985 $300 to $34930 $400 to $44949 $450 to $49977 $500 to $549103 $550 to $59972 $600 to $649198 $650 to $699257 $700 to $749391 $750 to $799911 $800 to $899775 $900 to $999677 $1,000 to $1,249126 $1,250 to $1,4992 $1,500 to $1,999507 No cash rent
Median gross rent in 2022: $1,113.
Estimated median house (or condo) value in 2022 for: White Non-Hispanic householders: $80,197Black or African American householders: $75,507American Indian or Alaska Native householders: $81,685Asian householders: $100,333Some other race householders: $95,985Two or more races householders: $79,168Hispanic or Latino householders: $90,151Estimated median house or condo value in 2022: $76,995
48141:
$76,995Michigan:
$224,400
Lower value quartile - upper value quartile: $50,862 - $113,070
Mean price in 2022: Detached houses: $84,063Here:
$84,063State:
$280,038
Townhouses or other attached units: $71,634Here:
$71,634State:
$239,520
Mobile homes: $517,694Here:
$517,694State:
$72,868
Housing units in structures:
One, detached: 8,249One, attached: 174Two: 2803 or 4: 3095 to 9: 57310 to 19: 63320 to 49: 23450 or more: 550Mobile homes: 122Unemployment : 9.3%
Means of transportation to work in zip code 48141 73.2% 7,062 Drove a car alone7.3% 708 Carpooled3.4% 327 Bus or trolley bus1.2% 118 Taxi0.1% 14 Bicycle1.0% 95 Walked3.0% 288 Other means9.3% 899 Worked at homeTravel time to work (commute) in zip code 48141 180 Less than 5 minutes385 5 to 9 minutes933 10 to 14 minutes1,204 15 to 19 minutes1,867 20 to 24 minutes997 25 to 29 minutes1,196 30 to 34 minutes158 35 to 39 minutes191 40 to 44 minutes654 45 to 59 minutes725 60 to 89 minutes131 90 or more minutes
Neighborhoods in zip code 48141: Percentage of zip code residents living and working in this county: 83.2%
Household type by relationship:
Households: 25,777
Male householders: 3,474 (1,565 living alone ), Female householders: 5,971 (1,547 living alone )2,009 spouses (1,987 opposite-sex spouses ), 945 unmarried partners , (924 opposite-sex unmarried partners ), 9,118 children (8,667 natural , 170 adopted , 281 stepchildren ), 1,157 grandchildren , 683 brothers or sisters , 394 parents , 0 foster children , 870 other relatives , 822 non-relatives In group quarters: 238 (-1 institutionalized population )
Size of family households: 2,291 2-persons , 1,422 3-persons , 990 4-persons , 598 5-persons , 272 6-persons , 165 7-or-more-persons
Size of nonfamily households: 3,109 1-person , 455 2-persons , 53 3-persons , 25 4-persons , 4 5-persons
1,630 married couples with children. single-parent households (789 men , 3,788 women ).
91.9% of residents of 48141 zip code speak English at home. of residents speak Spanish at home (72% very well, 21% well, 7% not well ).of residents speak other Indo-European language at home (93% very well, 5% well, 2% not well ).of residents speak Asian or Pacific Island language at home (73% very well, 22% well, 4% not well ).of residents speak other language at home (58% very well, 25% well, 12% not well, 5% not at all ).
Foreign born population: 1,123 (4.4%)
(57.3%
of them are naturalized citizens )
This zip code:
4.4%Whole state:
6.9%
24% Georgia 13% Kuwait 9% Liberia 5% Nepal 5% Sweden 5% England 4% Bhutan 12% African 2% Lebanese 2% American 1% European 1% Irish 1% Polish 1% Nigerian
Year of entry for the foreign-born population
490 2010 or later 335 2000 to 2009 131 1990 to 1999 312 Before 1990
Major facilities with environmental interests located in this zip code:
ADVANCED RESOURCE RECOVERY L.L.C. (27140 PRINCETON AVE in INKSTER, MI)
AIR MINOR (AIRS/AFS) AIR MINOR (AIRS/AFS) - ICIS-, ENFORCEMENT/COMPLIANCE ACTIVITY ENFORCEMENT/COMPLIANCE ACTIVITY (Integrated Compliance Information System) - ICIS-05-1998-0190, FORMAL ENFORCEMENT ACTION, ICIS-05-1995-0204, (Integrated Compliance Information System) - ICIS-05-1998-0190, FORMAL ENFORCEMENT ACTION, ICIS-05-1995-0204, COMPLIANCE ACTIVITY (Tracking inspections of insecticide, fungicide, and rodenticide, and toxic substances) Conditionally Exempt Small Quantity Generators, less than 100 kg/month of hazardous waste (Resource Conservation and Recovery Act (tracking hazardous waste)) - ICIS-, ENFORCEMENT/COMPLIANCE ACTIVITY, HAZARDOUS WASTE BIENNIAL REPORTER (Resource Conservation and Recovery Act (tracking hazardous waste)) - ICIS-, ENFORCEMENT/COMPLIANCE ACTIVITY, TRANSPORTER (Resource Conservation and Recovery Act (tracking hazardous waste)) - ICIS-, ENFORCEMENT/COMPLIANCE ACTIVITY, TSD (Resource Conservation and Recovery Act (tracking hazardous waste)) - ICIS-, ENFORCEMENT/COMPLIANCE ACTIVITY, USED OIL PROGRAM (Resource Conservation and Recovery Act (tracking hazardous waste)) - ICIS-, ENFORCEMENT/COMPLIANCE ACTIVITY, Business SIC classification: SANITARY SERVICES; NONCLASSIFIABLE ESTABLISHMENTSOrganizations: ADVANCED RESOURCE RECOVERY LLC (CONTACT/OPERATOR)
, ENVIRONMENTAL WASTE CONTROL INC (CONTACT/OWNER)
, ARR HOLDINGS LLC (CONTACT/OWNER)
Alternative names: ENVIRONMENTAL WASTE CONTROL, ENVIROMENTAL WASTE CONTROL
GAUDIOR ACADEMY (27100 AVONDALE AVENUE in INKSTER, MI)
(Integrated Compliance Information System) - ICIS-05-2001-0186, FORMAL ENFORCEMENT ACTION COMPLIANCE ACTIVITY (Tracking inspections of insecticide, fungicide, and rodenticide, and toxic substances) (National Center for Education Statistics) - STATE ID-07597 Alternative names: GAUDION ACADEMY
ACADEMY OF INKSTER (28500 AVONDALE in INKSTER, MI)
(National Center for Education Statistics) - STATE ID-08729
BAYLOR WOODSON ELEMENTARY SCHOOL (28865 CARLYSLE STREET in INKSTER, MI)
(National Center for Education Statistics) - STATE ID-00545 Organizations: INKSTER-EDISON PUBLIC SCHOOLS (SCHOOL DISTRICT)
BEACON DAY TREATMENT CENTER (28690 GRANDVIEW in INKSTER, MI)
(National Center for Education Statistics) - STATE ID-07777 Organizations: SOUTHGATE COMMUNITY SCHOOL DISTRICT (SCHOOL DISTRICT)
BLANCHETTE MIDDLE SCHOOL (29193 BEECH STREET in INKSTER, MI)
(National Center for Education Statistics) - STATE ID-01216 Organizations: INKSTER-EDISON PUBLIC SCHOOLS (SCHOOL DISTRICT)
MEEK-MILTON ELEMENTARY SCHOOL (1771 HENRY RUFF ROAD in INKSTER, MI)
(National Center for Education Statistics) - STATE ID-02964 Organizations: INKSTER-EDISON PUBLIC SCHOOLS (SCHOOL DISTRICT)
METROPOLITAN TRANSITIONAL ACADEMY (3414 ASH in INKSTER, MI)
(National Center for Education Statistics) - STATE ID-08965
CHERRY HILL SCHOOL OF PERFORMING ARTS (28500 AVONDALE in INKSTER, MI)
(National Center for Education Statistics) - STATE ID-08730
AGHOG INC (27250 MICHIGAN AVE in INKSTER, MI)
Conditionally Exempt Small Quantity Generators, less than 100 kg/month of hazardous waste (Resource Conservation and Recovery Act (tracking hazardous waste)) TRANSPORTER (Resource Conservation and Recovery Act (tracking hazardous waste)) Business NAICS classification: PRIMARY SMELTING AND REFINING OF NONFERROUS METAL (EXCEPT COPPER AND ALUMINUM).Organizations: PAUL M SVIHRA (CONTACT/OPERATOR)
, PAUL SVIHRA (CONTACT/OWNER)
ALLIANCE FINANCIAL INC (2920 INKSTER RD in INKSTER, MI)
(Resource Conservation and Recovery Act (tracking hazardous waste))
MEENU OIL CO (26743 MICHIGAN AVE in INKSTER, MI)
(Resource Conservation and Recovery Act (tracking hazardous waste)) Organizations: VIJ VINOD (CONTACT/OWNER)
DUSEVOIR METAL PRODUCTS INC (26730 PRINCETON in INKSTER, MI)
Conditionally Exempt Small Quantity Generators, less than 100 kg/month of hazardous waste (Resource Conservation and Recovery Act (tracking hazardous waste)) Organizations: ROBERT DUSEVOIR (CONTACT/OPERATOR)
, ROBERT & CLARE DUSERVOIR (CONTACT/OWNER)
, ROBERT H DUSEVOIR TRUST (CONTACT/OWNER)
Housing units lacking complete plumbing facilities: 4.8%
Housing units lacking complete kitchen facilities: 6.9%
81.3% Utility gas 16.3% Electricity 1.2% No fuel used 0.7% Bottled, tank, or LP gas
Population in 1990: 30,772.
Place of birth for U.S.-born residents:
This state: 20,775Northeast: 358Midwest: 1,172South: 1,954West: 199
60% of the 48141 zip code residents lived in the same house 5 years ago.
Out of people who lived in different houses, 81% lived in this county.
Out of people who lived in different counties, 50% lived in Michigan.
87% of the 48141 zip code residents lived in the same house 1 year ago.
Out of people who lived in different houses, 72% moved from this county.
Out of people who lived in different houses, 14% moved from different county within same state.
Out of people who lived in different houses, 6% moved from different state.
Out of people who lived in different houses, 5% moved from abroad.
Private vs. public school enrollment:
Students in private schools in grades 1 to 8 (elementary and middle school): 153
Students in private schools in grades 9 to 12 (high school): 46
Students in private undergraduate colleges: 61
Occupation by median earnings in the past 12 months ($)
126,517 Architecture and engineering occupations 73,216 Management occupations 56,812 Community and social service occupations 50,407 Legal occupations 49,065 Business and financial operations occupations 47,628 Health diagnosing and treating practitioners and other technical occupations
Companies with federal contracts located in this zip code:
PETERSON & COMPANY (27040 PRINCETON ST in INKSTER, MI; small business) in 10 contracts from 2000 to 2005
Contracts for Vehicular Furniture and Accessories, Vehicular Brake, Steering, Axle, Wheel, and Track Components, Bearings, Plain, Unmounted, Vehicular Cab, Body, and Frame Structural Components, and more by Defense Logistics Agency, ArmySigned by year: 2000: $89,209; 2001: $45,942; 2002: $0; 2003: $70,985; 2004: $199,864; 2005: $151,671; 2006: $0.
Biggest contracts: with Defense Logistics Agency for Vehicular Furniture and Accessories. Signed on 2004-06-14. Completion date: 2005-03-10.
with Army for Vehicular Brake, Steering, Axle, Wheel, and Track Components. Signed on 2000-03-22. Completion date: 2000-08-25.
with Defense Logistics Agency for Vehicular Furniture and Accessories. Signed on 2005-11-05. Completion date: 2006-08-02.
, same as above. Signed on 2001-02-07. Completion date: 2001-07-09.
Top industries in this zip code by the number of employees in 2005:
Health Care and Social Assistance: Residential Mental Retardation Facilities (50-99 employees: 1 establishment, 20-49 employees: 1 establishment, 10-19 employees: 7 establishments, 5-9 employees: 1 establishment, 1-4 employees: 3 establishments)Accommodation and Food Services: Drinking Places (Alcoholic Beverages) (100-249: 1, 20-49: 1, 5-9: 2, 1-4: 3)Health Care and Social Assistance: Child and Youth Services (100-249: 1, 20-49: 1, 1-4: 1)Administrative and Support and Waste Management and Remediation Services: Solid Waste Collection (100-249: 1, 20-49: 1)Health Care and Social Assistance: Nursing Care Facilities (50-99: 2, 10-19: 1)Management of Companies and Enterprises: Corporate, Subsidiary, and Regional Managing Offices (50-99: 1, 10-19: 1)Wholesale Trade: Recyclable Material Merchant Wholesalers (50-99: 1)Other Services (except Public Administration): Religious Organizations (10-19: 1, 5-9: 5, 1-4: 4)
People in group quarters in 2010:
202 people in group homes intended for adults
15 people in group homes for juveniles (non-correctional)
10 people in residential treatment centers for adults
3 people in nursing facilities/skilled-nursing facilities
People in group quarters in 2000:
73 people in nursing homes
50 people in homes for the mentally retarded
50 people in other noninstitutional group quarters
45 people in other workers' dormitories
21 people in homes for the mentally ill
9 people in other nonhousehold living situations
4 people in local jails and other confinement facilities (including police lockups)
Fatal accident statistics in 2013:
Fatal accident count: 3Vehicles involved in fatal accidents: 4Fatal accidents caused by drunken drivers: 0Fatalities: 3Persons involved in fatal accidents: 4Pedestrians involved in fatal accidents: 1
Fatal accident statistics in 2011:
Fatal accident count: 1Vehicles involved in fatal accidents: 2Fatal accidents caused by drunken drivers: 0Fatalities: 1Persons involved in fatal accidents: 3Pedestrians involved in fatal accidents: 0
Home Mortgage Disclosure Act Aggregated Statistics For Year 2009(Based on 16 full tracts) A) FHA, FSA/RHS & VA B) Conventional C) Refinancings D) Home Improvement Loans E) Loans on Dwellings For 5+ Families F) Non-occupant Loans on G) Loans On Manufactured Number Average Value Number Average Value Number Average Value Number Average Value Number Average Value Number Average Value Number Average Value
LOANS ORIGINATED 38 $57,574 12 $36,249 88 $94,490 32 $9,177 2 $2,591,000 8 $99,681 0 $0 APPLICATIONS APPROVED, NOT ACCEPTED 18 $82,127 4 $34,425 20 $71,304 4 $2,500 0 $0 0 $0 0 $0 APPLICATIONS DENIED 30 $63,477 32 $45,859 186 $70,782 124 $16,478 0 $0 30 $39,499 6 $30,307 APPLICATIONS WITHDRAWN 22 $51,116 4 $82,808 38 $84,297 6 $13,995 0 $0 4 $61,255 0 $0 FILES CLOSED FOR INCOMPLETENESS 4 $59,408 0 $0 6 $98,980 2 $83,865 0 $0 2 $119,975 0 $0
Aggregated Statistics For Year 2008(Based on 16 full tracts) A) FHA, FSA/RHS & VA B) Conventional C) Refinancings D) Home Improvement Loans F) Non-occupant Loans on G) Loans On Manufactured Number Average Value Number Average Value Number Average Value Number Average Value Number Average Value Number Average Value
LOANS ORIGINATED 72 $67,070 50 $57,175 214 $73,988 40 $12,685 94 $52,416 2 $14,980 APPLICATIONS APPROVED, NOT ACCEPTED 6 $63,933 42 $68,650 58 $75,325 6 $56,827 32 $66,407 6 $52,990 APPLICATIONS DENIED 42 $69,206 138 $60,694 551 $84,257 158 $29,131 146 $55,248 10 $29,578 APPLICATIONS WITHDRAWN 18 $92,043 24 $72,086 148 $83,981 8 $60,449 30 $56,279 0 $0 FILES CLOSED FOR INCOMPLETENESS 2 $46,925 12 $66,419 40 $74,739 10 $30,963 22 $54,410 0 $0
Aggregated Statistics For Year 2007(Based on 16 full tracts) A) FHA, FSA/RHS & VA B) Conventional C) Refinancings D) Home Improvement Loans F) Non-occupant Loans on G) Loans On Manufactured Number Average Value Number Average Value Number Average Value Number Average Value Number Average Value Number Average Value
LOANS ORIGINATED 30 $100,420 359 $73,320 655 $75,758 100 $31,974 282 $61,143 4 $15,968 APPLICATIONS APPROVED, NOT ACCEPTED 6 $87,708 142 $74,125 234 $82,580 26 $35,890 78 $57,655 10 $50,075 APPLICATIONS DENIED 18 $98,043 381 $83,035 1,254 $89,514 306 $41,313 276 $80,779 12 $62,067 APPLICATIONS WITHDRAWN 4 $98,492 64 $81,769 290 $89,136 34 $65,338 38 $70,278 0 $0 FILES CLOSED FOR INCOMPLETENESS 4 $101,740 46 $86,332 126 $96,601 8 $91,652 22 $68,381 0 $0
Aggregated Statistics For Year 2006(Based on 16 full tracts) A) FHA, FSA/RHS & VA B) Conventional C) Refinancings D) Home Improvement Loans E) Loans on Dwellings For 5+ Families F) Non-occupant Loans on G) Loans On Manufactured Number Average Value Number Average Value Number Average Value Number Average Value Number Average Value Number Average Value Number Average Value
LOANS ORIGINATED 42 $98,755 897 $69,820 1,268 $77,811 176 $38,024 2 $840,000 485 $62,936 0 $0 APPLICATIONS APPROVED, NOT ACCEPTED 4 $78,380 208 $74,117 413 $86,660 36 $43,076 0 $0 86 $72,701 0 $0 APPLICATIONS DENIED 10 $109,251 651 $72,553 1,807 $87,767 393 $42,480 0 $0 370 $65,784 10 $68,752 APPLICATIONS WITHDRAWN 8 $79,852 258 $75,158 773 $97,807 46 $80,370 0 $0 106 $66,038 0 $0 FILES CLOSED FOR INCOMPLETENESS 2 $119,495 52 $93,406 369 $95,951 6 $30,657 0 $0 28 $63,016 0 $0
Aggregated Statistics For Year 2005(Based on 16 full tracts) A) FHA, FSA/RHS & VA B) Conventional C) Refinancings D) Home Improvement Loans E) Loans on Dwellings For 5+ Families F) Non-occupant Loans on G) Loans On Manufactured Number Average Value Number Average Value Number Average Value Number Average Value Number Average Value Number Average Value Number Average Value
LOANS ORIGINATED 66 $99,578 948 $73,216 1,559 $79,316 166 $56,601 2 $900,000 469 $67,384 2 $119,570 APPLICATIONS APPROVED, NOT ACCEPTED 12 $116,541 274 $74,557 431 $82,457 32 $53,612 0 $0 118 $68,359 10 $57,934 APPLICATIONS DENIED 28 $92,277 623 $69,358 2,147 $85,110 343 $33,898 0 $0 326 $63,916 20 $69,934 APPLICATIONS WITHDRAWN 16 $98,610 240 $100,151 1,018 $91,519 118 $118,376 0 $0 114 $71,998 2 $104,855 FILES CLOSED FOR INCOMPLETENESS 2 $104,560 76 $62,039 443 $93,268 4 $23,480 0 $0 32 $60,308 0 $0
Aggregated Statistics For Year 2004(Based on 16 full tracts) A) FHA, FSA/RHS & VA B) Conventional C) Refinancings D) Home Improvement Loans E) Loans on Dwellings For 5+ Families F) Non-occupant Loans on G) Loans On Manufactured Number Average Value Number Average Value Number Average Value Number Average Value Number Average Value Number Average Value Number Average Value
LOANS ORIGINATED 166 $97,489 651 $74,312 1,727 $78,044 228 $41,814 2 $1,296,620 391 $63,929 6 $104,903 APPLICATIONS APPROVED, NOT ACCEPTED 14 $104,575 244 $70,886 551 $79,333 30 $28,689 0 $0 140 $65,922 2 $78,000 APPLICATIONS DENIED 30 $113,928 370 $75,298 1,688 $80,299 234 $30,338 0 $0 246 $63,820 8 $92,121 APPLICATIONS WITHDRAWN 18 $89,289 104 $73,917 959 $81,881 28 $53,681 0 $0 80 $70,325 0 $0 FILES CLOSED FOR INCOMPLETENESS 12 $78,098 36 $85,581 180 $87,271 6 $30,622 0 $0 18 $64,245 2 $84,880
Aggregated Statistics For Year 2003(Based on 16 full tracts) A) FHA, FSA/RHS & VA B) Conventional C) Refinancings D) Home Improvement Loans E) Loans on Dwellings For 5+ Families F) Non-occupant Loans on Number Average Value Number Average Value Number Average Value Number Average Value Number Average Value Number Average Value
LOANS ORIGINATED 218 $95,376 433 $76,016 2,109 $72,961 110 $14,282 4 $113,960 362 $62,301 APPLICATIONS APPROVED, NOT ACCEPTED 8 $84,692 120 $73,633 561 $74,165 44 $19,238 2 $224,640 96 $66,693 APPLICATIONS DENIED 36 $87,884 234 $79,764 1,604 $76,197 336 $13,212 0 $0 184 $57,338 APPLICATIONS WITHDRAWN 40 $82,053 76 $86,846 751 $80,575 22 $39,783 0 $0 122 $65,096 FILES CLOSED FOR INCOMPLETENESS 8 $86,648 26 $71,481 146 $79,577 0 $0 0 $0 20 $65,316
Aggregated Statistics For Year 2002(Based on 16 full tracts) A) FHA, FSA/RHS & VA B) Conventional C) Refinancings D) Home Improvement Loans E) Loans on Dwellings For 5+ Families F) Non-occupant Loans on Number Average Value Number Average Value Number Average Value Number Average Value Number Average Value Number Average Value
LOANS ORIGINATED 194 $86,619 312 $65,926 1,623 $68,795 194 $14,378 2 $800,000 322 $54,477 APPLICATIONS APPROVED, NOT ACCEPTED 10 $79,213 98 $67,094 459 $67,333 64 $12,858 0 $0 46 $52,681 APPLICATIONS DENIED 40 $91,323 176 $66,448 1,292 $69,541 361 $10,052 0 $0 126 $53,970 APPLICATIONS WITHDRAWN 30 $94,329 66 $78,615 555 $70,594 16 $29,353 0 $0 50 $62,475 FILES CLOSED FOR INCOMPLETENESS 10 $101,856 40 $82,506 170 $79,083 2 $3,000 0 $0 16 $66,209
Aggregated Statistics For Year 2001(Based on 16 full tracts) A) FHA, FSA/RHS & VA B) Conventional C) Refinancings D) Home Improvement Loans E) Loans on Dwellings For 5+ Families F) Non-occupant Loans on Number Average Value Number Average Value Number Average Value Number Average Value Number Average Value Number Average Value
LOANS ORIGINATED 220 $85,265 242 $66,295 1,570 $64,624 202 $12,243 2 $1,115,295 218 $50,308 APPLICATIONS APPROVED, NOT ACCEPTED 18 $77,069 64 $50,274 375 $59,176 94 $19,608 0 $0 62 $43,369 APPLICATIONS DENIED 38 $79,551 192 $58,998 1,554 $62,664 449 $10,679 0 $0 140 $42,392 APPLICATIONS WITHDRAWN 24 $89,982 80 $64,662 619 $62,338 28 $28,017 2 $49,970 66 $43,796 FILES CLOSED FOR INCOMPLETENESS 8 $56,904 6 $119,525 218 $73,103 6 $26,598 0 $0 14 $51,667
Aggregated Statistics For Year 2000(Based on 16 full tracts) A) FHA, FSA/RHS & VA B) Conventional C) Refinancings D) Home Improvement Loans E) Loans on Dwellings For 5+ Families F) Non-occupant Loans on Number Average Value Number Average Value Number Average Value Number Average Value Number Average Value Number Average Value
LOANS ORIGINATED 224 $75,501 290 $71,109 1,035 $55,753 274 $9,481 0 $0 162 $44,216 APPLICATIONS APPROVED, NOT ACCEPTED 14 $73,883 50 $70,239 369 $56,056 122 $21,309 0 $0 40 $45,258 APPLICATIONS DENIED 20 $66,510 182 $57,878 1,026 $53,525 579 $12,575 2 $17,990 84 $41,066 APPLICATIONS WITHDRAWN 40 $69,002 86 $63,913 517 $51,452 34 $28,325 0 $0 42 $48,793 FILES CLOSED FOR INCOMPLETENESS 4 $88,435 18 $70,581 218 $57,803 0 $0 0 $0 12 $44,137
Aggregated Statistics For Year 1999(Based on 10 full tracts) A) FHA, FSA/RHS & VA B) Conventional C) Refinancings D) Home Improvement Loans F) Non-occupant Loans on Number Average Value Number Average Value Number Average Value Number Average Value Number Average Value
LOANS ORIGINATED 162 $72,857 144 $50,994 734 $51,078 161 $12,388 105 $39,287 APPLICATIONS APPROVED, NOT ACCEPTED 8 $66,208 37 $60,529 281 $50,939 73 $14,797 24 $29,677 APPLICATIONS DENIED 21 $71,863 85 $51,050 572 $60,195 290 $11,102 46 $33,910 APPLICATIONS WITHDRAWN 17 $75,675 49 $61,087 415 $49,284 25 $25,652 16 $40,964 FILES CLOSED FOR INCOMPLETENESS 2 $83,355 6 $65,380 131 $54,115 3 $35,253 5 $44,300
Private Mortgage Insurance Companies Aggregated Statistics For Year 2009(Based on 4 full tracts) A) Conventional Number Average Value
LOANS ORIGINATED 4 $36,352 APPLICATIONS APPROVED, NOT ACCEPTED 0 $0 APPLICATIONS DENIED 2 $49,790 APPLICATIONS WITHDRAWN 0 $0 FILES CLOSED FOR INCOMPLETENESS 0 $0
Aggregated Statistics For Year 2008(Based on 16 full tracts) A) Conventional B) Refinancings C) Non-occupant Loans on Number Average Value Number Average Value Number Average Value
LOANS ORIGINATED 36 $59,729 22 $75,344 18 $46,462 APPLICATIONS APPROVED, NOT ACCEPTED 76 $86,239 36 $99,415 28 $68,578 APPLICATIONS DENIED 14 $71,319 4 $76,375 12 $68,738 APPLICATIONS WITHDRAWN 10 $65,105 0 $0 6 $48,593 FILES CLOSED FOR INCOMPLETENESS 6 $92,618 0 $0 6 $92,618
Aggregated Statistics For Year 2007(Based on 16 full tracts) A) Conventional B) Refinancings C) Non-occupant Loans on Number Average Value Number Average Value Number Average Value
LOANS ORIGINATED 188 $78,213 66 $93,477 70 $56,187 APPLICATIONS APPROVED, NOT ACCEPTED 32 $87,371 38 $105,389 4 $56,440 APPLICATIONS DENIED 6 $57,273 8 $110,798 4 $41,938 APPLICATIONS WITHDRAWN 20 $131,352 8 $93,766 4 $118,390 FILES CLOSED FOR INCOMPLETENESS 2 $80,985 0 $0 0 $0
Aggregated Statistics For Year 2006(Based on 16 full tracts) A) Conventional B) Refinancings C) Non-occupant Loans on Number Average Value Number Average Value Number Average Value
LOANS ORIGINATED 98 $79,867 56 $97,642 38 $61,474 APPLICATIONS APPROVED, NOT ACCEPTED 8 $94,120 30 $108,740 0 $0 APPLICATIONS DENIED 0 $0 8 $59,916 8 $59,916 APPLICATIONS WITHDRAWN 4 $93,728 6 $145,923 0 $0 FILES CLOSED FOR INCOMPLETENESS 0 $0 0 $0 0 $0
Aggregated Statistics For Year 2005(Based on 16 full tracts) A) Conventional B) Refinancings C) Non-occupant Loans on Number Average Value Number Average Value Number Average Value
LOANS ORIGINATED 92 $98,368 100 $98,862 34 $67,629 APPLICATIONS APPROVED, NOT ACCEPTED 40 $91,279 28 $101,112 16 $56,662 APPLICATIONS DENIED 8 $107,838 4 $97,935 6 $97,525 APPLICATIONS WITHDRAWN 8 $72,941 8 $81,855 6 $63,975 FILES CLOSED FOR INCOMPLETENESS 4 $52,468 4 $130,492 2 $44,935
Aggregated Statistics For Year 2004(Based on 16 full tracts) A) Conventional B) Refinancings C) Non-occupant Loans on Number Average Value Number Average Value Number Average Value
LOANS ORIGINATED 160 $79,925 90 $96,567 52 $61,072 APPLICATIONS APPROVED, NOT ACCEPTED 52 $103,798 44 $93,163 18 $68,065 APPLICATIONS DENIED 2 $75,725 0 $0 0 $0 APPLICATIONS WITHDRAWN 12 $103,766 12 $85,722 2 $73,985 FILES CLOSED FOR INCOMPLETENESS 2 $111,530 0 $0 0 $0
Aggregated Statistics For Year 2003(Based on 16 full tracts) A) Conventional B) Refinancings C) Non-occupant Loans on Number Average Value Number Average Value Number Average Value
LOANS ORIGINATED 158 $81,564 132 $92,836 54 $66,798 APPLICATIONS APPROVED, NOT ACCEPTED 26 $77,453 86 $91,956 6 $65,545 APPLICATIONS DENIED 4 $85,910 8 $114,086 2 $76,955 APPLICATIONS WITHDRAWN 14 $72,353 16 $88,721 4 $63,388 FILES CLOSED FOR INCOMPLETENESS 0 $0 0 $0 0 $0
Aggregated Statistics For Year 2002(Based on 16 full tracts) A) Conventional B) Refinancings C) Non-occupant Loans on Number Average Value Number Average Value Number Average Value
LOANS ORIGINATED 116 $70,562 138 $79,735 54 $55,533 APPLICATIONS APPROVED, NOT ACCEPTED 18 $69,226 50 $91,374 6 $72,660 APPLICATIONS DENIED 6 $83,075 10 $59,746 8 $47,726 APPLICATIONS WITHDRAWN 16 $55,878 22 $82,490 10 $48,501 FILES CLOSED FOR INCOMPLETENESS 0 $0 4 $110,702 0 $0
Aggregated Statistics For Year 2001(Based on 16 full tracts) A) Conventional B) Refinancings C) Non-occupant Loans on Number Average Value Number Average Value Number Average Value
LOANS ORIGINATED 114 $70,963 140 $84,236 40 $58,568 APPLICATIONS APPROVED, NOT ACCEPTED 18 $81,771 38 $83,312 8 $48,384 APPLICATIONS DENIED 4 $61,372 10 $84,434 4 $73,888 APPLICATIONS WITHDRAWN 4 $37,405 6 $70,908 2 $35,950 FILES CLOSED FOR INCOMPLETENESS 0 $0 0 $0 0 $0
Aggregated Statistics For Year 2000(Based on 16 full tracts) A) Conventional B) Refinancings C) Non-occupant Loans on Number Average Value Number Average Value Number Average Value
LOANS ORIGINATED 128 $70,363 106 $64,037 34 $49,416 APPLICATIONS APPROVED, NOT ACCEPTED 18 $58,505 16 $71,642 6 $44,543 APPLICATIONS DENIED 10 $60,943 2 $66,985 2 $41,000 APPLICATIONS WITHDRAWN 6 $43,900 2 $89,855 0 $0 FILES CLOSED FOR INCOMPLETENESS 0 $0 0 $0 0 $0
Aggregated Statistics For Year 1999(Based on 10 full tracts) A) Conventional B) Refinancings C) Non-occupant Loans on Number Average Value Number Average Value Number Average Value
LOANS ORIGINATED 39 $52,946 39 $56,334 16 $33,717 APPLICATIONS APPROVED, NOT ACCEPTED 7 $60,466 4 $60,248 2 $32,950 APPLICATIONS DENIED 1 $89,990 3 $65,243 0 $0 APPLICATIONS WITHDRAWN 1 $38,910 1 $62,190 0 $0 FILES CLOSED FOR INCOMPLETENESS 0 $0 0 $0 0 $0
2002 - 2018 National Fire Incident Reporting System (NFIRS) incidents See full 2006 National Fire Incident Reporting System statistics for zip code 48141, Michigan
Most common first names in zip code 48141 among deceased individuals Name Count Lived (average)
John 241 72.5 years James 236 69.3 years Mary 211 77.1 years William 184 70.2 years Robert 153 67.2 years Willie 128 67.8 years Charles 123 68.6 years George 108 71.3 years Joseph 101 70.8 years Edward 83 69.7 years
Most common last names in zip code 48141 among deceased individuals Last name Count Lived (average)
Johnson 138 69.8 years Williams 138 66.8 years Smith 115 70.5 years Jones 95 69.6 years Davis 66 67.7 years Robinson 62 68.1 years Jackson 60 67.6 years Brown 57 72.4 years Thomas 56 71.7 years Taylor 46 70.9 years
Businesses in zip code 48141
Name Count Name Count
AutoZone 1 H&R Block 1 Dairy Queen 1 Little Caesars Pizza 1 Foot Locker 1 U-Haul 2


 Nearest zip codes: 48135, 48186, 48127, 48125, 48128, 48124.
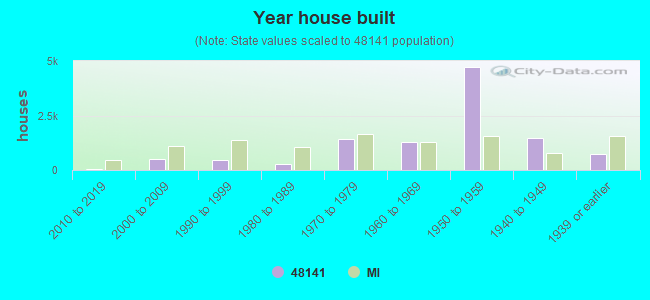

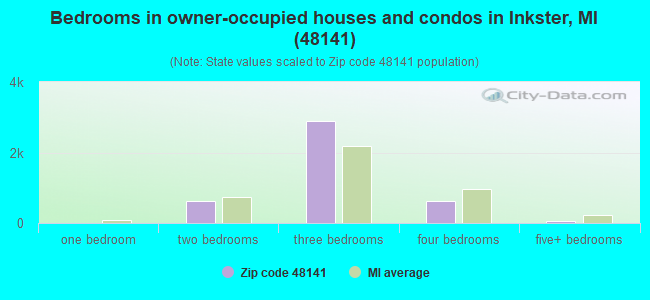
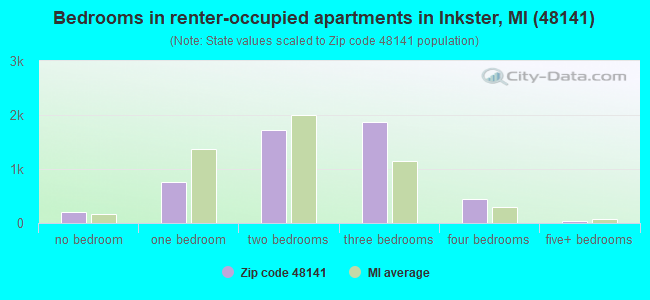


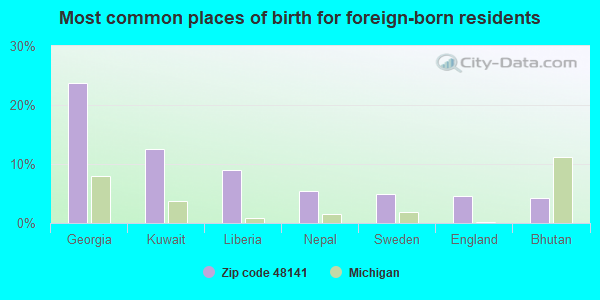
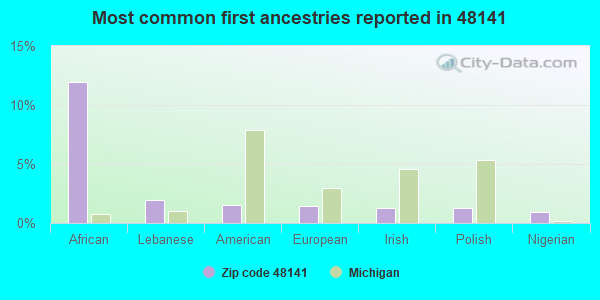
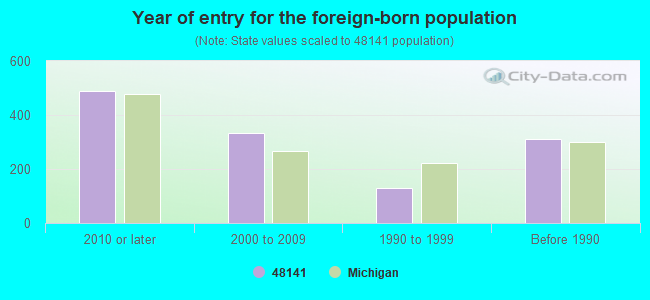


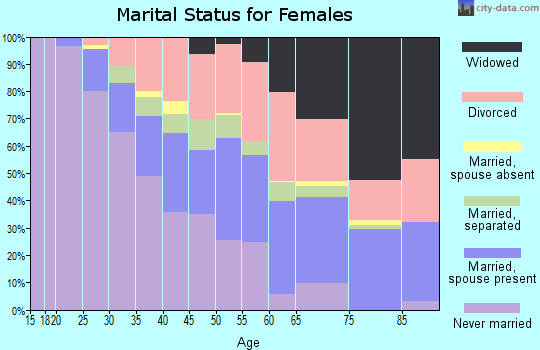
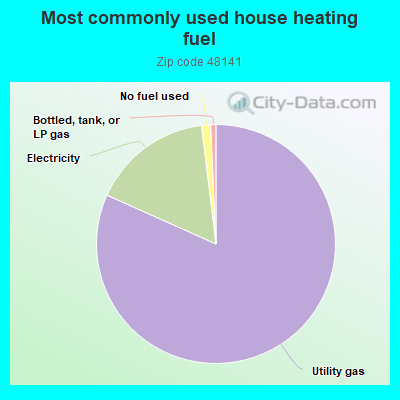

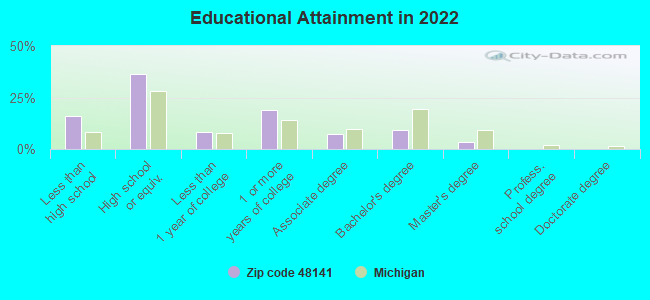

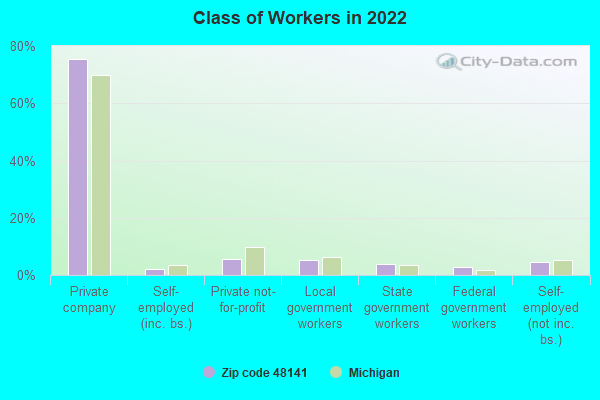
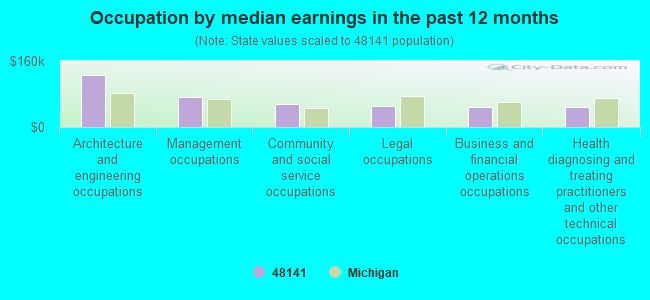
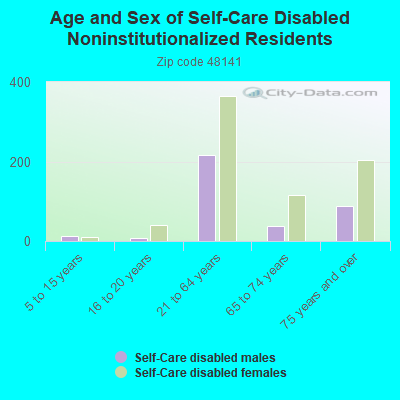
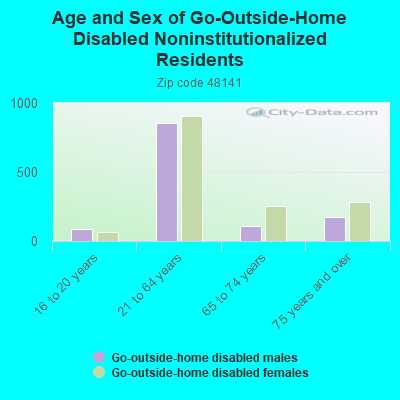
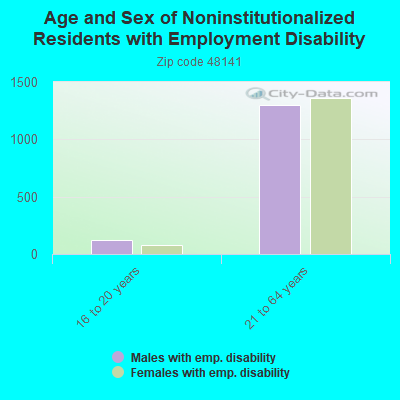
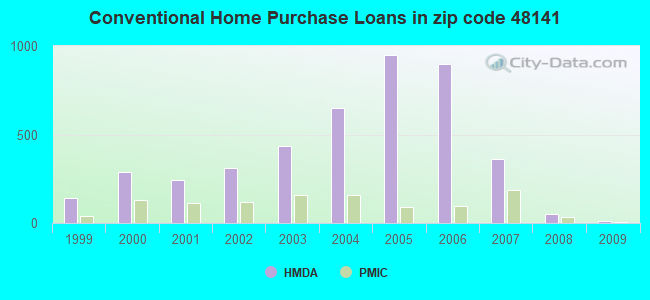

 Based on the data from the years 2002 - 2018 the average number of fires per year is 124. The highest number of reported fire incidents - 234 took place in 2006, and the least - 24 in 2014. The data has a declining trend.
 When looking into fire subcategories, the most incidents belonged to: Structure Fires (61.8%), and Outside Fires (16.8%).