Estimated zip code population in 2022: 21,181
Zip code population in 2010: 27,712
Zip code population in 2000: 43,996
Houses and condos: 11,626
Renter-occupied apartments: 3,123
% of renters here:
41%State:
27%
March 2022 cost of living index in zip code 48213: 92.8
(less than average, U.S. average is 100)
Land area: 6.5
sq. mi.
Water area: 0.0
sq. mi.
Population density: 3,242 people per square mile (average).
OSM Map
General Map
Google Map
MSN Map
OSM Map
General Map
Google Map
MSN Map
OSM Map
General Map
Google Map
MSN Map
OSM Map
General Map
Google Map
MSN Map
Please wait while loading the map...
Real estate property taxes paid for housing units in 2022:
This zip code:
2.0% ($1,001)Michigan:
1.2% ($2,746)
Median real estate property taxes paid for housing units with mortgages in 2022: $1,225 (2.0%)
Median real estate property taxes paid for housing units with no mortgage in 2022: $964 (2.0%)
Profiles of local businesses
Business Search - 14 Million verified businesses
Males: 10,076 Females: 11,105
For population 25 years and over in 48213:
High school or higher: 79.1%Bachelor's degree or higher: 8.4%Graduate or professional degree: 2.8%Unemployed: 13.7%Mean travel time to work (commute): 27.5 minutes
For population 15 years and over in 48213:
Never married: 60.3%Now married: 20.4%Separated: 2.9%Widowed: 6.7%Divorced: 9.7%
Zip code 48213 compared to state average:
Median household income below state average. Median house value significantly below state average. Unemployed percentage significantly above state average. Black race population percentage significantly above state average. Hispanic race population percentage below state average. Foreign-born population percentage significantly below state average. Renting percentage above state average. Length of stay since moving in significantly above state average. House age above state average. Percentage of population with a bachelor's degree or higher significantly below state average. 19,790 93.4% Black 773 3.7% White 407 1.9% Hispanic or Latino 152 0.7% Two or more races 24 0.1% Some other race 20 0.09% Asian 12 0.06% American Indian
Data:
Median household income ($)
Median household income (% change since 2000)
Household income diversity
Ratio of average income to average house value (%)
Ratio of average income to average rent
Median household income ($) - White
Median household income ($) - Black or African American
Median household income ($) - Asian
Median household income ($) - Hispanic or Latino
Median household income ($) - American Indian and Alaska Native
Median household income ($) - Multirace
Median household income ($) - Other Race
Median household income for houses/condos with a mortgage ($)
Median household income for apartments without a mortgage ($)
Races - White alone (%)
Races - White alone (% change since 2000)
Races - Black alone (%)
Races - Black alone (% change since 2000)
Races - American Indian alone (%)
Races - American Indian alone (% change since 2000)
Races - Asian alone (%)
Races - Asian alone (% change since 2000)
Races - Hispanic (%)
Races - Hispanic (% change since 2000)
Races - Native Hawaiian and Other Pacific Islander alone (%)
Races - Native Hawaiian and Other Pacific Islander alone (% change since 2000)
Races - Two or more races (%)
Races - Two or more races (% change since 2000)
Races - Other race alone (%)
Races - Other race alone (% change since 2000)
Racial diversity
Unemployment (%)
Unemployment (% change since 2000)
Unemployment (%) - White
Unemployment (%) - Black or African American
Unemployment (%) - Asian
Unemployment (%) - Hispanic or Latino
Unemployment (%) - American Indian and Alaska Native
Unemployment (%) - Multirace
Unemployment (%) - Other Race
Population density (people per square mile)
Population - Males (%)
Population - Females (%)
Population - Males (%) - White
Population - Males (%) - Black or African American
Population - Males (%) - Asian
Population - Males (%) - Hispanic or Latino
Population - Males (%) - American Indian and Alaska Native
Population - Males (%) - Multirace
Population - Males (%) - Other Race
Population - Females (%) - White
Population - Females (%) - Black or African American
Population - Females (%) - Asian
Population - Females (%) - Hispanic or Latino
Population - Females (%) - American Indian and Alaska Native
Population - Females (%) - Multirace
Population - Females (%) - Other Race
Coronavirus confirmed cases (Apr 26, 2024)
Deaths caused by coronavirus (Apr 26, 2024)
Coronavirus confirmed cases (per 100k population) (Apr 26, 2024)
Deaths caused by coronavirus (per 100k population) (Apr 26, 2024)
Daily increase in number of cases (Apr 26, 2024)
Weekly increase in number of cases (Apr 26, 2024)
Cases doubled (in days) (Apr 26, 2024)
Hospitalized patients (Apr 18, 2022)
Negative test results (Apr 18, 2022)
Total test results (Apr 18, 2022)
COVID Vaccine doses distributed (per 100k population) (Sep 19, 2023)
COVID Vaccine doses administered (per 100k population) (Sep 19, 2023)
COVID Vaccine doses distributed (Sep 19, 2023)
COVID Vaccine doses administered (Sep 19, 2023)
Likely homosexual households (%)
Likely homosexual households (% change since 2000)
Likely homosexual households - Lesbian couples (%)
Likely homosexual households - Lesbian couples (% change since 2000)
Likely homosexual households - Gay men (%)
Likely homosexual households - Gay men (% change since 2000)
Cost of living index
Median gross rent ($)
Median contract rent ($)
Median monthly housing costs ($)
Median house or condo value ($)
Median house or condo value ($ change since 2000)
Mean house or condo value by units in structure - 1, detached ($)
Mean house or condo value by units in structure - 1, attached ($)
Mean house or condo value by units in structure - 2 ($)
Mean house or condo value by units in structure by units in structure - 3 or 4 ($)
Mean house or condo value by units in structure - 5 or more ($)
Mean house or condo value by units in structure - Boat, RV, van, etc. ($)
Mean house or condo value by units in structure - Mobile home ($)
Median house or condo value ($) - White
Median house or condo value ($) - Black or African American
Median house or condo value ($) - Asian
Median house or condo value ($) - Hispanic or Latino
Median house or condo value ($) - American Indian and Alaska Native
Median house or condo value ($) - Multirace
Median house or condo value ($) - Other Race
Median resident age
Resident age diversity
Median resident age - Males
Median resident age - Females
Median resident age - White
Median resident age - Black or African American
Median resident age - Asian
Median resident age - Hispanic or Latino
Median resident age - American Indian and Alaska Native
Median resident age - Multirace
Median resident age - Other Race
Median resident age - Males - White
Median resident age - Males - Black or African American
Median resident age - Males - Asian
Median resident age - Males - Hispanic or Latino
Median resident age - Males - American Indian and Alaska Native
Median resident age - Males - Multirace
Median resident age - Males - Other Race
Median resident age - Females - White
Median resident age - Females - Black or African American
Median resident age - Females - Asian
Median resident age - Females - Hispanic or Latino
Median resident age - Females - American Indian and Alaska Native
Median resident age - Females - Multirace
Median resident age - Females - Other Race
Commute - mean travel time to work (minutes)
Travel time to work - Less than 5 minutes (%)
Travel time to work - Less than 5 minutes (% change since 2000)
Travel time to work - 5 to 9 minutes (%)
Travel time to work - 5 to 9 minutes (% change since 2000)
Travel time to work - 10 to 19 minutes (%)
Travel time to work - 10 to 19 minutes (% change since 2000)
Travel time to work - 20 to 29 minutes (%)
Travel time to work - 20 to 29 minutes (% change since 2000)
Travel time to work - 30 to 39 minutes (%)
Travel time to work - 30 to 39 minutes (% change since 2000)
Travel time to work - 40 to 59 minutes (%)
Travel time to work - 40 to 59 minutes (% change since 2000)
Travel time to work - 60 to 89 minutes (%)
Travel time to work - 60 to 89 minutes (% change since 2000)
Travel time to work - 90 or more minutes (%)
Travel time to work - 90 or more minutes (% change since 2000)
Marital status - Never married (%)
Marital status - Now married (%)
Marital status - Separated (%)
Marital status - Widowed (%)
Marital status - Divorced (%)
Median family income ($)
Median family income (% change since 2000)
Median non-family income ($)
Median non-family income (% change since 2000)
Median per capita income ($)
Median per capita income (% change since 2000)
Median family income ($) - White
Median family income ($) - Black or African American
Median family income ($) - Asian
Median family income ($) - Hispanic or Latino
Median family income ($) - American Indian and Alaska Native
Median family income ($) - Multirace
Median family income ($) - Other Race
Median year house/condo built
Median year apartment built
Year house built - Built 2005 or later (%)
Year house built - Built 2000 to 2004 (%)
Year house built - Built 1990 to 1999 (%)
Year house built - Built 1980 to 1989 (%)
Year house built - Built 1970 to 1979 (%)
Year house built - Built 1960 to 1969 (%)
Year house built - Built 1950 to 1959 (%)
Year house built - Built 1940 to 1949 (%)
Year house built - Built 1939 or earlier (%)
Average household size
Household density (households per square mile)
Average household size - White
Average household size - Black or African American
Average household size - Asian
Average household size - Hispanic or Latino
Average household size - American Indian and Alaska Native
Average household size - Multirace
Average household size - Other Race
Occupied housing units (%)
Vacant housing units (%)
Owner occupied housing units (%)
Renter occupied housing units (%)
Vacancy status - For rent (%)
Vacancy status - For sale only (%)
Vacancy status - Rented or sold, not occupied (%)
Vacancy status - For seasonal, recreational, or occasional use (%)
Vacancy status - For migrant workers (%)
Vacancy status - Other vacant (%)
Residents with income below the poverty level (%)
Residents with income below 50% of the poverty level (%)
Children below poverty level (%)
Poor families by family type - Married-couple family (%)
Poor families by family type - Male, no wife present (%)
Poor families by family type - Female, no husband present (%)
Poverty status for native-born residents (%)
Poverty status for foreign-born residents (%)
Poverty among high school graduates not in families (%)
Poverty among people who did not graduate high school not in families (%)
Residents with income below the poverty level (%) - White
Residents with income below the poverty level (%) - Black or African American
Residents with income below the poverty level (%) - Asian
Residents with income below the poverty level (%) - Hispanic or Latino
Residents with income below the poverty level (%) - American Indian and Alaska Native
Residents with income below the poverty level (%) - Multirace
Residents with income below the poverty level (%) - Other Race
Air pollution - Air Quality Index (AQI)
Air pollution - CO
Air pollution - NO2
Air pollution - SO2
Air pollution - Ozone
Air pollution - PM10
Air pollution - PM25
Air pollution - Pb
Crime - Murders per 100,000 population
Crime - Rapes per 100,000 population
Crime - Robberies per 100,000 population
Crime - Assaults per 100,000 population
Crime - Burglaries per 100,000 population
Crime - Thefts per 100,000 population
Crime - Auto thefts per 100,000 population
Crime - Arson per 100,000 population
Crime - City-data.com crime index
Crime - Violent crime index
Crime - Property crime index
Crime - Murders per 100,000 population (5 year average)
Crime - Rapes per 100,000 population (5 year average)
Crime - Robberies per 100,000 population (5 year average)
Crime - Assaults per 100,000 population (5 year average)
Crime - Burglaries per 100,000 population (5 year average)
Crime - Thefts per 100,000 population (5 year average)
Crime - Auto thefts per 100,000 population (5 year average)
Crime - Arson per 100,000 population (5 year average)
Crime - City-data.com crime index (5 year average)
Crime - Violent crime index (5 year average)
Crime - Property crime index (5 year average)
1996 Presidential Elections Results (%) - Democratic Party (Clinton)
1996 Presidential Elections Results (%) - Republican Party (Dole)
1996 Presidential Elections Results (%) - Other
2000 Presidential Elections Results (%) - Democratic Party (Gore)
2000 Presidential Elections Results (%) - Republican Party (Bush)
2000 Presidential Elections Results (%) - Other
2004 Presidential Elections Results (%) - Democratic Party (Kerry)
2004 Presidential Elections Results (%) - Republican Party (Bush)
2004 Presidential Elections Results (%) - Other
2008 Presidential Elections Results (%) - Democratic Party (Obama)
2008 Presidential Elections Results (%) - Republican Party (McCain)
2008 Presidential Elections Results (%) - Other
2012 Presidential Elections Results (%) - Democratic Party (Obama)
2012 Presidential Elections Results (%) - Republican Party (Romney)
2012 Presidential Elections Results (%) - Other
2016 Presidential Elections Results (%) - Democratic Party (Clinton)
2016 Presidential Elections Results (%) - Republican Party (Trump)
2016 Presidential Elections Results (%) - Other
2020 Presidential Elections Results (%) - Democratic Party (Biden)
2020 Presidential Elections Results (%) - Republican Party (Trump)
2020 Presidential Elections Results (%) - Other
Ancestries Reported - Arab (%)
Ancestries Reported - Czech (%)
Ancestries Reported - Danish (%)
Ancestries Reported - Dutch (%)
Ancestries Reported - English (%)
Ancestries Reported - French (%)
Ancestries Reported - French Canadian (%)
Ancestries Reported - German (%)
Ancestries Reported - Greek (%)
Ancestries Reported - Hungarian (%)
Ancestries Reported - Irish (%)
Ancestries Reported - Italian (%)
Ancestries Reported - Lithuanian (%)
Ancestries Reported - Norwegian (%)
Ancestries Reported - Polish (%)
Ancestries Reported - Portuguese (%)
Ancestries Reported - Russian (%)
Ancestries Reported - Scotch-Irish (%)
Ancestries Reported - Scottish (%)
Ancestries Reported - Slovak (%)
Ancestries Reported - Subsaharan African (%)
Ancestries Reported - Swedish (%)
Ancestries Reported - Swiss (%)
Ancestries Reported - Ukrainian (%)
Ancestries Reported - United States (%)
Ancestries Reported - Welsh (%)
Ancestries Reported - West Indian (%)
Ancestries Reported - Other (%)
Educational Attainment - No schooling completed (%)
Educational Attainment - Less than high school (%)
Educational Attainment - High school or equivalent (%)
Educational Attainment - Less than 1 year of college (%)
Educational Attainment - 1 or more years of college (%)
Educational Attainment - Associate degree (%)
Educational Attainment - Bachelor's degree (%)
Educational Attainment - Master's degree (%)
Educational Attainment - Professional school degree (%)
Educational Attainment - Doctorate degree (%)
School Enrollment - Nursery, preschool (%)
School Enrollment - Kindergarten (%)
School Enrollment - Grade 1 to 4 (%)
School Enrollment - Grade 5 to 8 (%)
School Enrollment - Grade 9 to 12 (%)
School Enrollment - College undergrad (%)
School Enrollment - Graduate or professional (%)
School Enrollment - Not enrolled in school (%)
School enrollment - Public schools (%)
School enrollment - Private schools (%)
School enrollment - Not enrolled (%)
Median number of rooms in houses and condos
Median number of rooms in apartments
Housing units lacking complete plumbing facilities (%)
Housing units lacking complete kitchen facilities (%)
Density of houses
Urban houses (%)
Rural houses (%)
Households with people 60 years and over (%)
Households with people 65 years and over (%)
Households with people 75 years and over (%)
Households with one or more nonrelatives (%)
Households with no nonrelatives (%)
Population in households (%)
Family households (%)
Nonfamily households (%)
Population in families (%)
Family households with own children (%)
Median number of bedrooms in owner occupied houses
Mean number of bedrooms in owner occupied houses
Median number of bedrooms in renter occupied houses
Mean number of bedrooms in renter occupied houses
Median number of vehichles in owner occupied houses
Mean number of vehichles in owner occupied houses
Median number of vehichles in renter occupied houses
Mean number of vehichles in renter occupied houses
Mortgage status - with mortgage (%)
Mortgage status - with second mortgage (%)
Mortgage status - with home equity loan (%)
Mortgage status - with both second mortgage and home equity loan (%)
Mortgage status - without a mortgage (%)
Average family size
Average family size - White
Average family size - Black or African American
Average family size - Asian
Average family size - Hispanic or Latino
Average family size - American Indian and Alaska Native
Average family size - Multirace
Average family size - Other Race
Geographical mobility - Same house 1 year ago (%)
Geographical mobility - Moved within same county (%)
Geographical mobility - Moved from different county within same state (%)
Geographical mobility - Moved from different state (%)
Geographical mobility - Moved from abroad (%)
Place of birth - Born in state of residence (%)
Place of birth - Born in other state (%)
Place of birth - Native, outside of US (%)
Place of birth - Foreign born (%)
Housing units in structures - 1, detached (%)
Housing units in structures - 1, attached (%)
Housing units in structures - 2 (%)
Housing units in structures - 3 or 4 (%)
Housing units in structures - 5 to 9 (%)
Housing units in structures - 10 to 19 (%)
Housing units in structures - 20 to 49 (%)
Housing units in structures - 50 or more (%)
Housing units in structures - Mobile home (%)
Housing units in structures - Boat, RV, van, etc. (%)
House/condo owner moved in on average (years ago)
Renter moved in on average (years ago)
Year householder moved into unit - Moved in 1999 to March 2000 (%)
Year householder moved into unit - Moved in 1995 to 1998 (%)
Year householder moved into unit - Moved in 1990 to 1994 (%)
Year householder moved into unit - Moved in 1980 to 1989 (%)
Year householder moved into unit - Moved in 1970 to 1979 (%)
Year householder moved into unit - Moved in 1969 or earlier (%)
Means of transportation to work - Drove car alone (%)
Means of transportation to work - Carpooled (%)
Means of transportation to work - Public transportation (%)
Means of transportation to work - Bus or trolley bus (%)
Means of transportation to work - Streetcar or trolley car (%)
Means of transportation to work - Subway or elevated (%)
Means of transportation to work - Railroad (%)
Means of transportation to work - Ferryboat (%)
Means of transportation to work - Taxicab (%)
Means of transportation to work - Motorcycle (%)
Means of transportation to work - Bicycle (%)
Means of transportation to work - Walked (%)
Means of transportation to work - Other means (%)
Working at home (%)
Industry diversity
Most Common Industries - Agriculture, forestry, fishing and hunting, and mining (%)
Most Common Industries - Agriculture, forestry, fishing and hunting (%)
Most Common Industries - Mining, quarrying, and oil and gas extraction (%)
Most Common Industries - Construction (%)
Most Common Industries - Manufacturing (%)
Most Common Industries - Wholesale trade (%)
Most Common Industries - Retail trade (%)
Most Common Industries - Transportation and warehousing, and utilities (%)
Most Common Industries - Transportation and warehousing (%)
Most Common Industries - Utilities (%)
Most Common Industries - Information (%)
Most Common Industries - Finance and insurance, and real estate and rental and leasing (%)
Most Common Industries - Finance and insurance (%)
Most Common Industries - Real estate and rental and leasing (%)
Most Common Industries - Professional, scientific, and management, and administrative and waste management services (%)
Most Common Industries - Professional, scientific, and technical services (%)
Most Common Industries - Management of companies and enterprises (%)
Most Common Industries - Administrative and support and waste management services (%)
Most Common Industries - Educational services, and health care and social assistance (%)
Most Common Industries - Educational services (%)
Most Common Industries - Health care and social assistance (%)
Most Common Industries - Arts, entertainment, and recreation, and accommodation and food services (%)
Most Common Industries - Arts, entertainment, and recreation (%)
Most Common Industries - Accommodation and food services (%)
Most Common Industries - Other services, except public administration (%)
Most Common Industries - Public administration (%)
Occupation diversity
Most Common Occupations - Management, business, science, and arts occupations (%)
Most Common Occupations - Management, business, and financial occupations (%)
Most Common Occupations - Management occupations (%)
Most Common Occupations - Business and financial operations occupations (%)
Most Common Occupations - Computer, engineering, and science occupations (%)
Most Common Occupations - Computer and mathematical occupations (%)
Most Common Occupations - Architecture and engineering occupations (%)
Most Common Occupations - Life, physical, and social science occupations (%)
Most Common Occupations - Education, legal, community service, arts, and media occupations (%)
Most Common Occupations - Community and social service occupations (%)
Most Common Occupations - Legal occupations (%)
Most Common Occupations - Education, training, and library occupations (%)
Most Common Occupations - Arts, design, entertainment, sports, and media occupations (%)
Most Common Occupations - Healthcare practitioners and technical occupations (%)
Most Common Occupations - Health diagnosing and treating practitioners and other technical occupations (%)
Most Common Occupations - Health technologists and technicians (%)
Most Common Occupations - Service occupations (%)
Most Common Occupations - Healthcare support occupations (%)
Most Common Occupations - Protective service occupations (%)
Most Common Occupations - Fire fighting and prevention, and other protective service workers including supervisors (%)
Most Common Occupations - Law enforcement workers including supervisors (%)
Most Common Occupations - Food preparation and serving related occupations (%)
Most Common Occupations - Building and grounds cleaning and maintenance occupations (%)
Most Common Occupations - Personal care and service occupations (%)
Most Common Occupations - Sales and office occupations (%)
Most Common Occupations - Sales and related occupations (%)
Most Common Occupations - Office and administrative support occupations (%)
Most Common Occupations - Natural resources, construction, and maintenance occupations (%)
Most Common Occupations - Farming, fishing, and forestry occupations (%)
Most Common Occupations - Construction and extraction occupations (%)
Most Common Occupations - Installation, maintenance, and repair occupations (%)
Most Common Occupations - Production, transportation, and material moving occupations (%)
Most Common Occupations - Production occupations (%)
Most Common Occupations - Transportation occupations (%)
Most Common Occupations - Material moving occupations (%)
People in Group quarters - Institutionalized population (%)
People in Group quarters - Correctional institutions (%)
People in Group quarters - Federal prisons and detention centers (%)
People in Group quarters - Halfway houses (%)
People in Group quarters - Local jails and other confinement facilities (including police lockups) (%)
People in Group quarters - Military disciplinary barracks (%)
People in Group quarters - State prisons (%)
People in Group quarters - Other types of correctional institutions (%)
People in Group quarters - Nursing homes (%)
People in Group quarters - Hospitals/wards, hospices, and schools for the handicapped (%)
People in Group quarters - Hospitals/wards and hospices for chronically ill (%)
People in Group quarters - Hospices or homes for chronically ill (%)
People in Group quarters - Military hospitals or wards for chronically ill (%)
People in Group quarters - Other hospitals or wards for chronically ill (%)
People in Group quarters - Hospitals or wards for drug/alcohol abuse (%)
People in Group quarters - Mental (Psychiatric) hospitals or wards (%)
People in Group quarters - Schools, hospitals, or wards for the mentally retarded (%)
People in Group quarters - Schools, hospitals, or wards for the physically handicapped (%)
People in Group quarters - Institutions for the deaf (%)
People in Group quarters - Institutions for the blind (%)
People in Group quarters - Orthopedic wards and institutions for the physically handicapped (%)
People in Group quarters - Wards in general hospitals for patients who have no usual home elsewhere (%)
People in Group quarters - Wards in military hospitals for patients who have no usual home elsewhere (%)
People in Group quarters - Juvenile institutions (%)
People in Group quarters - Long-term care (%)
People in Group quarters - Homes for abused, dependent, and neglected children (%)
People in Group quarters - Residential treatment centers for emotionally disturbed children (%)
People in Group quarters - Training schools for juvenile delinquents (%)
People in Group quarters - Short-term care, detention or diagnostic centers for delinquent children (%)
People in Group quarters - Type of juvenile institution unknown (%)
People in Group quarters - Noninstitutionalized population (%)
People in Group quarters - College dormitories (includes college quarters off campus) (%)
People in Group quarters - Military quarters (%)
People in Group quarters - On base (%)
People in Group quarters - Barracks, unaccompanied personnel housing (UPH), (Enlisted/Officer), ;and similar group living quarters for military personnel (%)
People in Group quarters - Transient quarters for temporary residents (%)
People in Group quarters - Military ships (%)
People in Group quarters - Group homes (%)
People in Group quarters - Homes or halfway houses for drug/alcohol abuse (%)
People in Group quarters - Homes for the mentally ill (%)
People in Group quarters - Homes for the mentally retarded (%)
People in Group quarters - Homes for the physically handicapped (%)
People in Group quarters - Other group homes (%)
People in Group quarters - Religious group quarters (%)
People in Group quarters - Dormitories (%)
People in Group quarters - Agriculture workers' dormitories on farms (%)
People in Group quarters - Job Corps and vocational training facilities (%)
People in Group quarters - Other workers' dormitories (%)
People in Group quarters - Crews of maritime vessels (%)
People in Group quarters - Other nonhousehold living situations (%)
People in Group quarters - Other noninstitutional group quarters (%)
Residents speaking English at home (%)
Residents speaking English at home - Born in the United States (%)
Residents speaking English at home - Native, born elsewhere (%)
Residents speaking English at home - Foreign born (%)
Residents speaking Spanish at home (%)
Residents speaking Spanish at home - Born in the United States (%)
Residents speaking Spanish at home - Native, born elsewhere (%)
Residents speaking Spanish at home - Foreign born (%)
Residents speaking other language at home (%)
Residents speaking other language at home - Born in the United States (%)
Residents speaking other language at home - Native, born elsewhere (%)
Residents speaking other language at home - Foreign born (%)
Class of Workers - Employee of private company (%)
Class of Workers - Self-employed in own incorporated business (%)
Class of Workers - Private not-for-profit wage and salary workers (%)
Class of Workers - Local government workers (%)
Class of Workers - State government workers (%)
Class of Workers - Federal government workers (%)
Class of Workers - Self-employed workers in own not incorporated business and Unpaid family workers (%)
House heating fuel used in houses and condos - Utility gas (%)
House heating fuel used in houses and condos - Bottled, tank, or LP gas (%)
House heating fuel used in houses and condos - Electricity (%)
House heating fuel used in houses and condos - Fuel oil, kerosene, etc. (%)
House heating fuel used in houses and condos - Coal or coke (%)
House heating fuel used in houses and condos - Wood (%)
House heating fuel used in houses and condos - Solar energy (%)
House heating fuel used in houses and condos - Other fuel (%)
House heating fuel used in houses and condos - No fuel used (%)
House heating fuel used in apartments - Utility gas (%)
House heating fuel used in apartments - Bottled, tank, or LP gas (%)
House heating fuel used in apartments - Electricity (%)
House heating fuel used in apartments - Fuel oil, kerosene, etc. (%)
House heating fuel used in apartments - Coal or coke (%)
House heating fuel used in apartments - Wood (%)
House heating fuel used in apartments - Solar energy (%)
House heating fuel used in apartments - Other fuel (%)
House heating fuel used in apartments - No fuel used (%)
Armed forces status - In Armed Forces (%)
Armed forces status - Civilian (%)
Armed forces status - Civilian - Veteran (%)
Armed forces status - Civilian - Nonveteran (%)
Fatal accidents locations in years 2005-2021
Fatal accidents locations in 2005
Fatal accidents locations in 2006
Fatal accidents locations in 2007
Fatal accidents locations in 2008
Fatal accidents locations in 2009
Fatal accidents locations in 2010
Fatal accidents locations in 2011
Fatal accidents locations in 2012
Fatal accidents locations in 2013
Fatal accidents locations in 2014
Fatal accidents locations in 2015
Fatal accidents locations in 2016
Fatal accidents locations in 2017
Fatal accidents locations in 2018
Fatal accidents locations in 2019
Fatal accidents locations in 2020
Fatal accidents locations in 2021
Alcohol use - People drinking some alcohol every month (%)
Alcohol use - People not drinking at all (%)
Alcohol use - Average days/month drinking alcohol
Alcohol use - Average drinks/week
Alcohol use - Average days/year people drink much
Audiometry - Average condition of hearing (%)
Audiometry - People that can hear a whisper from across a quiet room (%)
Audiometry - People that can hear normal voice from across a quiet room (%)
Audiometry - Ears ringing, roaring, buzzing (%)
Audiometry - Had a job exposure to loud noise (%)
Audiometry - Had off-work exposure to loud noise (%)
Blood Pressure & Cholesterol - Has high blood pressure (%)
Blood Pressure & Cholesterol - Checking blood pressure at home (%)
Blood Pressure & Cholesterol - Frequently checking blood cholesterol (%)
Blood Pressure & Cholesterol - Has high cholesterol level (%)
Consumer Behavior - Money monthly spent on food at supermarket/grocery store
Consumer Behavior - Money monthly spent on food at other stores
Consumer Behavior - Money monthly spent on eating out
Consumer Behavior - Money monthly spent on carryout/delivered foods
Consumer Behavior - Income spent on food at supermarket/grocery store (%)
Consumer Behavior - Income spent on food at other stores (%)
Consumer Behavior - Income spent on eating out (%)
Consumer Behavior - Income spent on carryout/delivered foods (%)
Current Health Status - General health condition (%)
Current Health Status - Blood donors (%)
Current Health Status - Has blood ever tested for HIV virus (%)
Current Health Status - Left-handed people (%)
Dermatology - People using sunscreen (%)
Diabetes - Diabetics (%)
Diabetes - Had a blood test for high blood sugar (%)
Diabetes - People taking insulin (%)
Diet Behavior & Nutrition - Diet health (%)
Diet Behavior & Nutrition - Milk product consumption (# of products/month)
Diet Behavior & Nutrition - Meals not home prepared (#/week)
Diet Behavior & Nutrition - Meals from fast food or pizza place (#/week)
Diet Behavior & Nutrition - Ready-to-eat foods (#/month)
Diet Behavior & Nutrition - Frozen meals/pizza (#/month)
Drug Use - People that ever used marijuana or hashish (%)
Drug Use - Ever used hard drugs (%)
Drug Use - Ever used any form of cocaine (%)
Drug Use - Ever used heroin (%)
Drug Use - Ever used methamphetamine (%)
Health Insurance - People covered by health insurance (%)
Kidney Conditions-Urology - Avg. # of times urinating at night
Medical Conditions - People with asthma (%)
Medical Conditions - People with anemia (%)
Medical Conditions - People with psoriasis (%)
Medical Conditions - People with overweight (%)
Medical Conditions - Elderly people having difficulties in thinking or remembering (%)
Medical Conditions - People who ever received blood transfusion (%)
Medical Conditions - People having trouble seeing even with glass/contacts (%)
Medical Conditions - People with arthritis (%)
Medical Conditions - People with gout (%)
Medical Conditions - People with congestive heart failure (%)
Medical Conditions - People with coronary heart disease (%)
Medical Conditions - People with angina pectoris (%)
Medical Conditions - People who ever had heart attack (%)
Medical Conditions - People who ever had stroke (%)
Medical Conditions - People with emphysema (%)
Medical Conditions - People with thyroid problem (%)
Medical Conditions - People with chronic bronchitis (%)
Medical Conditions - People with any liver condition (%)
Medical Conditions - People who ever had cancer or malignancy (%)
Mental Health - People who have little interest in doing things (%)
Mental Health - People feeling down, depressed, or hopeless (%)
Mental Health - People who have trouble sleeping or sleeping too much (%)
Mental Health - People feeling tired or having little energy (%)
Mental Health - People with poor appetite or overeating (%)
Mental Health - People feeling bad about themself (%)
Mental Health - People who have trouble concentrating on things (%)
Mental Health - People moving or speaking slowly or too fast (%)
Mental Health - People having thoughts they would be better off dead (%)
Oral Health - Average years since last visit a dentist
Oral Health - People embarrassed because of mouth (%)
Oral Health - People with gum disease (%)
Oral Health - General health of teeth and gums (%)
Oral Health - Average days a week using dental floss/device
Oral Health - Average days a week using mouthwash for dental problem
Oral Health - Average number of teeth
Pesticide Use - Households using pesticides to control insects (%)
Pesticide Use - Households using pesticides to kill weeds (%)
Physical Activity - People doing vigorous-intensity work activities (%)
Physical Activity - People doing moderate-intensity work activities (%)
Physical Activity - People walking or bicycling (%)
Physical Activity - People doing vigorous-intensity recreational activities (%)
Physical Activity - People doing moderate-intensity recreational activities (%)
Physical Activity - Average hours a day doing sedentary activities
Physical Activity - Average hours a day watching TV or videos
Physical Activity - Average hours a day using computer
Physical Functioning - People having limitations keeping them from working (%)
Physical Functioning - People limited in amount of work they can do (%)
Physical Functioning - People that need special equipment to walk (%)
Physical Functioning - People experiencing confusion/memory problems (%)
Physical Functioning - People requiring special healthcare equipment (%)
Prescription Medications - Average number of prescription medicines taking
Preventive Aspirin Use - Adults 40+ taking low-dose aspirin (%)
Reproductive Health - Vaginal deliveries (%)
Reproductive Health - Cesarean deliveries (%)
Reproductive Health - Deliveries resulted in a live birth (%)
Reproductive Health - Pregnancies resulted in a delivery (%)
Reproductive Health - Women breastfeeding newborns (%)
Reproductive Health - Women that had a hysterectomy (%)
Reproductive Health - Women that had both ovaries removed (%)
Reproductive Health - Women that have ever taken birth control pills (%)
Reproductive Health - Women taking birth control pills (%)
Reproductive Health - Women that have ever used Depo-Provera or injectables (%)
Reproductive Health - Women that have ever used female hormones (%)
Sexual Behavior - People 18+ that ever had sex (vaginal, anal, or oral) (%)
Sexual Behavior - Males 18+ that ever had vaginal sex with a woman (%)
Sexual Behavior - Males 18+ that ever performed oral sex on a woman (%)
Sexual Behavior - Males 18+ that ever had anal sex with a woman (%)
Sexual Behavior - Males 18+ that ever had any sex with a man (%)
Sexual Behavior - Females 18+ that ever had vaginal sex with a man (%)
Sexual Behavior - Females 18+ that ever performed oral sex on a man (%)
Sexual Behavior - Females 18+ that ever had anal sex with a man (%)
Sexual Behavior - Females 18+ that ever had any kind of sex with a woman (%)
Sexual Behavior - Average age people first had sex
Sexual Behavior - Average number of female sex partners in lifetime (males 18+)
Sexual Behavior - Average number of female vaginal sex partners in lifetime (males 18+)
Sexual Behavior - Average age people first performed oral sex on a woman (18+)
Sexual Behavior - Average number of woman performed oral sex on in lifetime (18+)
Sexual Behavior - Average number of male sex partners in lifetime (males 18+)
Sexual Behavior - Average number of male anal sex partners in lifetime (males 18+)
Sexual Behavior - Average age people first performed oral sex on a man (18+)
Sexual Behavior - Average number of male oral sex partners in lifetime (18+)
Sexual Behavior - People using protection when performing oral sex (%)
Sexual Behavior - Average number of times people have vaginal or anal sex a year
Sexual Behavior - People having sex without condom (%)
Sexual Behavior - Average number of male sex partners in lifetime (females 18+)
Sexual Behavior - Average number of male vaginal sex partners in lifetime (females 18+)
Sexual Behavior - Average number of female sex partners in lifetime (females 18+)
Sexual Behavior - Circumcised males 18+ (%)
Sleep Disorders - Average hours sleeping at night
Sleep Disorders - People that has trouble sleeping (%)
Smoking-Cigarette Use - People smoking cigarettes (%)
Taste & Smell - People 40+ having problems with smell (%)
Taste & Smell - People 40+ having problems with taste (%)
Taste & Smell - People 40+ that ever had wisdom teeth removed (%)
Taste & Smell - People 40+ that ever had tonsils teeth removed (%)
Taste & Smell - People 40+ that ever had a loss of consciousness because of a head injury (%)
Taste & Smell - People 40+ that ever had a broken nose or other serious injury to face or skull (%)
Taste & Smell - People 40+ that ever had two or more sinus infections (%)
Weight - Average height (inches)
Weight - Average weight (pounds)
Weight - Average BMI
Weight - People that are obese (%)
Weight - People that ever were obese (%)
Weight - People trying to lose weight (%)
100%
urban population.
Estimated median house/condo value in 2022: $50,995
48213:
$50,995Michigan:
$224,400
Median resident age: This zip code:
37.4 yearsMichigan median age:
40.3 years
Average household size: This zip code:
2.7 peopleMichigan:
2.4 people
Averages for the 2020 tax year for zip code 48213, filed in 2021:
Average Adjusted Gross Income (AGI) in 2020: $26,438 (Individual Income Tax Returns) Here:
$26,438State:
$68,945
Salary/wage: $23,896 (reported on 73.8% of returns )Here:
$23,896State:
$57,142
(% of AGI for various income ranges: 905.6% for AGIs below $25k , 2947.3% for AGIs $25k-50k , 7304.3% for AGIs $50k-75k , 11514.0% for AGIs $75k-100k , 18356.0% for AGIs $100k-200k ) Taxable interest for individuals: $217 (reported on 8.0% of returns )This zip code:
$217Michigan:
$1,630
(% of AGI for various income ranges: 1.9% for AGIs below $25k , 1.6% for AGIs $25k-50k , 5.7% for AGIs $50k-75k , 10.0% for AGIs $75k-100k , 14.0% for AGIs $100k-200k ) Ordinary dividends: $653 (reported on 2.3% of returns )(% of AGI for various income ranges: 0.8% for AGIs below $25k , 2.4% for AGIs $25k-50k , 6.3% for AGIs $50k-75k , 19.0% for AGIs $75k-100k ) Net capital gain/loss in AGI: +$725 (reported on 1.7% of returns )(% of AGI for various income ranges: 0.2% for AGIs below $25k , 4.1% for AGIs $25k-50k , 5.0% for AGIs $75k-100k ) Taxable individual retirement arrangement distribution: $9,262 (reported on 2.2% of returns )48213:
$9,262Michigan:
$19,803
(% of AGI for various income ranges: 8.8% for AGIs below $25k , 16.4% for AGIs $25k-50k , 125.0% for AGIs $50k-75k , 508.0% for AGIs $75k-100k ) Total itemized deductions: $24,550 (reported on 2.2% of returns )Here:
$24,550State:
$34,117
(% of AGI for various income ranges: 9.6% for AGIs below $25k , 75.7% for AGIs $25k-50k , 452.0% for AGIs $50k-75k , 840.0% for AGIs $75k-100k ) Charity contributions: $10,033 (reported on 2.1% of returns )Here:
$10,033State:
$13,548
(% of AGI for various income ranges: 29.9% for AGIs $25k-50k , 216.0% for AGIs $50k-75k , 298.0% for AGIs $75k-100k ) Taxes paid: $5,450 (reported on 2.2% of returns )(% of AGI for various income ranges: 2.2% for AGIs below $25k , 14.0% for AGIs $25k-50k , 101.7% for AGIs $50k-75k , 233.0% for AGIs $75k-100k ) Earned income credit: $2,906 (reported on 42.1% of returns )(% of AGI for various income ranges: 187.7% for AGIs below $25k , 142.8% for AGIs $25k-50k ) Percentage of individuals using paid preparers for their 2020 taxes: 90.7%(% for various income ranges: 91.6% for AGIs below $25k , 91.7% for AGIs $25k-50k , 85.4% for AGIs $50k-75k , 77.8% for AGIs $75k-100k , 80.0% for AGIs $100k-200k )
Averages for the 2012 tax year for zip code 48213, filed in 2013:
Average Adjusted Gross Income (AGI) in 2012: $20,853 (Individual Income Tax Returns) Here:
$20,853State:
$55,609
Salary/wage: $18,946 (reported on 75.6% of returns )Here:
$18,946State:
$46,782
(% of AGI for various income ranges: 63.0% for AGIs below $25k , 76.2% for AGIs $25k-50k , 70.5% for AGIs $50k-75k , 66.0% for AGIs $75k-100k , 69.9% for AGIs $100k-200k ) Taxable interest for individuals: $1,180 (reported on 9.1% of returns )This zip code:
$1,180Michigan:
$1,491
(% of AGI for various income ranges: 1.0% for AGIs below $25k , 0.2% for AGIs $25k-50k , 0.2% for AGIs $50k-75k , 0.2% for AGIs $75k-100k ) Ordinary dividends: $691 (reported on 2.6% of returns )(% of AGI for various income ranges: 0.1% for AGIs $25k-50k , 0.2% for AGIs $50k-75k ) Profit/loss from business: +$7,719 (reported on 24.8% of returns )Here:
+$7,719State:
+$11,523
(% of AGI for various income ranges: 20.7% for AGIs below $25k , 1.3% for AGIs $50k-75k , 1.8% for AGIs $75k-100k ) Taxable individual retirement arrangement distribution: $12,342 (reported on 2.7% of returns )48213:
$12,342Michigan:
$15,298
(% of AGI for various income ranges: 0.6% for AGIs below $25k , 1.1% for AGIs $25k-50k , 3.0% for AGIs $50k-75k , 9.2% for AGIs $75k-100k ) Total itemized deductions: $15,332 (31% of AGI, reported on 8.8% of returns )Here:
$15,332State:
$21,628
Here:
30.7% of AGIState:
18.4% of AGI
(% of AGI for various income ranges: 2.7% for AGIs below $25k , 7.6% for AGIs $25k-50k , 10.9% for AGIs $50k-75k , 11.6% for AGIs $75k-100k , 12.1% for AGIs $100k-200k ) Charity contributions: $4,859 (reported on 7.5% of returns )(% of AGI for various income ranges: 0.6% for AGIs below $25k , 1.8% for AGIs $25k-50k , 3.5% for AGIs $50k-75k , 3.6% for AGIs $75k-100k , 4.0% for AGIs $100k-200k ) Taxes paid: $4,291 (reported on 8.7% of returns )(% of AGI for various income ranges: 0.5% for AGIs below $25k , 1.7% for AGIs $25k-50k , 3.3% for AGIs $50k-75k , 4.1% for AGIs $75k-100k , 5.4% for AGIs $100k-200k ) Earned income credit: $3,014 (reported on 51.2% of returns )(% of AGI for various income ranges: 15.9% for AGIs below $25k , 1.8% for AGIs $25k-50k ) Percentage of individuals using paid preparers for their 2012 taxes: 55.6%(% for various income ranges: 55.4% for AGIs below $25k , 54.4% for AGIs $25k-50k , 60.0% for AGIs $50k-75k , 60.0% for AGIs $75k-100k , 66.7% for AGIs $100k-200k )
Averages for the 2004 tax year for zip code 48213, filed in 2005:
Average Adjusted Gross Income (AGI) in 2004: $22,820 (Individual Income Tax Returns) Here:
$22,820State:
$48,204
Salary/wage: $21,533 (reported on 86.8% of returns )Here:
$21,533State:
$42,791
(% of AGI for various income ranges: 73.7% for AGIs below $10k , 77.2% for AGIs $10k-25k , 85.5% for AGIs $25k-50k , 84.6% for AGIs $50k-75k , 88.7% for AGIs $75k-100k , 77.1% for AGIs over 100k ) Taxable interest for individuals: $532 (reported on 14.0% of returns )This zip code:
$532Michigan:
$1,725
(% of AGI for various income ranges: 0.5% for AGIs below $10k , 0.4% for AGIs $10k-25k , 0.3% for AGIs $25k-50k , 0.2% for AGIs $50k-75k , 0.1% for AGIs $75k-100k , 0.3% for AGIs over 100k ) Taxable dividends: $538 (reported on 3.9% of returns )(% of AGI for various income ranges: 0.1% for AGIs below $10k , 0.1% for AGIs $10k-25k , 0.1% for AGIs $25k-50k , 0.1% for AGIs $50k-75k , 0.1% for AGIs $75k-100k , 0.1% for AGIs over 100k ) Net capital gain/loss: +$1,169 (reported on 1.7% of returns )Here:
+$1,169State:
+$8,532
(% of AGI for various income ranges: -0.1% for AGIs below $10k , 0.1% for AGIs $10k-25k , 0.1% for AGIs $25k-50k , 0.2% for AGIs $50k-75k , 0.0% for AGIs over 100k ) Profit/loss from business: +$5,565 (reported on 13.7% of returns )Here:
+$5,565State:
+$9,547
(% of AGI for various income ranges: 17.7% for AGIs below $10k , 7.7% for AGIs $10k-25k , 0.1% for AGIs $25k-50k , 0.1% for AGIs $50k-75k , 0.0% for AGIs $75k-100k , -0.4% for AGIs over 100k ) IRA payment deduction: $1,267 (reported on 0.7% of returns )48213:
$1,267Michigan:
$2,875
Total itemized deductions: $13,991 (28% of AGI, reported on 16.2% of returns )Here:
$13,991State:
$18,509
Here:
27.7% of AGIState:
20.7% of AGI
(% of AGI for various income ranges: 2.1% for AGIs below $10k , 4.6% for AGIs $10k-25k , 10.2% for AGIs $25k-50k , 15.0% for AGIs $50k-75k , 14.7% for AGIs $75k-100k , 19.8% for AGIs over 100k ) Charity contributions deductions: $4,222 (8% of AGI, reported on 14.9% of returns )Here:
8.1% of AGIState:
3.6% of AGI
(% of AGI for various income ranges: 0.3% for AGIs below $10k , 1.0% for AGIs $10k-25k , 2.7% for AGIs $25k-50k , 4.7% for AGIs $50k-75k , 4.4% for AGIs $75k-100k , 5.8% for AGIs over 100k ) Total tax: $2,726 (reported on 52.6% of returns )(% of AGI for various income ranges: 3.0% for AGIs below $10k , 2.7% for AGIs $10k-25k , 5.3% for AGIs $25k-50k , 9.5% for AGIs $50k-75k , 11.8% for AGIs $75k-100k , 14.0% for AGIs over 100k ) Earned income credit: $2,299 (reported on 50.1% of returns )Percentage of individuals using paid preparers for their 2004 taxes: 69.1%(% for various income ranges: 68.3% for AGIs below $10k , 73.7% for AGIs $10k-25k , 64.5% for AGIs $25k-50k , 60.7% for AGIs $50k-75k , 66.0% for AGIs $75k-100k , 70.2% for AGIs over 100k )
Estimated median household income in 2022: This zip code:
$32,913Michigan:
$66,986
Nearest zip codes: 48214 ,
48205 ,
48215 ,
48211 ,
48207 ,
48234 .
Detroit Zip Code Map
Percentage of family households: This zip code:
35.1%Michigan:
43.3%
Percentage of households with unmarried partners: This zip code:
4.8%Michigan:
45.7%
Likely homosexual households (counted as self-reported same-sex unmarried-partner households)
Lesbian couples: 0.0% of all households Gay men: 0.1% of all households
Household received Food Stamps/SNAP in the past 12 months: 3,714Household did not receive Food Stamps/SNAP in the past 12 months: 4,136
Women who had a birth in the past 12 months: 272 (46 now married , 216 unmarried) Women who did not have a birth in the past 12 months: 4,713 (732 now married , 4,006 unmarried)
Housing units in zip code 48213 with a mortgage: 753 (73
second mortgage , 26
both second mortgage and home equity loan )
Median monthly owner costs for units with a mortgage: $1,027
Median monthly owner costs for units without a mortgage: $463
Residents with income below the poverty level in 2022:
This zip code:
37.9%Whole state:
13.4%
Residents with income below 50% of the poverty level in 2022:
This zip code:
17.0%Whole state:
6.9%
Median number of rooms in houses and condos: Median number of rooms in apartments: Notable locations in this zip code not listed on our city pages
Click to draw/clear zip code borders Notable locations in zip code 48213: (A) , City of Detroit Fire Department Emergency Medical Services Medic 14 (B) , Saint John Detroit Health Center (C) , East Maintenance Hub (D) , City of Detroit Fire Department Engine 41 (E) , City of Detroit Fire Department Engine 46 (F) , City of Detroit Fire Department Engine 65 Ladder 19 (G) , Chandler Park Library (H) , Precinct 9 Police Station (I) , City of Detroit Fire Department Engine 20 (J) . Display/hide their locations on the map
Churches in zip code 48213 include: (A) , Conquering King Missionary Baptist Church (B) , New Christ Temple Church of God in Christ (C) , New Creation in Christ Baptist Church (D) , New Greater Love Baptist Church (E) , New Life Missionary Baptist Church of Detroit (F) , New Mount Carmel Tabernacle Church of God in Christ (G) , Victory Full Gospel Baptist Church (H) , Jude Missionary Baptist Church (I) . Display/hide their locations on the map
Cemeteries: (1) , Gethsemane Cemetery (2) . Display/hide their locations on the map
Parks in zip code 48213 include: (1) , Conner Playground (2) , Saint Anthony Church Historical Marker (3) , Latham Playground (4) , Lodge Playground (5) , Saint Anthony Playground (6) . Display/hide their locations on the map
Year house built (houses)
8 2020 or later78 2010 to 2019121 2000 to 2009192 1990 to 1999190 1980 to 1989566 1970 to 1979900 1960 to 19692,352 1950 to 19592,310 1940 to 19494,727 1939 or earlier
Zip code 48213 household income distribution in 2022 1,321 Less than $10,000983 $10,000 to $14,999612 $15,000 to $19,999431 $20,000 to $24,999317 $25,000 to $29,999334 $30,000 to $34,999653 $35,000 to $39,999343 $40,000 to $44,999366 $45,000 to $49,999465 $50,000 to $59,999683 $60,000 to $74,999399 $75,000 to $99,999543 $100,000 to $124,999131 $125,000 to $149,99967 $150,000 to $199,99989 $200,000 or moreEstimate of home value of owner-occupied houses/condos in 2022 in zip code 48213 252 Less than $10,000404 $10,000 to $14,999248 $15,000 to $19,999246 $20,000 to $24,999186 $25,000 to $29,999265 $30,000 to $34,999177 $35,000 to $39,999299 $40,000 to $49,999322 $50,000 to $59,999251 $60,000 to $69,999321 $70,000 to $79,999180 $80,000 to $89,999162 $90,000 to $99,999187 $100,000 to $124,99963 $125,000 to $149,99928 $150,000 to $174,99943 $175,000 to $199,999150 $200,000 to $249,99930 $250,000 to $299,99971 $300,000 to $399,99921 $500,000 to $749,99930 $750,000 to $999,999Rent paid by renters in 2022 in zip code 48213 67 Less than $1006 $100 to $14982 $150 to $199126 $200 to $249192 $250 to $29927 $300 to $34947 $350 to $39976 $400 to $449167 $450 to $499252 $500 to $549292 $550 to $599238 $600 to $649269 $650 to $699107 $700 to $74986 $750 to $799288 $800 to $899129 $900 to $999107 $1,000 to $1,249487 No cash rent
Median gross rent in 2022: $805.
Estimated median house (or condo) value in 2022 for: White Non-Hispanic householders: $49,830Black or African American householders: $50,762American Indian or Alaska Native householders: $130,980Asian householders: $160,086Two or more races householders: $73,232Hispanic or Latino householders: $66,479Estimated median house or condo value in 2022: $50,995
48213:
$50,995Michigan:
$224,400
Lower value quartile - upper value quartile: $24,215 - $87,919
Mean price in 2022: Detached houses: $113,114Here:
$113,114State:
$280,038
Townhouses or other attached units: $59,491Here:
$59,491State:
$239,520
In 2-unit structures: $60,671Here:
$60,671State:
$219,481
Housing units in structures:
One, detached: 7,539One, attached: 1,319Two: 1,3503 or 4: 3215 to 9: 49410 to 19: 16820 to 49: 16650 or more: 247Mobile homes: 12Boats, RVs, vans, etc.: 28Unemployment : 13.7%
Means of transportation to work in zip code 48213 61.5% 3,950 Drove a car alone10.7% 688 Carpooled8.0% 511 Bus or trolley bus1.1% 70 Taxi0.3% 20 Bicycle1.5% 94 Walked5.3% 341 Other means9.7% 625 Worked at homeTravel time to work (commute) in zip code 48213 108 Less than 5 minutes355 5 to 9 minutes669 10 to 14 minutes1,104 15 to 19 minutes956 20 to 24 minutes411 25 to 29 minutes815 30 to 34 minutes213 35 to 39 minutes57 40 to 44 minutes383 45 to 59 minutes462 60 to 89 minutes189 90 or more minutes
Neighborhoods in zip code 48213: Percentage of zip code residents living and working in this county: 79.7%
Household type by relationship:
Households: 21,181
Male householders: 2,620 (1,371 living alone ), Female householders: 5,063 (1,661 living alone )1,238 spouses (1,225 opposite-sex spouses ), 515 unmarried partners , (495 opposite-sex unmarried partners ), 7,485 children (7,170 natural , 166 adopted , 150 stepchildren ), 1,697 grandchildren , 412 brothers or sisters , 236 parents , 0 foster children , 787 other relatives , 557 non-relatives In group quarters: 508 (-1 institutionalized population )
Size of family households: 1,648 2-persons , 920 3-persons , 807 4-persons , 409 5-persons , 204 6-persons , 240 7-or-more-persons
Size of nonfamily households: 3,032 1-person , 338 2-persons , 21 3-persons , 15 4-persons , 11 7-or-more-persons
1,160 married couples with children. single-parent households (495 men , 2,167 women ).
97.5% of residents of 48213 zip code speak English at home. of residents speak Spanish at home (90% very well, 2% well, 8% not well ).of residents speak other Indo-European language at home (92% very well, 8% not well ).of residents speak Asian or Pacific Island language at home (58% very well, 42% not well ).of residents speak other language at home (47% very well, 48% well, 5% not well ).
Foreign born population: 281 (1.3%)
(25.8%
of them are naturalized citizens )
This zip code:
1.3%Whole state:
6.9%
68% United Arab Emirates 9% Dominica 7% Georgia 5% Saudi Arabia 3% Grenada 2% Bhutan 2% Japan 1% African 1% Scottish 0% Syrian 0% American 0% Canadian 0% Iraqi 0% French Canadian
Year of entry for the foreign-born population
326 2010 or later 30 2000 to 2009 29 1990 to 1999 29 Before 1990
There are
129 Medical Specialists in Zip Code 48213 .
Major facilities with environmental interests located in this zip code:
DETROIT PUBLIC LIGHTING DEPT (9449 GRINNELL ST in DETROIT, MI)
(Integrated Compliance Information System) - ICIS-05-1987-0095, FORMAL ENFORCEMENT ACTION, ICIS-05-2001-0635, ENFORCEMENT/COMPLIANCE ACTIVITY COMPLIANCE ACTIVITY (Tracking inspections of insecticide, fungicide, and rodenticide, and toxic substances) CRITERIA AND HAZARDOUS AIR POLLUTANT INVENTORY (Inventory of air pollution sources) (Resource Conservation and Recovery Act (tracking hazardous waste)) Business SIC classification: ELECTRIC SERVICESAlternative names: CITY OF DETROIT, CITY OF DETROIT PUBLIC LIGHTING DEPT
CHANDLER ELEMENTARY SCHOOL (9227 CHAPIN STREET in DETROIT, MI)
(National Center for Education Statistics) - STATE ID-00634 (Resource Conservation and Recovery Act (tracking hazardous waste)) Organizations: DETROIT PUBLIC SCHOOLS (CONTACT/OWNER)
, DETROIT CITY SCHOOL DISTRICT (SCHOOL DISTRICT)
Alternative names: CHANDLER ELEM SCHOOL
A.L. HOLMES ELEMENTARY SCHOOL (8950 CRANE STREET in DETROIT, MI)
(National Center for Education Statistics) - STATE ID-00005 Conditionally Exempt Small Quantity Generators, less than 100 kg/month of hazardous waste (Resource Conservation and Recovery Act (tracking hazardous waste)) Organizations: DETROIT PUBLIC SCHOOLS (CONTACT/OWNER)
, DETROIT CITY SCHOOL DISTRICT (SCHOOL DISTRICT)
Alternative names: HOLMES AL ELEM SCHOOL
DETROIT PUBLIC SCHOOLS (5830 FIELD in DETROIT, MI)
(National Center for Education Statistics) - STATE ID-03291 Small Quantity Generators, between 100 kg and 1000 kg of hazardous waste/month (Resource Conservation and Recovery Act (tracking hazardous waste)) Organizations: DETROIT CITY SCHOOL DISTRICT (SCHOOL DISTRICT)
Alternative names: OPEN ROSE ELEM SCHOOL, OPEN ROSE ELEMENTARY SCHOOL
BLACKWELL INSTITUTE (9330 SHOEMAKER in DETROIT, MI)
(National Center for Education Statistics) - STATE ID-02058 Organizations: DETROIT CITY SCHOOL DISTRICT (SCHOOL DISTRICT)
GOODALE ELEMENTARY SCHOOL (9860 PARK DRIVE in DETROIT, MI)
(National Center for Education Statistics) - STATE ID-06631 Organizations: DETROIT CITY SCHOOL DISTRICT (SCHOOL DISTRICT)
BLANCHE KELSO BRUCE ACADEMY-CONNOR (5555 CONNOR in DETROIT, MI)
(National Center for Education Statistics) - STATE ID-09142
EASTSIDE EARLY CHILDHOOD CENTER (5950 CADILLAC in DETROIT, MI)
(National Center for Education Statistics) - STATE ID-08984 Organizations: DETROIT CITY SCHOOL DISTRICT (SCHOOL DISTRICT)
ELMDALE CONSERVATORY SCHOOL (12844 ELMDALE in DETROIT, MI)
(National Center for Education Statistics) - STATE ID-08695 Organizations: DETROIT CITY SCHOOL DISTRICT (SCHOOL DISTRICT)
MET-L-AID INC (5808 ST JEAN in DETROIT, MI)
AIR MINOR (AIRS/AFS) (Resource Conservation and Recovery Act (tracking hazardous waste)) Business SIC classification: COATING, ENGRAVING, AND ALLIED SERVICES
ADVANCE STEEL CO (9635 FRENCH RD in DETROIT, MI)
(Resource Conservation and Recovery Act (tracking hazardous waste))
DETROIT INDUSTRIAL PROCESS CO (9141 FRENCH RD in DETROIT, MI)
(Resource Conservation and Recovery Act (tracking hazardous waste)) Organizations: GUTSUE NICKLOS JAMES (CONTACT/OWNER)
DETROIT HOUSING COMMISION (4386 E CONNER AVE in DETROIT, MI)
(Resource Conservation and Recovery Act (tracking hazardous waste)) Business NAICS classification: RESIDENTIAL PROPERTY MANAGERS.
Housing units lacking complete plumbing facilities: 24.7%
Housing units lacking complete kitchen facilities: 29.0%
88.8% Utility gas 8.7% Electricity 1.1% Bottled, tank, or LP gas 0.7% No fuel used
Population in 1990: 52,700.
Place of birth for U.S.-born residents:
This state: 16,911Northeast: 458Midwest: 350South: 2,838West: 183
60% of the 48213 zip code residents lived in the same house 5 years ago.
Out of people who lived in different houses, 93% lived in this county.
Out of people who lived in different counties, 50% lived in Michigan.
88% of the 48213 zip code residents lived in the same house 1 year ago.
Out of people who lived in different houses, 79% moved from this county.
Out of people who lived in different houses, 12% moved from different county within same state.
Out of people who lived in different houses, 5% moved from different state.
Out of people who lived in different houses, 1% moved from abroad.
Private vs. public school enrollment:
Students in private schools in grades 1 to 8 (elementary and middle school): 148
Students in private schools in grades 9 to 12 (high school): 53
Students in private undergraduate colleges: 156
Occupation by median earnings in the past 12 months ($)
118,129 Health diagnosing and treating practitioners and other technical occupations 56,004 Management occupations 52,962 Health technologists and technicians 47,112 Installation, maintenance, and repair occupations 38,958 Construction and extraction occupations 34,295 Production occupations
Companies with federal contracts located in this zip code:
DETROIT, CITY OF (9449 GRINNELL in DETROIT, MI) in 10 contracts from 2000 to 2005
Contracts for Electric Services, Maintenance, Repair or Alteration of Real Property -- EPG Facilities - Other, Including Transmission by U.S. Army Corps of Engineers - civil program financing only, United States Coast Guard (disused code: now 7008), ArmySigned by year: 2000: $55,000; 2001: $35,000; 2002: $90,000; 2003: $70,000; 2004: $60,000; 2005: $37,500; 2006: $0.
Biggest contracts: with U.S. Army Corps of Engineers - civil program financing only for Electric Services. Signed on 2002-07-19. Completion date: 2004-09-30.
with United States Coast Guard (disused code: now 7008) for Maintenance, Repair or Alteration of Real Property -- EPG Facilities - Other, Including Transmission. Signed on 2000-03-15. Completion date: 2000-06-15.
with Army for Electric Services. Signed on 2005-11-10. Completion date: 2004-09-30.
with U.S. Army Corps of Engineers - civil program financing only for Electric Services. Signed on 2003-12-18. Completion date: 2004-09-30.
BETTER MADE SNACK FOODS, INC (10148 GRATIOT AVENUE in DETROIT, MI; small business) in 6 contracts from 2004 to 2006
Contracts for Food Items For Resale, Non-Food Items For Resale by Defense Commissary AgencySigned by year: 2000: $0; 2001: $0; 2002: $0; 2003: $0; 2004: $9,835; 2005: $30,607; 2006: $11,199.
Biggest contracts: with Defense Commissary Agency for Food Items For Resale. Signed on 2005-09-01. Completion date: 2005-09-30.
with Defense Commissary Agency for Non-Food Items For Resale. Signed on 2006-01-01. Completion date: 2006-03-31.
with Defense Commissary Agency for Food Items For Resale. Signed on 2004-10-01. Completion date: 2005-02-28.
with Defense Commissary Agency for Non-Food Items For Resale. Signed on 2005-10-01. Completion date: 2005-12-31.
Top industries in this zip code by the number of employees in 2005:
Construction: Electrical Contractors (500-999 employees: 1 establishment, 20-49 employees: 1 establishment)Health Care and Social Assistance: Nursing Care Facilities (100-249: 1, 20-49: 1)Accommodation and Food Services: Limited-Service Restaurants (20-49: 3, 10-19: 4, 1-4: 4)Other Services (except Public Administration): Industrial Launderers (100-249: 1)Health Care and Social Assistance: Outpatient Mental Health and Substance Abuse Centers (20-49: 2, 10-19: 1)Management of Companies and Enterprises: Corporate, Subsidiary, and Regional Managing Offices (50-99: 1, 1-4: 2)Wholesale Trade: Other Chemical and Allied Products Merchant Wholesalers (50-99: 1, 1-4: 1)
People in group quarters in 2010:
208 people in nursing facilities/skilled-nursing facilities
161 people in residential treatment centers for adults
106 people in emergency and transitional shelters (with sleeping facilities) for people experiencing homelessness
55 people in group homes intended for adults
29 people in other noninstitutional facilities
27 people in residential treatment centers for juveniles (non-correctional)
9 people in correctional residential facilities
People in group quarters in 2000:
491 people in other noninstitutional group quarters
130 people in nursing homes
51 people in other nonhousehold living situations
28 people in homes for the mentally ill
19 people in agriculture workers' dormitories on farms
9 people in homes or halfway houses for drug/alcohol abuse
8 people in homes for the mentally retarded
6 people in other group homes
Fatal accident statistics in 2014:
Fatal accident count: 12Vehicles involved in fatal accidents: 15Fatal accidents caused by drunken drivers: 1Fatalities: 12Persons involved in fatal accidents: 18Pedestrians involved in fatal accidents: 5
Fatal accident statistics in 2013:
Fatal accident count: 7Vehicles involved in fatal accidents: 13Fatal accidents caused by drunken drivers: 3Fatalities: 10Persons involved in fatal accidents: 20Pedestrians involved in fatal accidents: 3
Home Mortgage Disclosure Act Aggregated Statistics For Year 2009(Based on 16 full and 20 partial tracts) A) FHA, FSA/RHS & VA B) Conventional C) Refinancings D) Home Improvement Loans F) Non-occupant Loans on G) Loans On Manufactured Number Average Value Number Average Value Number Average Value Number Average Value Number Average Value Number Average Value
LOANS ORIGINATED 4 $42,260 0 $0 6 $67,142 24 $11,732 2 $28,040 0 $0 APPLICATIONS APPROVED, NOT ACCEPTED 0 $0 2 $49,220 4 $73,488 10 $8,109 3 $35,893 0 $0 APPLICATIONS DENIED 6 $51,703 14 $37,782 98 $54,092 99 $17,716 13 $62,376 5 $56,508 APPLICATIONS WITHDRAWN 0 $0 1 $6,100 16 $77,418 6 $20,078 1 $21,000 0 $0 FILES CLOSED FOR INCOMPLETENESS 1 $41,000 1 $72,760 3 $87,300 4 $14,260 1 $72,760 0 $0
Aggregated Statistics For Year 2008(Based on 16 full and 22 partial tracts) A) FHA, FSA/RHS & VA B) Conventional C) Refinancings D) Home Improvement Loans E) Loans on Dwellings For 5+ Families F) Non-occupant Loans on G) Loans On Manufactured Number Average Value Number Average Value Number Average Value Number Average Value Number Average Value Number Average Value Number Average Value
LOANS ORIGINATED 11 $55,454 47 $61,343 73 $59,614 37 $14,637 2 $7,395 46 $53,305 2 $22,780 APPLICATIONS APPROVED, NOT ACCEPTED 0 $0 18 $65,006 22 $50,363 12 $25,188 0 $0 8 $56,226 2 $31,435 APPLICATIONS DENIED 20 $79,389 104 $66,153 321 $66,462 261 $21,307 0 $0 116 $49,316 6 $33,943 APPLICATIONS WITHDRAWN 10 $71,810 22 $63,314 51 $72,497 7 $30,976 0 $0 23 $59,553 0 $0 FILES CLOSED FOR INCOMPLETENESS 0 $0 11 $67,816 29 $52,348 15 $30,570 0 $0 7 $45,349 0 $0
Aggregated Statistics For Year 2007(Based on 16 full and 22 partial tracts) A) FHA, FSA/RHS & VA B) Conventional C) Refinancings D) Home Improvement Loans E) Loans on Dwellings For 5+ Families F) Non-occupant Loans on G) Loans On Manufactured Number Average Value Number Average Value Number Average Value Number Average Value Number Average Value Number Average Value Number Average Value
LOANS ORIGINATED 6 $77,232 247 $66,339 321 $63,693 96 $21,557 6 $188,037 230 $61,228 0 $0 APPLICATIONS APPROVED, NOT ACCEPTED 2 $70,320 116 $70,498 134 $57,813 29 $38,888 0 $0 75 $62,962 0 $0 APPLICATIONS DENIED 10 $75,748 585 $68,700 902 $66,669 298 $30,704 0 $0 405 $61,610 9 $50,038 APPLICATIONS WITHDRAWN 5 $64,914 91 $66,573 205 $70,809 25 $53,030 0 $0 79 $61,230 0 $0 FILES CLOSED FOR INCOMPLETENESS 0 $0 40 $76,578 73 $67,526 5 $32,780 0 $0 27 $70,539 0 $0
Aggregated Statistics For Year 2006(Based on 16 full and 22 partial tracts) A) FHA, FSA/RHS & VA B) Conventional C) Refinancings D) Home Improvement Loans E) Loans on Dwellings For 5+ Families F) Non-occupant Loans on G) Loans On Manufactured Number Average Value Number Average Value Number Average Value Number Average Value Number Average Value Number Average Value Number Average Value
LOANS ORIGINATED 20 $77,310 737 $63,121 754 $62,247 111 $32,595 3 $78,773 578 $60,181 0 $0 APPLICATIONS APPROVED, NOT ACCEPTED 2 $152,915 299 $67,460 332 $66,133 26 $36,502 0 $0 203 $61,713 1 $61,060 APPLICATIONS DENIED 6 $96,140 1,053 $65,050 1,333 $69,536 376 $32,051 1 $139,640 697 $62,436 6 $15,327 APPLICATIONS WITHDRAWN 2 $74,035 288 $67,463 500 $72,836 40 $68,279 0 $0 182 $63,293 2 $182,855 FILES CLOSED FOR INCOMPLETENESS 0 $0 80 $68,231 146 $78,381 8 $38,146 0 $0 33 $66,271 0 $0
Aggregated Statistics For Year 2005(Based on 16 full and 22 partial tracts) A) FHA, FSA/RHS & VA B) Conventional C) Refinancings D) Home Improvement Loans E) Loans on Dwellings For 5+ Families F) Non-occupant Loans on G) Loans On Manufactured Number Average Value Number Average Value Number Average Value Number Average Value Number Average Value Number Average Value Number Average Value
LOANS ORIGINATED 31 $78,262 923 $62,902 944 $62,089 155 $41,874 4 $57,982 826 $60,779 0 $0 APPLICATIONS APPROVED, NOT ACCEPTED 9 $61,698 288 $60,775 378 $62,949 39 $33,897 0 $0 163 $57,700 0 $0 APPLICATIONS DENIED 12 $77,422 883 $64,742 1,657 $65,439 357 $34,817 2 $105,855 726 $60,469 4 $48,975 APPLICATIONS WITHDRAWN 5 $85,096 328 $70,858 666 $76,727 86 $92,521 1 $125,150 218 $65,985 1 $112,910 FILES CLOSED FOR INCOMPLETENESS 0 $0 84 $65,405 182 $72,310 10 $31,589 0 $0 64 $57,431 0 $0
Aggregated Statistics For Year 2004(Based on 16 full and 22 partial tracts) A) FHA, FSA/RHS & VA B) Conventional C) Refinancings D) Home Improvement Loans E) Loans on Dwellings For 5+ Families F) Non-occupant Loans on G) Loans On Manufactured Number Average Value Number Average Value Number Average Value Number Average Value Number Average Value Number Average Value Number Average Value
LOANS ORIGINATED 38 $74,412 593 $59,479 1,023 $60,127 174 $35,410 5 $144,006 609 $55,786 2 $68,945 APPLICATIONS APPROVED, NOT ACCEPTED 12 $87,016 367 $61,736 444 $60,499 33 $24,481 0 $0 238 $58,188 0 $0 APPLICATIONS DENIED 9 $114,186 550 $63,613 1,478 $60,636 272 $25,792 0 $0 522 $54,576 4 $68,275 APPLICATIONS WITHDRAWN 3 $70,987 150 $62,086 505 $65,530 43 $44,102 0 $0 118 $61,559 2 $36,345 FILES CLOSED FOR INCOMPLETENESS 3 $92,417 59 $59,086 143 $69,003 6 $42,877 0 $0 34 $56,424 0 $0
Aggregated Statistics For Year 2003(Based on 16 full and 22 partial tracts) A) FHA, FSA/RHS & VA B) Conventional C) Refinancings D) Home Improvement Loans F) Non-occupant Loans on Number Average Value Number Average Value Number Average Value Number Average Value Number Average Value
LOANS ORIGINATED 45 $70,225 410 $57,953 982 $54,889 151 $13,352 479 $52,389 APPLICATIONS APPROVED, NOT ACCEPTED 3 $57,887 201 $54,028 394 $61,136 50 $13,942 188 $51,702 APPLICATIONS DENIED 17 $61,096 395 $59,422 1,402 $56,149 343 $14,562 446 $49,901 APPLICATIONS WITHDRAWN 12 $61,584 139 $60,005 441 $61,569 20 $23,644 124 $54,150 FILES CLOSED FOR INCOMPLETENESS 2 $86,005 34 $55,996 128 $61,785 2 $32,240 38 $51,751
Aggregated Statistics For Year 2002(Based on 16 full and 22 partial tracts) A) FHA, FSA/RHS & VA B) Conventional C) Refinancings D) Home Improvement Loans E) Loans on Dwellings For 5+ Families F) Non-occupant Loans on Number Average Value Number Average Value Number Average Value Number Average Value Number Average Value Number Average Value
LOANS ORIGINATED 75 $71,891 267 $53,944 935 $55,256 160 $11,382 3 $208,553 358 $49,063 APPLICATIONS APPROVED, NOT ACCEPTED 2 $31,840 88 $56,196 397 $49,116 43 $11,943 1 $84,000 94 $47,774 APPLICATIONS DENIED 22 $80,928 180 $56,347 1,314 $50,162 409 $10,148 0 $0 267 $39,884 APPLICATIONS WITHDRAWN 16 $71,422 75 $58,029 560 $54,566 23 $29,291 0 $0 81 $43,208 FILES CLOSED FOR INCOMPLETENESS 7 $53,210 35 $61,276 165 $54,600 5 $21,766 0 $0 22 $47,011
Aggregated Statistics For Year 2001(Based on 16 full and 22 partial tracts) A) FHA, FSA/RHS & VA B) Conventional C) Refinancings D) Home Improvement Loans E) Loans on Dwellings For 5+ Families F) Non-occupant Loans on Number Average Value Number Average Value Number Average Value Number Average Value Number Average Value Number Average Value
LOANS ORIGINATED 131 $66,416 175 $48,725 1,072 $50,721 234 $10,969 0 $0 296 $45,637 APPLICATIONS APPROVED, NOT ACCEPTED 3 $47,687 75 $49,443 421 $45,649 117 $18,808 2 $75,940 103 $36,636 APPLICATIONS DENIED 28 $61,885 252 $49,236 1,501 $49,225 626 $13,303 0 $0 272 $43,489 APPLICATIONS WITHDRAWN 14 $67,894 61 $51,072 661 $50,556 52 $18,745 0 $0 78 $42,633 FILES CLOSED FOR INCOMPLETENESS 4 $49,515 12 $55,332 129 $49,180 7 $20,057 0 $0 19 $36,954
Aggregated Statistics For Year 2000(Based on 16 full and 22 partial tracts) A) FHA, FSA/RHS & VA B) Conventional C) Refinancings D) Home Improvement Loans E) Loans on Dwellings For 5+ Families F) Non-occupant Loans on Number Average Value Number Average Value Number Average Value Number Average Value Number Average Value Number Average Value
LOANS ORIGINATED 67 $59,856 170 $42,976 1,011 $44,839 246 $11,173 3 $105,317 327 $35,746 APPLICATIONS APPROVED, NOT ACCEPTED 6 $56,645 71 $42,234 405 $42,091 161 $12,763 0 $0 80 $35,214 APPLICATIONS DENIED 34 $63,681 200 $44,407 1,317 $44,967 736 $12,023 0 $0 274 $36,841 APPLICATIONS WITHDRAWN 13 $64,888 76 $43,744 539 $43,409 49 $27,577 4 $44,610 81 $39,404 FILES CLOSED FOR INCOMPLETENESS 1 $56,720 9 $35,266 190 $45,067 5 $27,152 0 $0 23 $42,215
Aggregated Statistics For Year 1999(Based on 11 full and 10 partial tracts) A) FHA, FSA/RHS & VA B) Conventional C) Refinancings D) Home Improvement Loans E) Loans on Dwellings For 5+ Families F) Non-occupant Loans on Number Average Value Number Average Value Number Average Value Number Average Value Number Average Value Number Average Value
LOANS ORIGINATED 69 $62,702 58 $40,512 769 $40,354 124 $9,300 1 $382,310 141 $35,229 APPLICATIONS APPROVED, NOT ACCEPTED 0 $0 25 $34,360 301 $37,269 92 $10,921 0 $0 53 $34,728 APPLICATIONS DENIED 10 $50,711 74 $53,927 680 $39,693 303 $10,053 0 $0 142 $35,415 APPLICATIONS WITHDRAWN 9 $60,329 39 $41,850 394 $38,286 16 $23,251 0 $0 58 $35,901 FILES CLOSED FOR INCOMPLETENESS 2 $51,805 10 $48,000 130 $39,510 4 $23,505 0 $0 20 $40,768
Private Mortgage Insurance Companies Aggregated Statistics For Year 2009(Based on 2 partial tracts) A) Conventional Number Average Value
LOANS ORIGINATED 1 $113,030 APPLICATIONS APPROVED, NOT ACCEPTED 0 $0 APPLICATIONS DENIED 0 $0 APPLICATIONS WITHDRAWN 0 $0 FILES CLOSED FOR INCOMPLETENESS 0 $0
Aggregated Statistics For Year 2008(Based on 10 full and 16 partial tracts) A) Conventional B) Refinancings C) Non-occupant Loans on Number Average Value Number Average Value Number Average Value
LOANS ORIGINATED 24 $74,607 5 $57,088 9 $55,034 APPLICATIONS APPROVED, NOT ACCEPTED 38 $71,548 8 $76,884 9 $70,088 APPLICATIONS DENIED 8 $67,526 1 $35,050 5 $61,406 APPLICATIONS WITHDRAWN 7 $83,689 0 $0 3 $77,627 FILES CLOSED FOR INCOMPLETENESS 1 $125,970 0 $0 1 $125,970
Aggregated Statistics For Year 2007(Based on 13 full and 18 partial tracts) A) Conventional B) Refinancings C) Non-occupant Loans on Number Average Value Number Average Value Number Average Value
LOANS ORIGINATED 71 $78,487 29 $85,020 36 $76,548 APPLICATIONS APPROVED, NOT ACCEPTED 29 $76,423 7 $98,873 10 $74,717 APPLICATIONS DENIED 6 $81,973 0 $0 3 $78,170 APPLICATIONS WITHDRAWN 17 $75,630 2 $78,750 9 $80,754 FILES CLOSED FOR INCOMPLETENESS 1 $103,940 0 $0 1 $103,940
Aggregated Statistics For Year 2006(Based on 15 full and 16 partial tracts) A) Conventional B) Refinancings C) Non-occupant Loans on Number Average Value Number Average Value Number Average Value
LOANS ORIGINATED 48 $68,759 30 $73,879 23 $65,781 APPLICATIONS APPROVED, NOT ACCEPTED 17 $56,651 7 $74,787 9 $54,841 APPLICATIONS DENIED 5 $71,174 2 $78,195 5 $74,506 APPLICATIONS WITHDRAWN 2 $45,190 2 $136,400 0 $0 FILES CLOSED FOR INCOMPLETENESS 0 $0 0 $0 0 $0
Aggregated Statistics For Year 2005(Based on 15 full and 18 partial tracts) A) Conventional B) Refinancings C) Non-occupant Loans on Number Average Value Number Average Value Number Average Value
LOANS ORIGINATED 68 $71,486 35 $70,212 36 $65,196 APPLICATIONS APPROVED, NOT ACCEPTED 18 $61,323 9 $68,369 9 $52,763 APPLICATIONS DENIED 7 $75,060 1 $61,000 6 $70,480 APPLICATIONS WITHDRAWN 4 $74,215 5 $52,222 2 $46,870 FILES CLOSED FOR INCOMPLETENESS 0 $0 0 $0 0 $0
Aggregated Statistics For Year 2004(Based on 14 full and 18 partial tracts) A) Conventional B) Refinancings C) Non-occupant Loans on Number Average Value Number Average Value Number Average Value
LOANS ORIGINATED 85 $59,473 49 $67,316 40 $54,868 APPLICATIONS APPROVED, NOT ACCEPTED 55 $63,084 25 $64,470 39 $57,900 APPLICATIONS DENIED 4 $74,872 7 $60,951 4 $63,120 APPLICATIONS WITHDRAWN 11 $59,523 9 $72,050 10 $73,670 FILES CLOSED FOR INCOMPLETENESS 1 $111,730 0 $0 1 $111,730
Aggregated Statistics For Year 2003(Based on 14 full and 20 partial tracts) A) Conventional B) Refinancings C) Non-occupant Loans on Number Average Value Number Average Value Number Average Value
LOANS ORIGINATED 129 $61,557 54 $73,229 71 $58,512 APPLICATIONS APPROVED, NOT ACCEPTED 51 $67,482 21 $73,613 18 $54,555 APPLICATIONS DENIED 21 $62,015 0 $0 15 $59,227 APPLICATIONS WITHDRAWN 12 $57,907 5 $65,980 11 $53,789 FILES CLOSED FOR INCOMPLETENESS 0 $0 2 $61,950 2 $61,950
Aggregated Statistics For Year 2002(Based on 16 full and 20 partial tracts) A) Conventional B) Refinancings C) Non-occupant Loans on Number Average Value Number Average Value Number Average Value
LOANS ORIGINATED 84 $59,017 55 $73,291 55 $57,170 APPLICATIONS APPROVED, NOT ACCEPTED 26 $58,783 22 $65,937 15 $63,591 APPLICATIONS DENIED 5 $48,790 0 $0 4 $53,160 APPLICATIONS WITHDRAWN 8 $85,222 9 $69,862 5 $76,524 FILES CLOSED FOR INCOMPLETENESS 0 $0 2 $31,910 2 $31,910
Aggregated Statistics For Year 2001(Based on 15 full and 22 partial tracts) A) Conventional B) Refinancings C) Non-occupant Loans on Number Average Value Number Average Value Number Average Value
LOANS ORIGINATED 63 $58,781 72 $69,910 30 $50,914 APPLICATIONS APPROVED, NOT ACCEPTED 13 $46,438 23 $70,860 6 $50,160 APPLICATIONS DENIED 5 $57,372 10 $69,991 6 $53,557 APPLICATIONS WITHDRAWN 4 $46,400 4 $82,200 3 $55,350 FILES CLOSED FOR INCOMPLETENESS 0 $0 0 $0 0 $0
Aggregated Statistics For Year 2000(Based on 16 full and 20 partial tracts) A) Conventional B) Refinancings C) Non-occupant Loans on Number Average Value Number Average Value Number Average Value
LOANS ORIGINATED 47 $50,641 109 $52,700 39 $40,360 APPLICATIONS APPROVED, NOT ACCEPTED 10 $64,136 10 $45,756 4 $34,195 APPLICATIONS DENIED 4 $40,438 2 $50,500 2 $64,230 APPLICATIONS WITHDRAWN 4 $59,862 2 $33,270 1 $56,450 FILES CLOSED FOR INCOMPLETENESS 0 $0 0 $0 0 $0
Aggregated Statistics For Year 1999(Based on 10 full and 7 partial tracts) A) Conventional B) Refinancings C) Non-occupant Loans on Number Average Value Number Average Value Number Average Value
LOANS ORIGINATED 20 $48,126 22 $51,847 10 $45,928 APPLICATIONS APPROVED, NOT ACCEPTED 2 $12,500 3 $79,700 0 $0 APPLICATIONS DENIED 1 $25,290 1 $41,390 0 $0 APPLICATIONS WITHDRAWN 0 $0 0 $0 0 $0 FILES CLOSED FOR INCOMPLETENESS 0 $0 0 $0 0 $0
2002 - 2018 National Fire Incident Reporting System (NFIRS) incidents See full 2006 National Fire Incident Reporting System statistics for zip code 48213, Michigan
Most common first names in zip code 48213 among deceased individuals Name Count Lived (average)
John 466 72.0 years Mary 396 76.6 years James 387 69.2 years William 334 71.5 years Willie 308 69.2 years Joseph 272 73.9 years Robert 264 66.3 years George 244 71.9 years Frank 208 74.5 years Charles 190 67.8 years
Most common last names in zip code 48213 among deceased individuals Last name Count Lived (average)
Williams 272 69.5 years Johnson 247 68.6 years Smith 223 68.9 years Brown 171 67.2 years Jones 166 68.0 years Harris 128 67.2 years Davis 125 68.3 years Jackson 117 70.7 years Thomas 111 68.2 years Moore 91 69.5 years
Businesses in zip code 48213
Name Count Name Count
Burger King 2 Penske 1 CVS 1 Rite Aid 1 GNC 1 T-Mobile 1 H&R Block 1 U-Haul 1 KFC 2 UPS 1 Little Caesars Pizza 2 Wendy's 1 Long John Silver's 1 White Castle 1 Payless 1
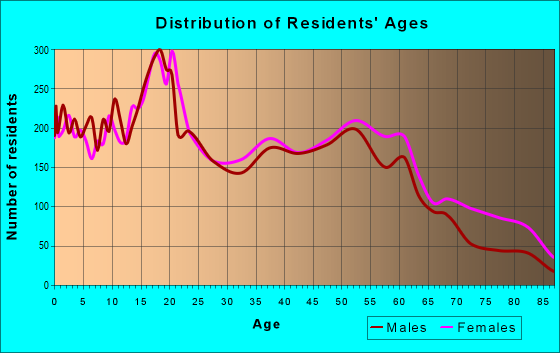
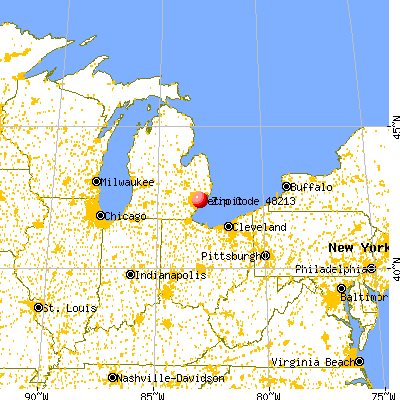


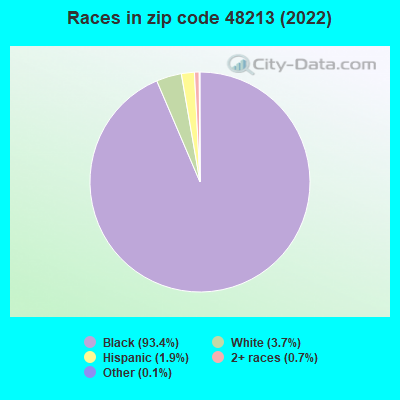


 Nearest zip codes: 48214, 48205, 48215, 48211, 48207, 48234.
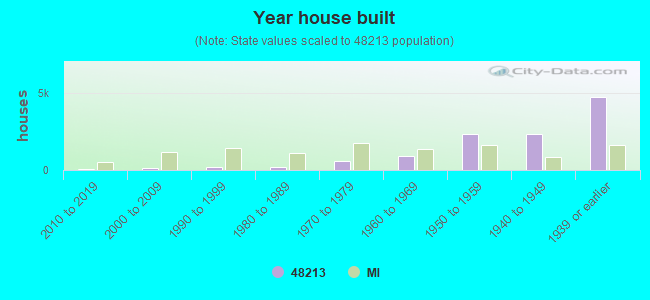

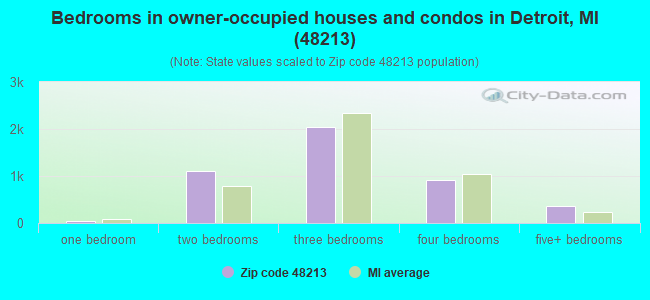
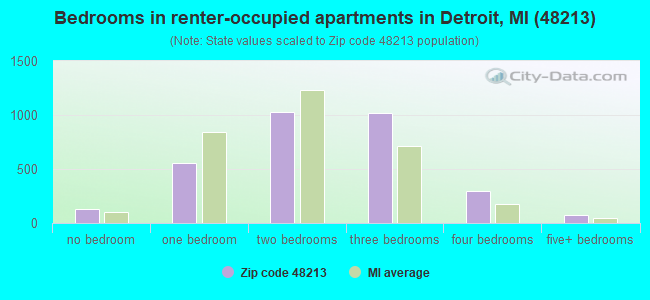
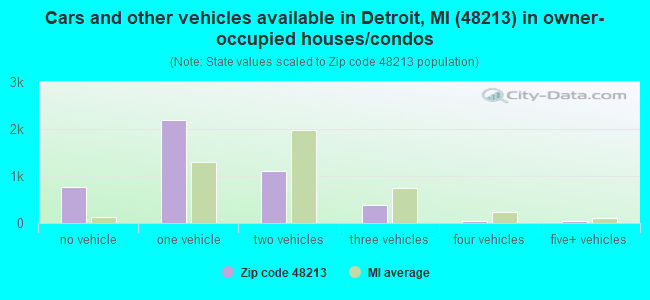
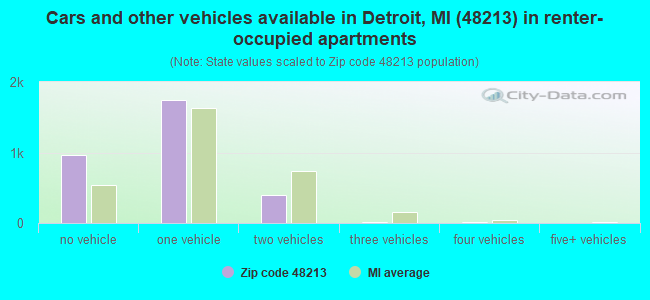


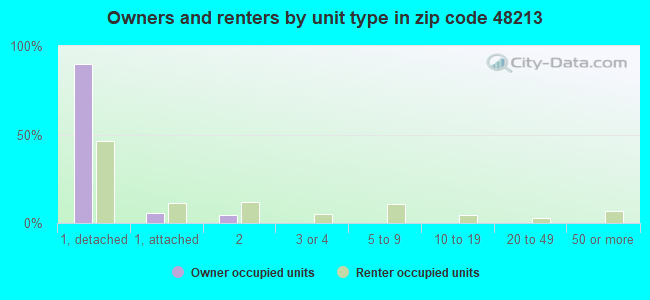
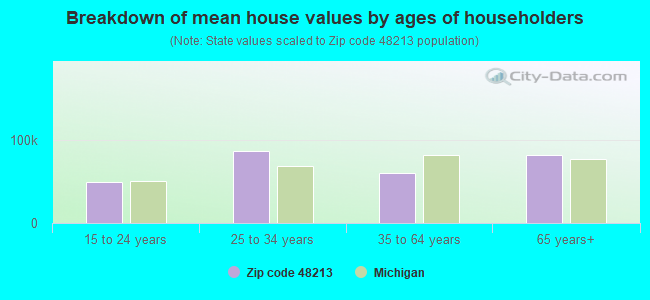


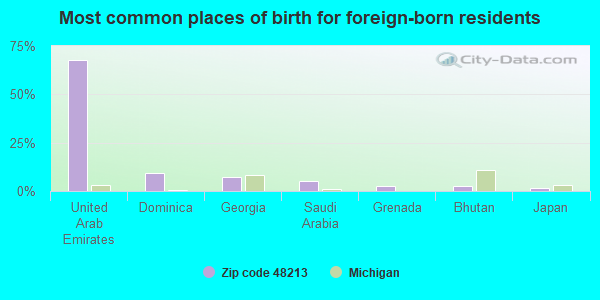
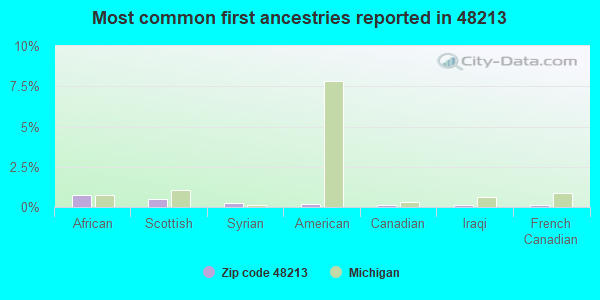
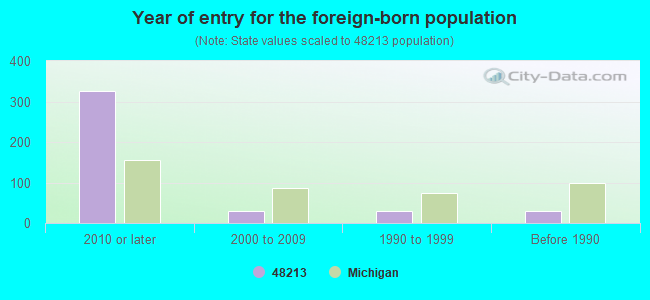


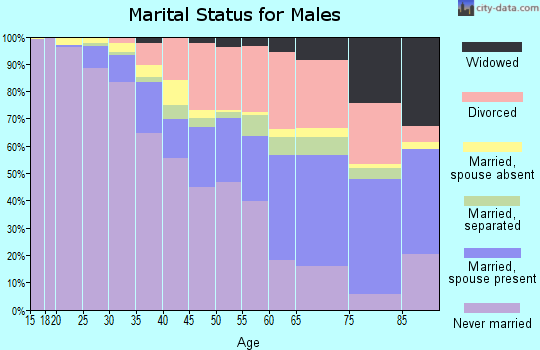
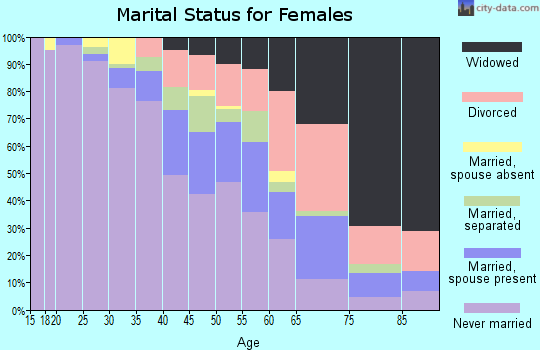
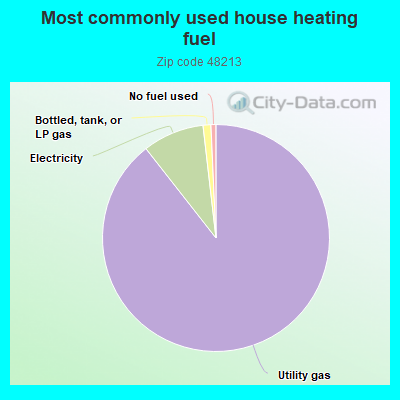
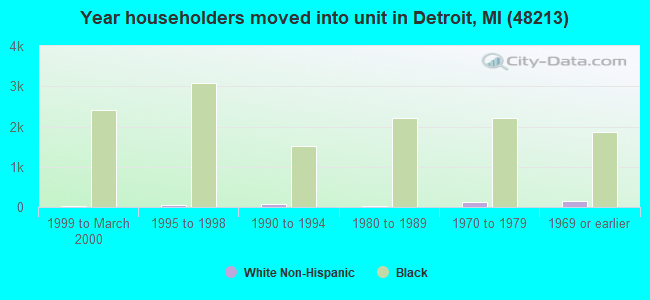
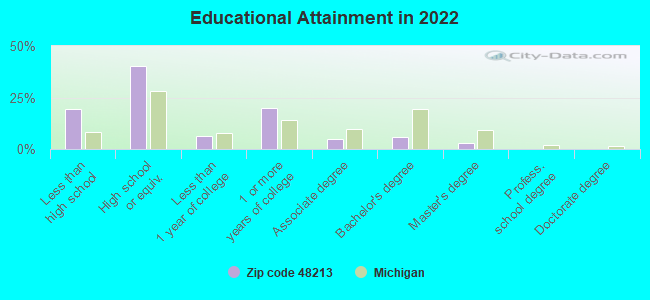
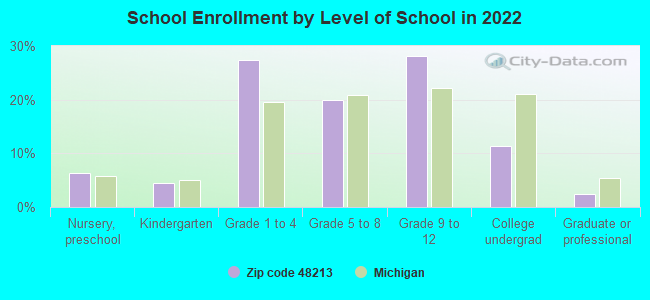
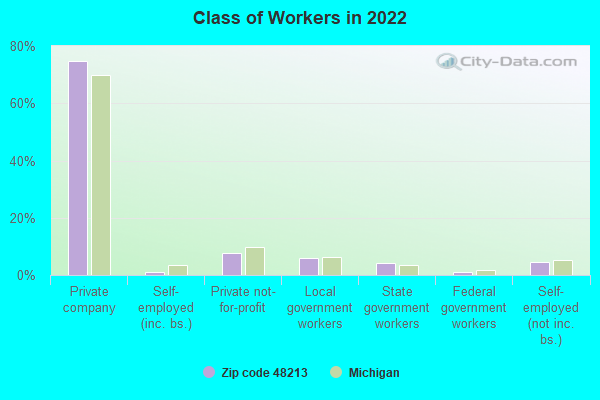
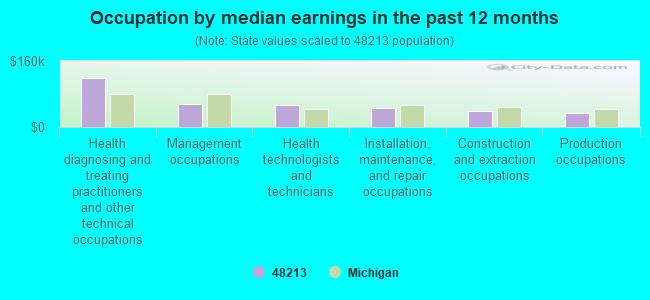
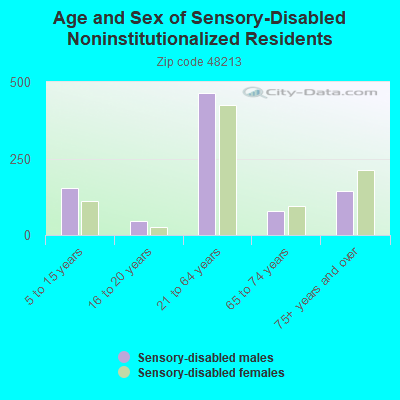
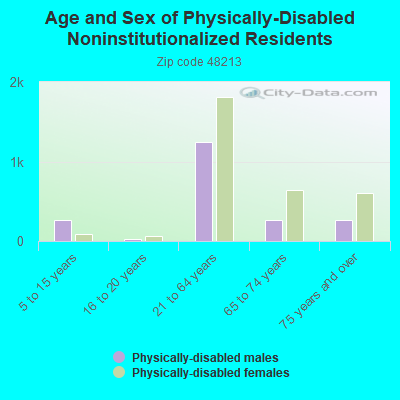
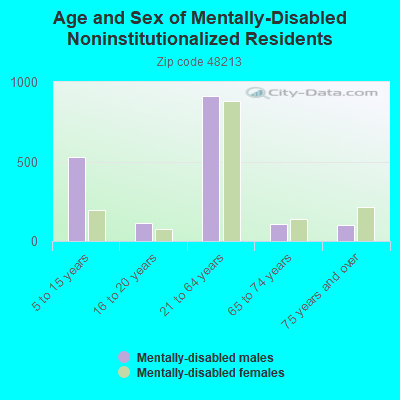
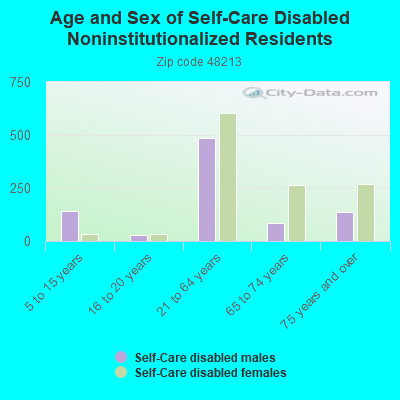
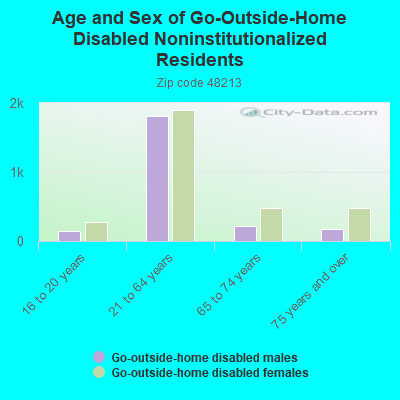
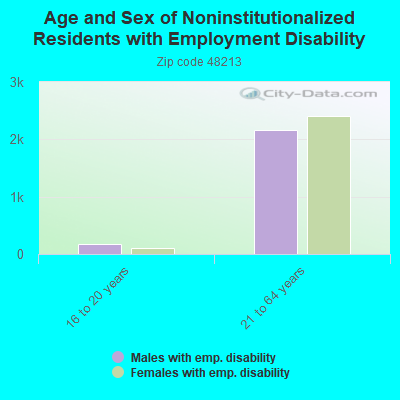
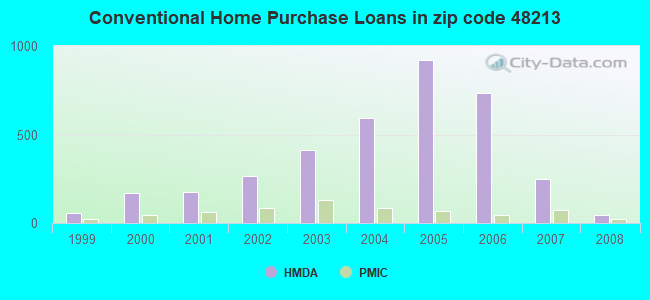
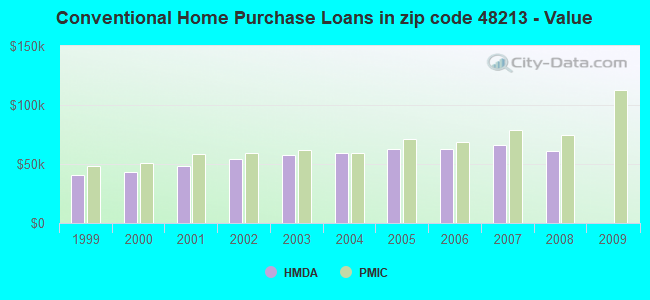
 Based on the data from the years 2002 - 2018 the average number of fires per year is 160. The highest number of fires - 308 took place in 2010, and the least - 0 in 2006. The data has an increasing trend.
 When looking into fire subcategories, the most reports belonged to: Structure Fires (58.5%), and Mobile Property/Vehicle Fires (22.0%).