Estimated zip code population in 2022: 6,030 Zip code population in 2010: 5,874 Zip code population in 2000: 5,514
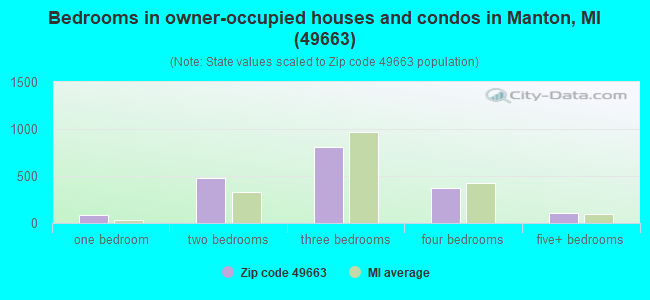
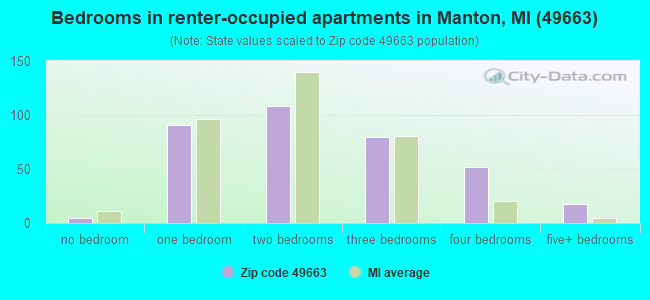
Houses and condos: 2,665 Renter-occupied apartments: 349
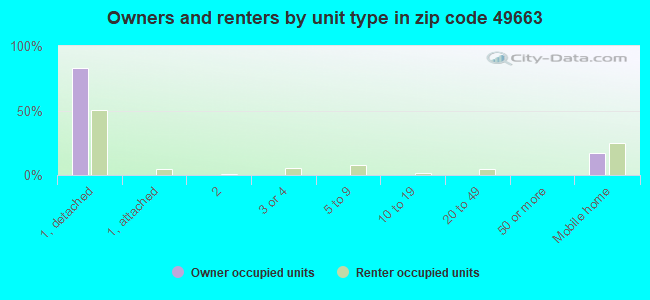
% of renters here:
16%
State:
27%
March 2022 cost of living index in zip code 49663: 81.0 (low, U.S. average is 100)
Land area: 170.1 sq. mi. Water area: 0.8 sq. mi.
Population density: 35 people per square mile
(very low).
OSM Map
General Map
Google Map
MSN Map
OSM Map
General Map
Google Map
MSN Map
OSM Map
General Map
Google Map
MSN Map
OSM Map
General Map
Google Map
MSN Map
Please wait while loading the map...
Real estate property taxes paid for housing units in 2022:
This zip code:
1.1% ($1,532)
Michigan:
1.2% ($2,746)
Median real estate property taxes paid for housing units with mortgages in 2022: $1,655 (1.0%) Median real estate property taxes paid for housing units with no mortgage in 2022: $1,439 (1.2%)
Business Search- 14 Million verified businesses
Males: 2,961
(49.1%)
Females: 3,069
(50.9%)
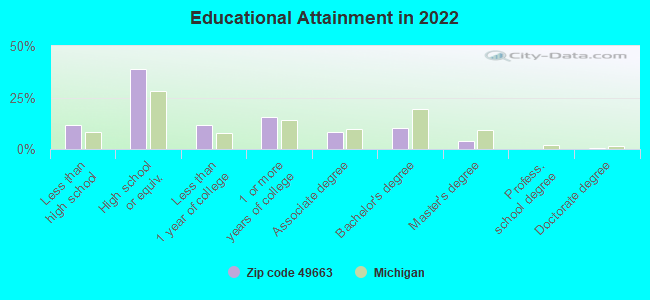
For population 25 years and over in 49663:
High school or higher: 87.3%
Bachelor's degree or higher: 14.1%
Graduate or professional degree: 4.2%
Unemployed: 5.9%
Mean travel time to work (commute): 28.4 minutes
For population 15 years and over in 49663:
Never married: 26.1%
Now married: 54.1%
Separated: 1.2%
Widowed: 6.2%
Divorced: 12.4%
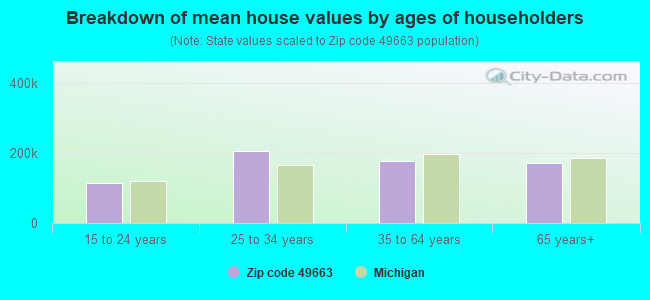
Zip code 49663 compared to state average:
Median house value below state average.
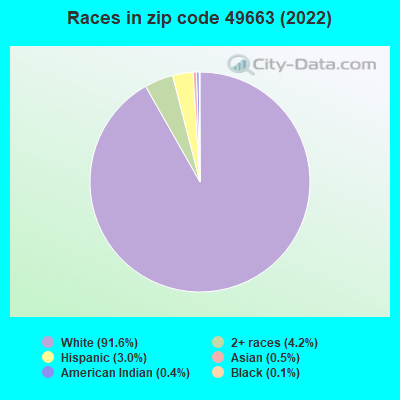
Black race population percentage significantly below state average.
Hispanic race population percentage below state average.
Foreign-born population percentage significantly below state average.
Renting percentage below state average.
Number of college students below state average.
Percentage of population with a bachelor's degree or higher significantly below state average.
Averages for the 2020 tax year for zip code 49663, filed in 2021:
Average Adjusted Gross Income (AGI) in 2020: $48,100 (Individual Income Tax Returns)
Here:
$48,100
State:
$68,945
Salary/wage: $40,871 (reported on 80.6% of returns)
Here:
$40,871
State:
$57,142
(% of AGI for various income ranges: 989.7% for AGIs below $25k, 3248.1% for AGIs $25k-50k, 6246.8% for AGIs $50k-75k, 9340.6% for AGIs $75k-100k, 14740.0% for AGIs $100k-200k)
Taxable interest for individuals: $607 (reported on 24.4% of returns)
This zip code:
$607
Michigan:
$1,630
(% of AGI for various income ranges: 15.2% for AGIs below $25k, 13.5% for AGIs $25k-50k, 12.9% for AGIs $50k-75k, 25.3% for AGIs $75k-100k, 48.1% for AGIs $100k-200k)
Ordinary dividends: $2,183 (reported on 8.6% of returns)
Here:
$2,183
State:
$6,972
(% of AGI for various income ranges: 12.8% for AGIs below $25k, 9.2% for AGIs $25k-50k, 35.3% for AGIs $50k-75k, 30.6% for AGIs $75k-100k, 123.8% for AGIs $100k-200k)
Net capital gain/loss in AGI: +$22,772 (reported on 9.0% of returns)
Here:
+$22,772
State:
+$20,064
(% of AGI for various income ranges: 7.7% for AGIs below $25k, 17.1% for AGIs $25k-50k, 132.4% for AGIs $50k-75k, 34.7% for AGIs $75k-100k, 3136.2% for AGIs $100k-200k)
Profit/loss from business: +$12,390 (reported on 14.7% of returns)
Here:
+$12,390
State:
+$11,172
(% of AGI for various income ranges: 82.9% for AGIs below $25k, 233.5% for AGIs $25k-50k, 308.8% for AGIs $50k-75k, 334.7% for AGIs $75k-100k, 855.0% for AGIs $100k-200k)
Taxable individual retirement arrangement distribution: $10,841 (reported on 7.9% of returns)
49663:
$10,841
Michigan:
$19,803
(% of AGI for various income ranges: 54.3% for AGIs below $25k, 82.5% for AGIs $25k-50k, 178.5% for AGIs $50k-75k, 270.0% for AGIs $75k-100k, 245.0% for AGIs $100k-200k)
Total itemized deductions: $29,620 (reported on 1.8% of returns)
Here:
$29,620
State:
$34,117
(% of AGI for various income ranges: 83.7% for AGIs $25k-50k, 596.2% for AGIs $100k-200k)
Charity contributions: $12,633 (reported on 1.1% of returns)
Here:
$12,633
State:
$13,548
(% of AGI for various income ranges: 236.9% for AGIs $100k-200k)
Taxes paid: $6,180 (reported on 1.8% of returns)
49663:
$6,180
State:
$7,972
(% of AGI for various income ranges: 10.0% for AGIs below $25k, 146.2% for AGIs $100k-200k)
Earned income credit: $2,069 (reported on 18.6% of returns)
Here:
$2,069
State:
$2,251
(% of AGI for various income ranges: 75.6% for AGIs below $25k, 80.8% for AGIs $25k-50k)
Percentage of individuals using paid preparers for their 2020 taxes: 94.6%
Here:
95%
State:
93%
(% for various income ranges: 92.2% for AGIs below $25k, 96.2% for AGIs $25k-50k, 97.8% for AGIs $50k-75k, 92.0% for AGIs $75k-100k, 95.8% for AGIs $100k-200k, 100.0% for AGIs over 200k)
Averages for the 2012 tax year for zip code 49663, filed in 2013:
Average Adjusted Gross Income (AGI) in 2012: $35,558 (Individual Income Tax Returns)
Here:
$35,558
State:
$55,609
Salary/wage: $32,207 (reported on 80.5% of returns)
Here:
$32,207
State:
$46,782
(% of AGI for various income ranges: 67.9% for AGIs below $25k, 75.9% for AGIs $25k-50k, 77.6% for AGIs $50k-75k, 77.7% for AGIs $75k-100k, 62.4% for AGIs $100k-200k)
Taxable interest for individuals: $1,005 (reported on 26.0% of returns)
This zip code:
$1,005
Michigan:
$1,491
(% of AGI for various income ranges: 1.3% for AGIs below $25k, 0.9% for AGIs $25k-50k, 0.3% for AGIs $50k-75k, 0.2% for AGIs $75k-100k, 0.9% for AGIs $100k-200k)
Ordinary dividends: $1,062 (reported on 9.8% of returns)
Here:
$1,062
State:
$6,225
(% of AGI for various income ranges: 0.7% for AGIs below $25k, 0.2% for AGIs $25k-50k, 0.2% for AGIs $50k-75k, 0.1% for AGIs $75k-100k, 0.3% for AGIs $100k-200k)
Net capital gain/loss in AGI: +$4,905 (reported on 8.1% of returns)
Here:
+$4,905
State:
+$9,326
(% of AGI for various income ranges: 0.1% for AGIs below $25k, 0.3% for AGIs $25k-50k, 0.6% for AGIs $50k-75k, 2.3% for AGIs $75k-100k, 2.9% for AGIs $100k-200k)
Profit/loss from business: +$9,878 (reported on 16.7% of returns)
Here:
+$9,878
State:
+$11,523
(% of AGI for various income ranges: 8.9% for AGIs below $25k, 4.8% for AGIs $25k-50k, 2.1% for AGIs $50k-75k, 3.0% for AGIs $75k-100k, 5.5% for AGIs $100k-200k)
Taxable individual retirement arrangement distribution: $8,327 (reported on 8.9% of returns)
49663:
$8,327
Michigan:
$15,298
(% of AGI for various income ranges: 2.8% for AGIs below $25k, 1.4% for AGIs $25k-50k, 2.4% for AGIs $50k-75k, 4.5% for AGIs $75k-100k)
Total itemized deductions: $16,379 (23% of AGI, reported on 15.9% of returns)
Here:
$16,379
State:
$21,628
Here:
23.3% of AGI
State:
18.4% of AGI
(% of AGI for various income ranges: 5.2% for AGIs below $25k, 6.0% for AGIs $25k-50k, 6.7% for AGIs $50k-75k, 7.8% for AGIs $75k-100k, 11.5% for AGIs $100k-200k)
Charity contributions: $3,033 (reported on 11.0% of returns)
Here:
$3,033
State:
$4,225
(% of AGI for various income ranges: 0.4% for AGIs below $25k, 0.8% for AGIs $25k-50k, 0.7% for AGIs $50k-75k, 1.2% for AGIs $75k-100k, 1.7% for AGIs $100k-200k)
Taxes paid: $5,033 (reported on 15.9% of returns)
49663:
$5,033
State:
$8,327
(% of AGI for various income ranges: 1.0% for AGIs below $25k, 1.3% for AGIs $25k-50k, 2.0% for AGIs $50k-75k, 2.7% for AGIs $75k-100k, 4.5% for AGIs $100k-200k)
Earned income credit: $2,285 (reported on 24.4% of returns)
Here:
$2,285
State:
$2,306
(% of AGI for various income ranges: 7.3% for AGIs below $25k, 1.5% for AGIs $25k-50k)
Percentage of individuals using paid preparers for their 2012 taxes: 60.2%
Here:
60%
State:
57%
(% for various income ranges: 57.9% for AGIs below $25k, 60.3% for AGIs $25k-50k, 65.7% for AGIs $50k-75k, 62.5% for AGIs $75k-100k, 63.6% for AGIs $100k-200k)
Averages for the 2004 tax year for zip code 49663, filed in 2005:
Average Adjusted Gross Income (AGI) in 2004: $30,287 (Individual Income Tax Returns)
Here:
$30,287
State:
$48,204
Salary/wage: $28,445 (reported on 84.7% of returns)
Here:
$28,445
State:
$42,791
(% of AGI for various income ranges: 106.5% for AGIs below $10k, 75.2% for AGIs $10k-25k, 82.1% for AGIs $25k-50k, 79.7% for AGIs $50k-75k, 81.0% for AGIs $75k-100k, 69.5% for AGIs over 100k)
Taxable interest for individuals: $858 (reported on 31.7% of returns)
This zip code:
$858
Michigan:
$1,725
(% of AGI for various income ranges: 4.9% for AGIs below $10k, 1.3% for AGIs $10k-25k, 0.8% for AGIs $25k-50k, 0.6% for AGIs $50k-75k, 0.7% for AGIs $75k-100k, 0.4% for AGIs over 100k)
Taxable dividends: $870 (reported on 12.0% of returns)
Here:
$870
State:
$3,420
(% of AGI for various income ranges: 2.7% for AGIs below $10k, 0.5% for AGIs $10k-25k, 0.3% for AGIs $25k-50k, 0.3% for AGIs $50k-75k, 0.2% for AGIs $75k-100k, 0.2% for AGIs over 100k)
Net capital gain/loss: +$4,032 (reported on 10.2% of returns)
Here:
+$4,032
State:
+$8,532
(% of AGI for various income ranges: -1.0% for AGIs below $10k, 0.6% for AGIs $10k-25k, 0.3% for AGIs $25k-50k, 1.6% for AGIs $50k-75k, 1.1% for AGIs $75k-100k, 6.2% for AGIs over 100k)
Profit/loss from business: +$4,617 (reported on 18.3% of returns)
Here:
+$4,617
State:
+$9,547
(% of AGI for various income ranges: 6.8% for AGIs below $10k, 5.2% for AGIs $10k-25k, 2.2% for AGIs $25k-50k, 2.8% for AGIs $50k-75k, 0.8% for AGIs $75k-100k, 2.2% for AGIs over 100k)
IRA payment deduction: $2,746 (reported on 2.6% of returns)
49663:
$2,746
Michigan:
$2,875
Total itemized deductions: $13,968 (26% of AGI, reported on 22.9% of returns)
Here:
$13,968
State:
$18,509
Here:
26.1% of AGI
State:
20.7% of AGI
(% of AGI for various income ranges: 9.8% for AGIs below $10k, 7.0% for AGIs $10k-25k, 10.4% for AGIs $25k-50k, 11.6% for AGIs $50k-75k, 14.5% for AGIs $75k-100k, 10.1% for AGIs over 100k)
Charity contributions deductions: $2,661 (5% of AGI, reported on 16.8% of returns)
Here:
$2,661
State:
$3,365
Here:
4.8% of AGI
State:
3.6% of AGI
(% of AGI for various income ranges: 0.9% for AGIs below $10k, 0.7% for AGIs $10k-25k, 1.3% for AGIs $25k-50k, 1.9% for AGIs $50k-75k, 2.1% for AGIs $75k-100k, 1.7% for AGIs over 100k)
Total tax: $3,366 (reported on 67.7% of returns)
49663:
$3,366
State:
$7,691
(% of AGI for various income ranges: 3.0% for AGIs below $10k, 3.8% for AGIs $10k-25k, 6.0% for AGIs $25k-50k, 7.6% for AGIs $50k-75k, 9.8% for AGIs $75k-100k, 17.3% for AGIs over 100k)
Earned income credit: $1,729 (reported on 21.3% of returns)
Here:
$1,729
State:
$1,737
Percentage of individuals using paid preparers for their 2004 taxes: 67.3%
Here:
67%
State:
60%
(% for various income ranges: 61.8% for AGIs below $10k, 67.8% for AGIs $10k-25k, 70.4% for AGIs $25k-50k, 67.3% for AGIs $50k-75k, 69.6% for AGIs $75k-100k, 79.6% for AGIs over 100k)
Likely homosexual households (counted as self-reported same-sex unmarried-partner households)
Lesbian couples: 0.1% of all households
Gay men: 0.0% of all households
Household received Food Stamps/SNAP in the past 12 months: 418 Household did not receive Food Stamps/SNAP in the past 12 months: 1,783
Women who had a birth in the past 12 months: 114 (106 now married, 10 unmarried) Women who did not have a birth in the past 12 months: 1,112 (513 now married, 596 unmarried)
Housing units in zip code 49663 with a mortgage: 929 (112 second mortgage, 106 both second mortgage and home equity loan) Houses without a mortgage: 18
Median monthly owner costs for units with a mortgage: $1,116 Median monthly owner costs for units without a mortgage: $503
Residents with income below the poverty level in 2022:
This zip code:
10.2%
Whole state:
13.4%
Residents with income below 50% of the poverty level in 2022:
This zip code:
3.6%
Whole state:
6.9%
Median number of rooms in houses and condos:
Here:
6.1
State:
6.5
Median number of rooms in apartments:
Here:
4.5
State:
4.3
Notable locations in this zip code not listed on our city pages
Notable locations in zip code 49663: Missaukee Mountain Ski Area (A), Gilbert Station (B), Haire Station (C), Baxter Bridge State Forest Campground (D), Lake Billings Campground (E), Manton Station (F), Wesleyan Campground (G), Emerald Vale Golf Course (H), Chase Creek Campground (I), Whitlock Lake Campground (J), Pleasant Hill School (K), Manton Area Historical Museum (L), Manton Police Department (M), Manton Public Library (N), Cedar Creek Township Volunteer Fire Department (O), Colfax - Greenwood Volunteer Fire Department (P), Caldwell Township Hall (Q), Michigan Department of Natural Resources Manton Field Office (R), Manton Fire Department (S). Display/hide their locations on the map
Churches in zip code 49663 include: Church of Christ Disciples (A), Rollins Church (B), Saint Theresa's Church (C), First Christian Church (D), Manton United Methodist Church (E), Manton Free Methodist Church (F), Manton Baptist Church (G), Trinity Lutheran Church (H), Colfax Church (I). Display/hide their locations on the map
Cemeteries: Caldwell Cemetery (1), Greenwood Cemetery (2), Gilbert Lutheran Cemetery (3), Soper Cemetery (4), Liberty Cemetery (5), Fairview Cemetery (6), Bloomfield Cemetery (7). Display/hide their locations on the map
Lakes and swamps: Twin Lake (A), Lost Lake (B), Billings Lake (C), Buttermilk Lake (D), Cedar Lake (E), Whitlock Lake (F), Mill Pond (G), Stoddard Lake (H). Display/hide their locations on the map
Streams, rivers, and creeks: Buttermilk Creek (A), Blind Creek (B), Apple Creek (C), Golden Creek (D), Walton Outlet (E), Manton Creek (F), Chase Creek (G), Filer Creek (H), Silver Creek (I). Display/hide their locations on the map
1,094 married couples with children.
300 single-parent households (84 men, 216 women).
95.5% of residents of 49663 zip code speak English at home.
0.8% of residents speak Spanish at home (87% very well, 2% well, 11% not well).
3.1% of residents speak other Indo-European language at home (75% very well, 23% well, 2% not well).
0.1% of residents speak Asian or Pacific Island language at home (100% very well).
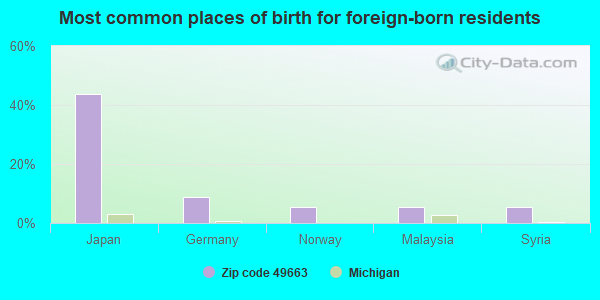
Foreign born population: 57 (1.0%) (66.1% of them are naturalized citizens)
This zip code:
1.0%
Whole state:
6.9%
44%Japan
9%Germany
5%Norway
5%Malaysia
5%Syria
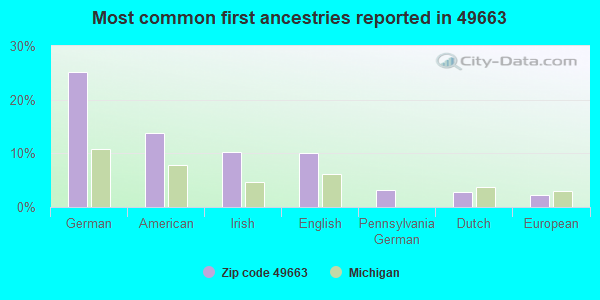
25%German
14%American
10%Irish
10%English
3%Pennsylvania German
3%Dutch
2%European
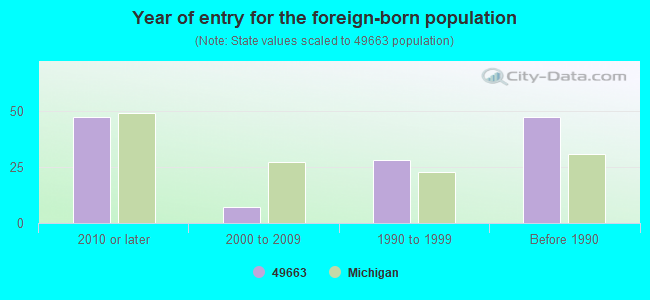
Year of entry for the foreign-born population
472010 or later
72000 to 2009
281990 to 1999
47Before 1990
Facilities with environmental interests located in this zip code:
MI DEPT/TRANSPORTATION BRIDGE (US-131 OVER MANISTEE RIVER in MANTON, MI)
(Resource Conservation and Recovery Act (tracking hazardous waste)) Organizations: MICH DEPT OF TRANSPORTATION (CONTACT/OPERATOR)
Alternative names: MIDOT BRIDGE US-131 OVER MANISTEE RIVER
AVON AUTOMOTIVE (210 E 7TH ST in MANTON, MI)
Small Quantity Generators, between 100 kg and 1000 kg of hazardous waste/month (Resource Conservation and Recovery Act (tracking hazardous waste)) - notification Business NAICS classification: ALL OTHER MISCELLANEOUS CHEMICAL PRODUCT AND PREPARATION MANUFACTURING. Organizations: CADILLAC RUBBER & PLASTIC INC (CONTACT/OPERATOR)
Alternative names: CADILLAC RUBBER & PLASTIC INC MANTON DIV
Housing units lacking complete plumbing facilities: 3.2% Housing units lacking complete kitchen facilities: 2.4%
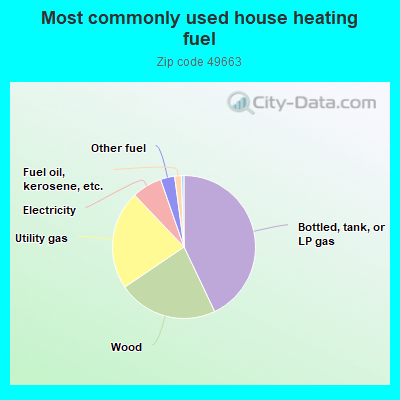
43.0%Bottled, tank, or LP gas
22.6%Wood
22.4%Utility gas
6.8%Electricity
3.2%Other fuel
1.5%Fuel oil, kerosene, etc.
Population in 1990: 3,516. Population change in the 1990s: +1,998 (+56.8%).
Place of birth for U.S.-born residents:
This state: 5,056
Northeast: 106
Midwest: 372
South: 178
West: 184
57% of the 49663 zip code residents lived in the same house 5 years ago. Out of people who lived in different houses, 43% lived in this county. Out of people who lived in different counties, 50% lived in Michigan.
90% of the 49663 zip code residents lived in the same house 1 year ago. Out of people who lived in different houses, 29% moved from this county. Out of people who lived in different houses, 46% moved from different county within same state. Out of people who lived in different houses, 23% moved from different state. Out of people who lived in different houses, 3% moved from abroad.
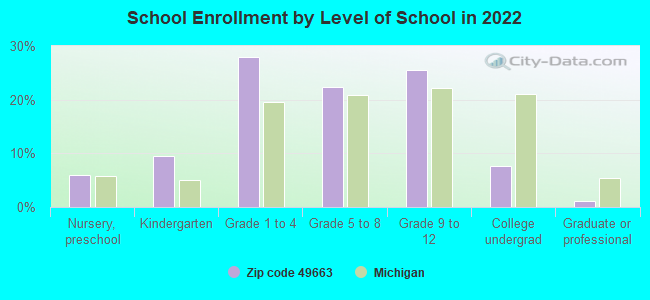
Private vs. public school enrollment:
Students in private schools in grades 1 to 8 (elementary and middle school): 170
Here:
26.7%
Michigan:
12.4%
Students in private schools in grades 9 to 12 (high school): 56
Here:
17.5%
Michigan:
9.8%
Students in private undergraduate colleges: 35
Here:
38.6%
Michigan:
14.9%
Occupation by median earnings in the past 12 months ($)
98,600Architecture and engineering occupations
70,066Community and social service occupations
66,575Health diagnosing and treating practitioners and other technical occupations
59,595Farming, fishing, and forestry occupations
55,981Computer and mathematical occupations
48,218Management occupations
Top industries in this zip code by the number of employees in 2005:
Health Care and Social Assistance: Child Day Care Services (20-49 employees: 1 establishment, 1-4 employees: 3 establishments)
Accommodation and Food Services: Full-Service Restaurants (10-19: 1, 5-9: 2)
Construction: New Single-Family Housing Construction (except Operative Builders) (5-9: 2, 1-4: 2)
Construction: Other Building Equipment Contractors (10-19: 1)
Construction: Structural Steel and Precast Concrete Contractors (10-19: 1)
People in group quarters in 2010:
35 people in group homes intended for adults
6 people in nursing facilities/skilled-nursing facilities
4 people in workers' group living quarters and job corps centers
People in group quarters in 2000:
26 people in other noninstitutional group quarters
8 people in homes for the mentally ill
Fatal accident statistics in 2013:
Fatal accident count: 2
Vehicles involved in fatal accidents: 2
Fatal accidents caused by drunken drivers: 1
Fatalities: 2
Persons involved in fatal accidents: 2
Pedestrians involved in fatal accidents: 1
Fatal accident statistics in 2012:
Fatal accident count: 1
Vehicles involved in fatal accidents: 3
Fatal accidents caused by drunken drivers: 0
Fatalities: 1
Persons involved in fatal accidents: 3
Pedestrians involved in fatal accidents: 0
2002 - 2018 National Fire Incident Reporting System (NFIRS) incidents
According to the data from the years 2002 - 2018 the average number of fires per year is 26. The highest number of reported fire incidents - 50 took place in 2018, and the least - 0 in 2006. The data has a growing trend.
When looking into fire subcategories, the most incidents belonged to: Structure Fires (54.1%), and Outside Fires (29.6%).
Fire incident types reported to NFIRS in Zip Code 49663

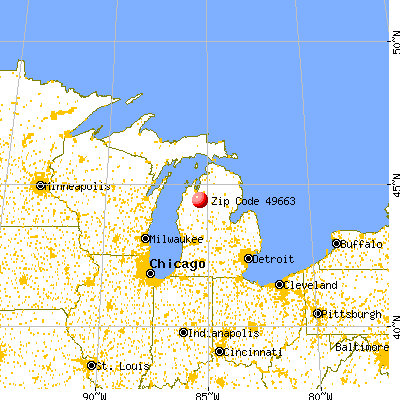


 Nearest zip codes: 49649, 49633, 49601, 49680, 49666, 49618.


 According to the data from the years 2002 - 2018 the average number of fires per year is 26. The highest number of reported fire incidents - 50 took place in 2018, and the least - 0 in 2006. The data has a growing trend.
 When looking into fire subcategories, the most incidents belonged to: Structure Fires (54.1%), and Outside Fires (29.6%).