Estimated zip code population in 2022: 1,321 Zip code population in 2010: 1,163 Zip code population in 2000: 1,177
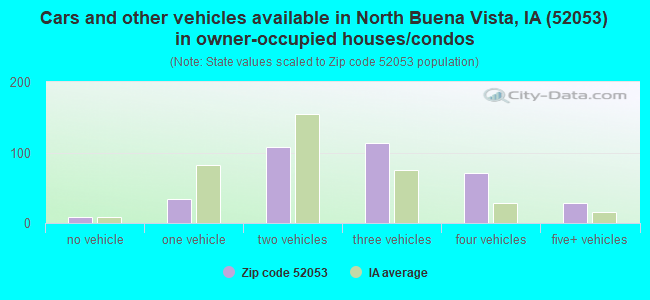
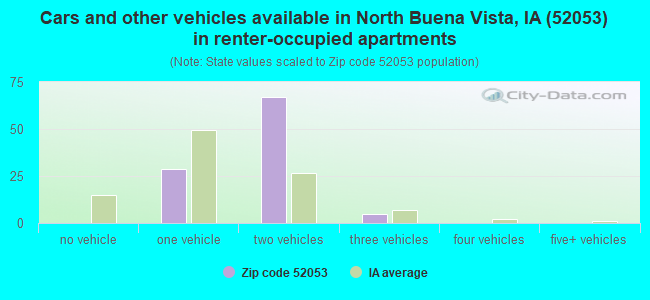
Houses and condos: 459 Renter-occupied apartments: 101
% of renters here:
22%
State:
28%
March 2022 cost of living index in zip code 52053: 80.0 (low, U.S. average is 100)
Land area: 59.2 sq. mi. Water area: 0.5 sq. mi.
Population density: 22 people per square mile
(very low).
OSM Map
General Map
Google Map
MSN Map
OSM Map
General Map
Google Map
MSN Map
OSM Map
General Map
Google Map
MSN Map
OSM Map
General Map
Google Map
MSN Map
Please wait while loading the map...
Real estate property taxes paid for housing units in 2022:
This zip code:
1.2% ($2,808)
Iowa:
1.4% ($2,724)
Median real estate property taxes paid for housing units with mortgages in 2022: $3,227 (0.9%) Median real estate property taxes paid for housing units with no mortgage in 2022: $2,494 (1.3%)
Business Search- 14 Million verified businesses
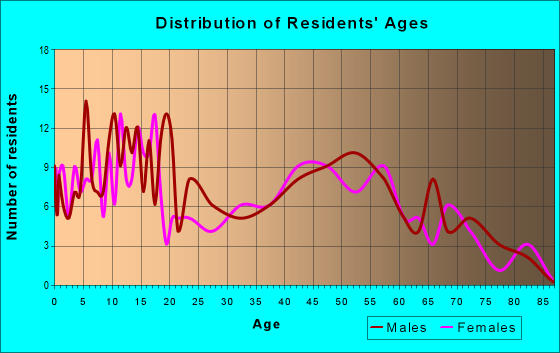
Males: 699
(52.9%)
Females: 622
(47.1%)
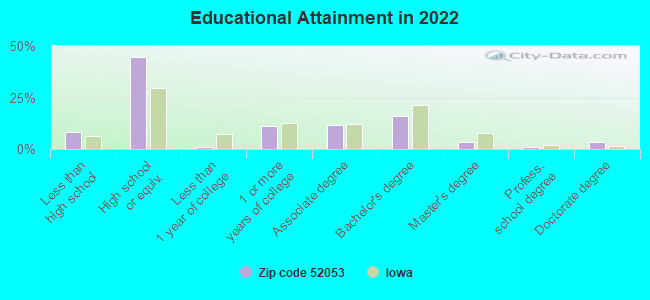
For population 25 years and over in 52053:
High school or higher: 89.8%
Bachelor's degree or higher: 23.2%
Graduate or professional degree: 7.7%
Unemployed: 0.6%
Mean travel time to work (commute): 32.7 minutes
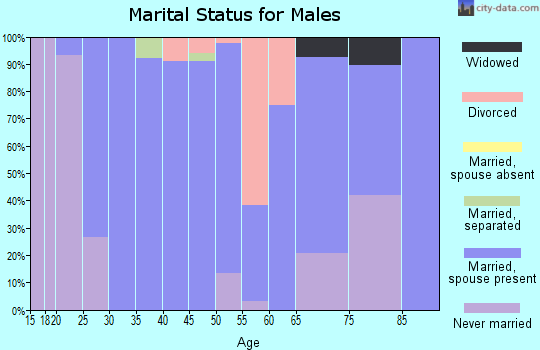
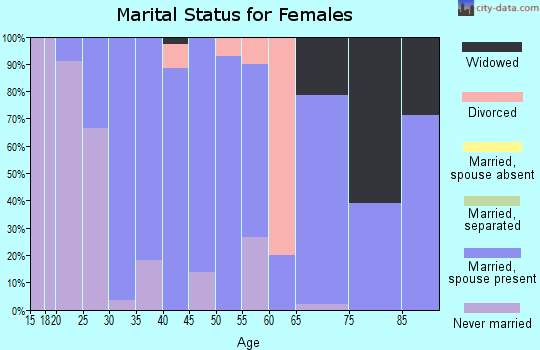
For population 15 years and over in 52053:
Never married: 32.3%
Now married: 63.2%
Separated: 0.1%
Widowed: 2.9%
Divorced: 1.5%
Zip code 52053 compared to state average:
Median household income above state average.
Unemployed percentage significantly below state average.
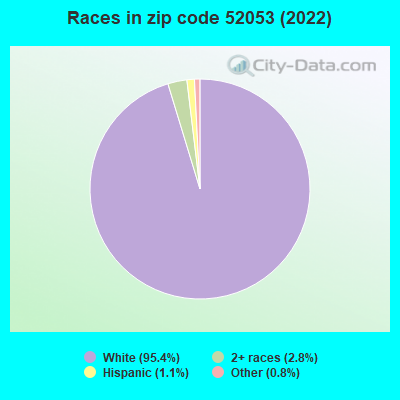
Black race population percentage significantly below state average.
Hispanic race population percentage significantly below state average.
Foreign-born population percentage significantly below state average.
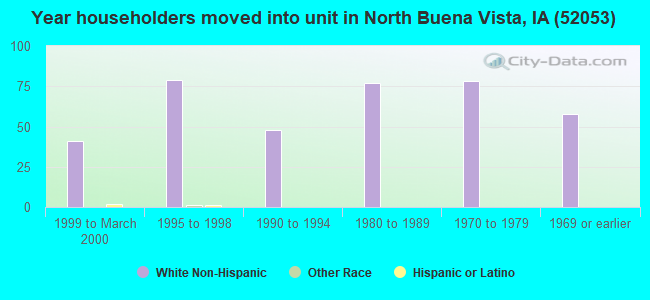
Length of stay since moving in significantly above state average.
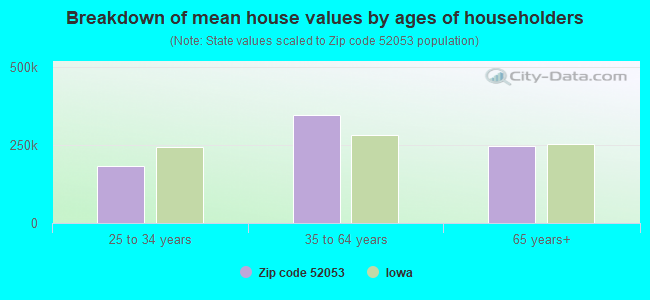
Estimated median house/condo value in 2022: $241,107
52053:
$241,107
Iowa:
$194,600
Median resident age:
This zip code:
34.9 years
Iowa median age:
38.9 years
Average household size:
This zip code:
2.9 people
Iowa:
2.3 people
Averages for the 2020 tax year for zip code 52053, filed in 2021:
Average Adjusted Gross Income (AGI) in 2020: $59,140 (Individual Income Tax Returns)
Here:
$59,140
State:
$71,087
Salary/wage: $49,929 (reported on 84.9% of returns)
Here:
$49,929
State:
$57,361
(% of AGI for various income ranges: 1776.2% for AGIs below $25k, 3973.7% for AGIs $25k-50k, 6241.4% for AGIs $50k-75k, 11810.0% for AGIs $75k-100k, 16593.3% for AGIs $100k-200k)
Taxable interest for individuals: $1,929 (reported on 52.8% of returns)
This zip code:
$1,929
Iowa:
$1,633
(% of AGI for various income ranges: 113.8% for AGIs below $25k, 101.2% for AGIs $25k-50k, 268.6% for AGIs $50k-75k, 40.0% for AGIs $75k-100k, 280.0% for AGIs $100k-200k)
Ordinary dividends: $2,836 (reported on 26.4% of returns)
Here:
$2,836
State:
$5,432
(% of AGI for various income ranges: 36.2% for AGIs below $25k, 45.0% for AGIs $25k-50k, 208.6% for AGIs $50k-75k, 310.0% for AGIs $100k-200k)
Net capital gain/loss in AGI: +$8,320 (reported on 28.3% of returns)
Here:
+$8,320
State:
+$15,243
(% of AGI for various income ranges: 113.8% for AGIs below $25k, 210.0% for AGIs $25k-50k, 518.6% for AGIs $50k-75k, 1043.3% for AGIs $100k-200k)
Profit/loss from business: +$9,000 (reported on 11.3% of returns)
Here:
+$9,000
State:
+$11,763
(% of AGI for various income ranges: 452.5% for AGIs $25k-50k, 593.3% for AGIs $75k-100k)
Taxable individual retirement arrangement distribution: $6,760 (reported on 9.4% of returns)
52053:
$6,760
Iowa:
$17,324
(% of AGI for various income ranges: 110.0% for AGIs below $25k, 357.1% for AGIs $50k-75k)
Earned income credit: $2,100 (reported on 7.5% of returns)
Here:
$2,100
State:
$2,195
(% of AGI for various income ranges: 105.0% for AGIs below $25k)
Percentage of individuals using paid preparers for their 2020 taxes: 96.2%
Here:
96%
State:
95%
(% for various income ranges: 100.0% for AGIs below $25k, 91.7% for AGIs $25k-50k, 90.9% for AGIs $50k-75k, 100.0% for AGIs $75k-100k, 100.0% for AGIs $100k-200k)
Averages for the 2012 tax year for zip code 52053, filed in 2013:
Average Adjusted Gross Income (AGI) in 2012: $49,490 (Individual Income Tax Returns)
Here:
$49,490
State:
$58,860
Salary/wage: $40,283 (reported on 80.8% of returns)
Here:
$40,283
State:
$46,659
(% of AGI for various income ranges: 72.3% for AGIs below $25k, 72.7% for AGIs $25k-50k, 73.7% for AGIs $50k-75k, 79.7% for AGIs $75k-100k, 46.4% for AGIs $100k-200k)
Taxable interest for individuals: $1,339 (reported on 59.6% of returns)
This zip code:
$1,339
Iowa:
$1,537
(% of AGI for various income ranges: 4.9% for AGIs below $25k, 2.6% for AGIs $25k-50k, 1.5% for AGIs $50k-75k, 1.3% for AGIs $75k-100k, 0.5% for AGIs $100k-200k)
Ordinary dividends: $2,021 (reported on 26.9% of returns)
Here:
$2,021
State:
$4,542
(% of AGI for various income ranges: 2.4% for AGIs below $25k, 0.9% for AGIs $25k-50k, 2.7% for AGIs $50k-75k, 0.5% for AGIs $100k-200k)
Net capital gain/loss in AGI: +$15,143 (reported on 26.9% of returns)
Here:
+$15,143
State:
+$11,802
(% of AGI for various income ranges: 0.9% for AGIs below $25k, 6.2% for AGIs $25k-50k, 3.8% for AGIs $50k-75k, 19.2% for AGIs $100k-200k)
Profit/loss from business: +$3,867 (reported on 11.5% of returns)
Here:
+$3,867
State:
+$10,509
Taxable individual retirement arrangement distribution: $5,180 (reported on 9.6% of returns)
52053:
$5,180
Iowa:
$11,773
Total itemized deductions: $15,567 (17% of AGI, reported on 23.1% of returns)
Here:
$15,567
State:
$21,278
Here:
16.7% of AGI
State:
18.9% of AGI
(% of AGI for various income ranges: 16.0% for AGIs below $25k, 7.6% for AGIs $50k-75k, 9.3% for AGIs $75k-100k, 8.0% for AGIs $100k-200k)
Charity contributions: $1,856 (reported on 17.3% of returns)
Here:
$1,856
State:
$4,044
(% of AGI for various income ranges: 1.9% for AGIs $25k-50k, 0.8% for AGIs $75k-100k, 0.4% for AGIs $100k-200k)
Taxes paid: $6,550 (reported on 23.1% of returns)
52053:
$6,550
State:
$8,846
(% of AGI for various income ranges: 3.9% for AGIs below $25k, 2.2% for AGIs $50k-75k, 3.4% for AGIs $75k-100k, 5.0% for AGIs $100k-200k)
Earned income credit: $2,050 (reported on 11.5% of returns)
Here:
$2,050
State:
$2,098
(% of AGI for various income ranges: 4.1% for AGIs below $25k, 0.8% for AGIs $25k-50k)
Percentage of individuals using paid preparers for their 2012 taxes: 80.8%
Here:
81%
State:
65%
(% for various income ranges: 77.8% for AGIs below $25k, 78.6% for AGIs $25k-50k, 88.9% for AGIs $50k-75k, 83.3% for AGIs $75k-100k, 80.0% for AGIs $100k-200k)
Averages for the 2004 tax year for zip code 52053, filed in 2005:
Average Adjusted Gross Income (AGI) in 2004: $31,910 (Individual Income Tax Returns)
Here:
$31,910
State:
$43,875
Salary/wage: $30,480 (reported on 81.3% of returns)
Here:
$30,480
State:
$38,265
(% of AGI for various income ranges: 65.1% for AGIs $10k-25k, 70.6% for AGIs $25k-50k, 78.1% for AGIs $50k-75k, 70.5% for AGIs $75k-100k, 80.6% for AGIs over 100k)
Taxable interest for individuals: $1,947 (reported on 71.9% of returns)
This zip code:
$1,947
Iowa:
$1,768
(% of AGI for various income ranges: 8.1% for AGIs $10k-25k, 5.4% for AGIs $25k-50k, 3.4% for AGIs $50k-75k, 1.5% for AGIs $75k-100k)
Taxable dividends: $988 (reported on 30.8% of returns)
Here:
$988
State:
$2,510
(% of AGI for various income ranges: 1.8% for AGIs $10k-25k, 1.0% for AGIs $25k-50k, 0.7% for AGIs $50k-75k, 0.9% for AGIs $75k-100k)
Net capital gain/loss: +$4,846 (reported on 33.7% of returns)
Here:
+$4,846
State:
+$6,139
(% of AGI for various income ranges: 4.8% for AGIs $10k-25k, 4.6% for AGIs $25k-50k, 3.8% for AGIs $50k-75k, 7.2% for AGIs $75k-100k)
Profit/loss from business: +$4,035 (reported on 11.0% of returns)
Here:
+$4,035
State:
+$8,574
(% of AGI for various income ranges: 4.7% for AGIs $10k-25k, 2.0% for AGIs $25k-50k, -0.4% for AGIs $50k-75k)
IRA payment deduction: $3,143 (reported on 2.7% of returns)
52053:
$3,143
Iowa:
$2,970
Total itemized deductions: $13,892 (24% of AGI, reported on 17.9% of returns)
Here:
$13,892
State:
$16,976
Here:
23.6% of AGI
State:
20.8% of AGI
(% of AGI for various income ranges: 7.0% for AGIs $10k-25k, 7.4% for AGIs $25k-50k, 6.1% for AGIs $50k-75k, 7.7% for AGIs $75k-100k, 14.2% for AGIs over 100k)
Charity contributions deductions: $1,357 (2% of AGI, reported on 16.2% of returns)
Here:
$1,357
State:
$3,089
Here:
2.2% of AGI
State:
3.6% of AGI
(% of AGI for various income ranges: 0.6% for AGIs $10k-25k, 0.6% for AGIs $25k-50k, 0.5% for AGIs $50k-75k, 0.8% for AGIs $75k-100k, 1.4% for AGIs over 100k)
Total tax: $3,483 (reported on 74.4% of returns)
52053:
$3,483
State:
$6,177
(% of AGI for various income ranges: 5.3% for AGIs $10k-25k, 6.2% for AGIs $25k-50k, 7.5% for AGIs $50k-75k, 10.2% for AGIs $75k-100k, 13.5% for AGIs over 100k)
Earned income credit: $1,453 (reported on 14.4% of returns)
Here:
$1,453
State:
$1,540
Percentage of individuals using paid preparers for their 2004 taxes: 84.0%
Here:
84%
State:
70%
(% for various income ranges: 78.0% for AGIs below $10k, 86.7% for AGIs $10k-25k, 84.9% for AGIs $25k-50k, 88.1% for AGIs $50k-75k, 76.5% for AGIs $75k-100k, 100.0% for AGIs over 100k)
Household received Food Stamps/SNAP in the past 12 months: 4 Household did not receive Food Stamps/SNAP in the past 12 months: 461
Women who had a birth in the past 12 months: 20 (12 now married, 7 unmarried) Women who did not have a birth in the past 12 months: 303 (170 now married, 132 unmarried)
Housing units in zip code 52053 with a mortgage: 211 (39 second mortgage, 25 both second mortgage and home equity loan) Houses without a mortgage: 1
Median monthly owner costs for units with a mortgage: $1,504 Median monthly owner costs for units without a mortgage: $543
Residents with income below the poverty level in 2022:
This zip code:
1.2%
Whole state:
11.0%
Residents with income below 50% of the poverty level in 2022:
This zip code:
1.0%
Whole state:
5.5%
Median number of rooms in houses and condos:
Here:
6.6
State:
6.8
Median number of rooms in apartments:
Here:
5.2
State:
4.2
Notable locations in this zip code not listed on our city pages
Notable locations in zip code 52053: Saint John School (A), Buena Vista School (B), Cottage Hill School (C), Flanagan School (D), Hefel School (E), Pershing School (F), Harvestore Grain Elevator (G), Holy Cross Library (H), Holy Cross City Hall (I), Holy Cross - North Buena Vista Fire Department (J). Display/hide their locations on the map
Cemeteries: Immaculate Conception Cemetery (1), Buena Vista Cemetery (2), North Buena Vista Cemetery (3), Holy Cross Catholic Cemetery (4), Floyd Cemetery (5), Cottage Hill Protestant Cemetery (6). Display/hide their locations on the map
Size of family households: 131 2-persons, 84 3-persons, 97 4-persons, 38 5-persons, 8 6-persons, 3 7-or-more-persons
Size of nonfamily households: 87 1-person, 5 2-persons
274 married couples with children.
0 single-parent households ().
99.5% of residents of 52053 zip code speak English at home.
0.5% of residents speak Spanish at home (83% very well, 17% not well).
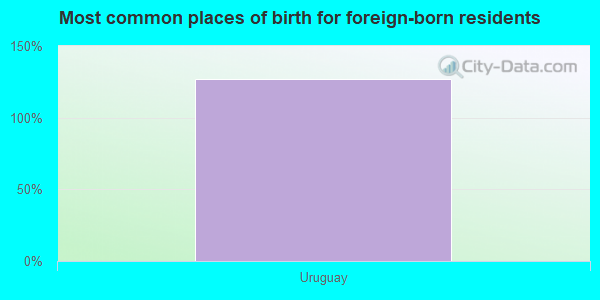
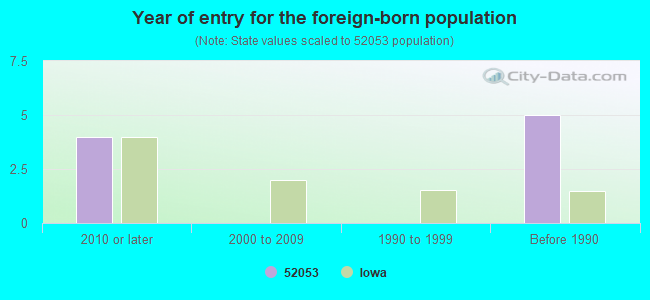
Foreign born population: 11 (0.9%) (55.4% of them are naturalized citizens)
This zip code:
0.9%
Whole state:
6.0%
127%Uruguay
66%German
11%American
8%English
5%Irish
1%Czech
0%Luxembourger
0%Norwegian
Year of entry for the foreign-born population
42010 or later
02000 to 2009
01990 to 1999
5Before 1990
Facilities with environmental interests located in this zip code:
TWIN STATE, INC (27172 THUNDER RD in HOLY CROSS, IA)
(Integrated Compliance Information System) - ICIS-07-2002-0159, FORMAL ENFORCEMENT ACTION
HOLY CROSS CITY OF STP (1/4 MILE NORTH OF INTERSECTION in HOLY CROSS, IA)
National Pollutant Discharge Elimination System NON-MAJOR (Tracking pollutant discharge elimination systems) - permit Business SIC classification: SEWERAGE SYSTEMS Organizations: CITY OF HOLY CROSS (CONTACT/OWNER)
THREE RIVERS FARM SERVICE INCORPORATED (20362 HOLY CROSS ROAD in HOLY CROSS, IA)
(Resource Conservation and Recovery Act (tracking hazardous waste)) Alternative names: THREE RIVERS FS COMPANY HOLY CROSS NH3
Housing units lacking complete plumbing facilities: 0.9% Housing units lacking complete kitchen facilities: 0.9%
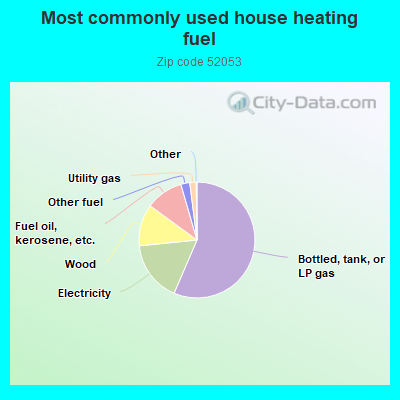
56.7%Bottled, tank, or LP gas
17.0%Electricity
11.7%Wood
10.5%Fuel oil, kerosene, etc.
2.5%Other fuel
1.8%Utility gas
Population in 1990: 1,139. Population change in the 1990s: +38 (+3.3%).
Place of birth for U.S.-born residents:
This state: 1,238
Midwest: 28
South: 41
West: 3
73% of the 52053 zip code residents lived in the same house 5 years ago. Out of people who lived in different houses, 59% lived in this county. Out of people who lived in different counties, 50% lived in Iowa.
89% of the 52053 zip code residents lived in the same house 1 year ago. Out of people who lived in different houses, 96% moved from this county.
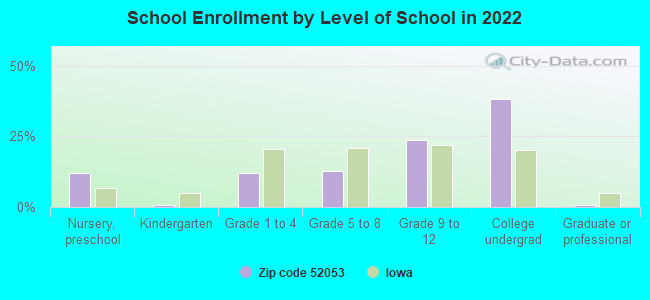
Private vs. public school enrollment:
Students in private schools in grades 1 to 8 (elementary and middle school): 53
Here:
64.0%
Iowa:
10.6%
Students in private schools in grades 9 to 12 (high school): 44
Here:
55.2%
Iowa:
7.9%
Students in private undergraduate colleges: 1
Here:
1.5%
Iowa:
23.9%
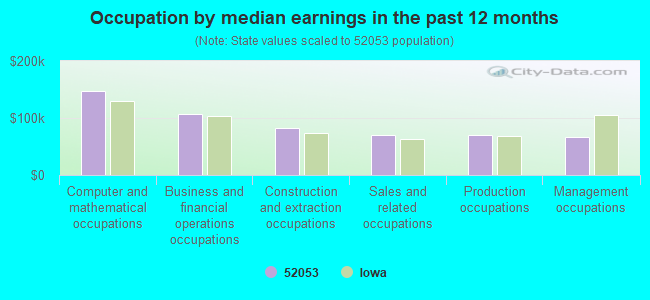
Occupation by median earnings in the past 12 months ($)
147,551Computer and mathematical occupations
107,338Business and financial operations occupations
81,870Construction and extraction occupations
70,056Sales and related occupations
69,461Production occupations
67,072Management occupations
Top industries in this zip code by the number of employees in 2005:
Educational Services: Elementary and Secondary Schools (20-49 employees: 1 establishment)
Wholesale Trade: Farm and Garden Machinery and Equipment Merchant Wholesalers (10-19: 1)
Wholesale Trade: Other Construction Material Merchant Wholesalers (10-19: 1)
Construction: Plumbing, Heating, and Air-Conditioning Contractors (5-9: 1, 1-4: 1)
Construction: New Single-Family Housing Construction (except Operative Builders) (5-9: 1, 1-4: 1)
Accommodation and Food Services: Food Service Contractors (5-9: 1)
Accommodation and Food Services: Drinking Places (Alcoholic Beverages) (5-9: 1)
Home Mortgage Disclosure Act Aggregated Statistics For Year 2009 (Based on 2 partial tracts)
A) FHA, FSA/RHS & VA Home Purchase Loans
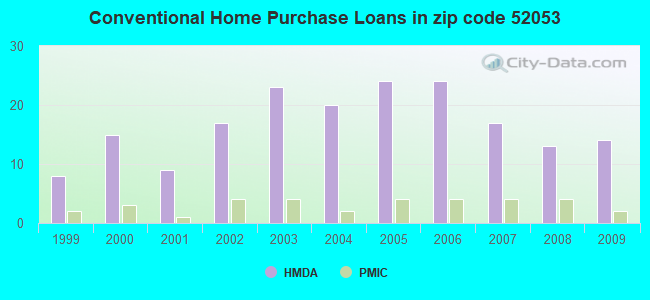
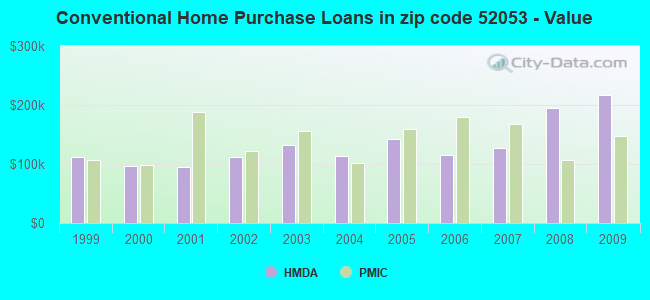
B) Conventional Home Purchase Loans
C) Refinancings
D) Home Improvement Loans
F) Non-occupant Loans on < 5 Family Dwellings (A B C & D)
Number
Average Value
Number
Average Value
Number
Average Value
Number
Average Value
Number
Average Value
LOANS ORIGINATED
4
$139,805
14
$217,229
87
$153,514
2
$18,855
3
$312,937
APPLICATIONS APPROVED, NOT ACCEPTED
0
$0
0
$0
2
$175,655
0
$0
0
$0
APPLICATIONS DENIED
1
$122,070
0
$0
8
$185,269
1
$30,760
0
$0
APPLICATIONS WITHDRAWN
0
$0
0
$0
3
$216,013
1
$31,760
0
$0
FILES CLOSED FOR INCOMPLETENESS
0
$0
0
$0
0
$0
0
$0
0
$0
Aggregated Statistics For Year 2008 (Based on 2 partial tracts)
A) FHA, FSA/RHS & VA Home Purchase Loans
B) Conventional Home Purchase Loans
C) Refinancings
D) Home Improvement Loans
F) Non-occupant Loans on < 5 Family Dwellings (A B C & D)
Number
Average Value
Number
Average Value
Number
Average Value
Number
Average Value
Number
Average Value
LOANS ORIGINATED
1
$216,840
13
$194,778
47
$169,679
2
$61,775
5
$231,230
APPLICATIONS APPROVED, NOT ACCEPTED
0
$0
1
$75,920
1
$177,640
0
$0
0
$0
APPLICATIONS DENIED
0
$0
0
$0
9
$132,651
1
$89,320
0
$0
APPLICATIONS WITHDRAWN
0
$0
0
$0
3
$130,997
1
$151,840
0
$0
FILES CLOSED FOR INCOMPLETENESS
0
$0
0
$0
0
$0
0
$0
0
$0
Aggregated Statistics For Year 2007 (Based on 2 partial tracts)
B) Conventional Home Purchase Loans
C) Refinancings
D) Home Improvement Loans
F) Non-occupant Loans on < 5 Family Dwellings (A B C & D)
G) Loans On Manufactured Home Dwelling (A B C & D)
Number
Average Value
Number
Average Value
Number
Average Value
Number
Average Value
Number
Average Value
LOANS ORIGINATED
17
$127,115
37
$153,648
3
$85,677
3
$99,900
0
$0
APPLICATIONS APPROVED, NOT ACCEPTED
1
$102,710
3
$144,890
0
$0
0
$0
0
$0
APPLICATIONS DENIED
1
$20,340
9
$182,271
2
$19,850
2
$164,740
1
$20,340
APPLICATIONS WITHDRAWN
0
$0
4
$193,395
0
$0
0
$0
0
$0
FILES CLOSED FOR INCOMPLETENESS
0
$0
1
$94,280
0
$0
0
$0
0
$0
Aggregated Statistics For Year 2006 (Based on 2 partial tracts)
A) FHA, FSA/RHS & VA Home Purchase Loans
B) Conventional Home Purchase Loans
C) Refinancings
D) Home Improvement Loans
F) Non-occupant Loans on < 5 Family Dwellings (A B C & D)
Number
Average Value
Number
Average Value
Number
Average Value
Number
Average Value
Number
Average Value
LOANS ORIGINATED
3
$118,593
24
$115,036
40
$137,968
5
$36,520
4
$113,258
APPLICATIONS APPROVED, NOT ACCEPTED
0
$0
1
$235,690
1
$207,410
1
$26,300
0
$0
APPLICATIONS DENIED
0
$0
2
$106,185
9
$136,234
1
$29,280
0
$0
APPLICATIONS WITHDRAWN
0
$0
2
$113,880
6
$143,402
0
$0
1
$66,490
FILES CLOSED FOR INCOMPLETENESS
0
$0
1
$159,280
2
$138,935
0
$0
0
$0
Aggregated Statistics For Year 2005 (Based on 2 partial tracts)
A) FHA, FSA/RHS & VA Home Purchase Loans
B) Conventional Home Purchase Loans
C) Refinancings
D) Home Improvement Loans
F) Non-occupant Loans on < 5 Family Dwellings (A B C & D)
G) Loans On Manufactured Home Dwelling (A B C & D)
Number
Average Value
Number
Average Value
Number
Average Value
Number
Average Value
Number
Average Value
Number
Average Value
LOANS ORIGINATED
1
$129,010
24
$142,658
36
$135,711
1
$141,420
2
$96,760
2
$52,100
APPLICATIONS APPROVED, NOT ACCEPTED
0
$0
0
$0
2
$70,210
1
$14,390
0
$0
0
$0
APPLICATIONS DENIED
0
$0
1
$257,530
14
$130,961
2
$18,360
0
$0
0
$0
APPLICATIONS WITHDRAWN
0
$0
1
$49,620
5
$142,210
0
$0
0
$0
0
$0
FILES CLOSED FOR INCOMPLETENESS
0
$0
0
$0
3
$113,463
0
$0
0
$0
0
$0
Aggregated Statistics For Year 2004 (Based on 2 partial tracts)
A) FHA, FSA/RHS & VA Home Purchase Loans
B) Conventional Home Purchase Loans
C) Refinancings
D) Home Improvement Loans
F) Non-occupant Loans on < 5 Family Dwellings (A B C & D)
G) Loans On Manufactured Home Dwelling (A B C & D)
Number
Average Value
Number
Average Value
Number
Average Value
Number
Average Value
Number
Average Value
Number
Average Value
LOANS ORIGINATED
0
$0
20
$113,034
33
$109,540
5
$59,742
1
$124,050
1
$39,200
APPLICATIONS APPROVED, NOT ACCEPTED
0
$0
1
$84,850
1
$140,920
1
$21,340
0
$0
0
$0
APPLICATIONS DENIED
0
$0
2
$117,845
8
$108,171
1
$24,310
0
$0
0
$0
APPLICATIONS WITHDRAWN
1
$138,440
0
$0
6
$98,082
1
$28,280
0
$0
0
$0
FILES CLOSED FOR INCOMPLETENESS
0
$0
0
$0
1
$200,960
0
$0
0
$0
0
$0
Aggregated Statistics For Year 2003 (Based on 2 partial tracts)
B) Conventional Home Purchase Loans
C) Refinancings
D) Home Improvement Loans
F) Non-occupant Loans on < 5 Family Dwellings (A B C & D)
Number
Average Value
Number
Average Value
Number
Average Value
Number
Average Value
LOANS ORIGINATED
23
$132,852
108
$105,544
3
$62,190
2
$70,955
APPLICATIONS APPROVED, NOT ACCEPTED
0
$0
8
$88,634
2
$12,900
0
$0
APPLICATIONS DENIED
3
$61,033
9
$107,290
1
$39,700
0
$0
APPLICATIONS WITHDRAWN
1
$92,290
7
$114,623
0
$0
0
$0
FILES CLOSED FOR INCOMPLETENESS
0
$0
3
$106,850
0
$0
0
$0
Aggregated Statistics For Year 2002 (Based on 2 partial tracts)
A) FHA, FSA/RHS & VA Home Purchase Loans
B) Conventional Home Purchase Loans
C) Refinancings
D) Home Improvement Loans
F) Non-occupant Loans on < 5 Family Dwellings (A B C & D)
Number
Average Value
Number
Average Value
Number
Average Value
Number
Average Value
Number
Average Value
LOANS ORIGINATED
1
$133,970
17
$111,558
66
$105,811
2
$47,635
2
$55,080
APPLICATIONS APPROVED, NOT ACCEPTED
0
$0
1
$193,520
0
$0
0
$0
0
$0
APPLICATIONS DENIED
0
$0
1
$25,310
5
$128,814
0
$0
1
$25,310
APPLICATIONS WITHDRAWN
0
$0
0
$0
6
$132,403
0
$0
0
$0
FILES CLOSED FOR INCOMPLETENESS
0
$0
0
$0
0
$0
0
$0
0
$0
Aggregated Statistics For Year 2001 (Based on 2 partial tracts)
B) Conventional Home Purchase Loans
C) Refinancings
D) Home Improvement Loans
Number
Average Value
Number
Average Value
Number
Average Value
LOANS ORIGINATED
9
$94,333
58
$94,672
4
$16,250
APPLICATIONS APPROVED, NOT ACCEPTED
0
$0
3
$85,180
0
$0
APPLICATIONS DENIED
1
$123,060
7
$46,289
1
$3,470
APPLICATIONS WITHDRAWN
0
$0
5
$75,620
0
$0
FILES CLOSED FOR INCOMPLETENESS
0
$0
1
$46,640
0
$0
Aggregated Statistics For Year 2000 (Based on 2 partial tracts)
B) Conventional Home Purchase Loans
C) Refinancings
D) Home Improvement Loans
F) Non-occupant Loans on < 5 Family Dwellings (A B C & D)
Number
Average Value
Number
Average Value
Number
Average Value
Number
Average Value
LOANS ORIGINATED
15
$96,230
15
$79,425
1
$34,240
1
$93,290
APPLICATIONS APPROVED, NOT ACCEPTED
1
$84,850
3
$65,663
0
$0
0
$0
APPLICATIONS DENIED
2
$68,725
4
$104,948
2
$14,140
0
$0
APPLICATIONS WITHDRAWN
0
$0
4
$102,218
0
$0
0
$0
FILES CLOSED FOR INCOMPLETENESS
0
$0
0
$0
0
$0
0
$0
Aggregated Statistics For Year 1999 (Based on 1 partial tract)
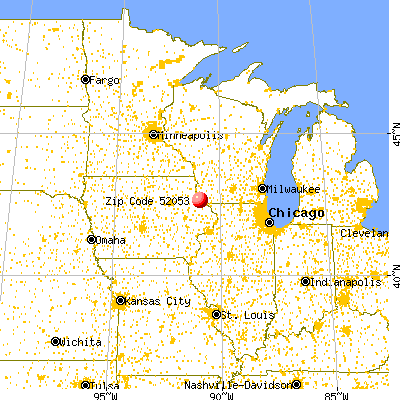


 Nearest zip codes: 52066, 52039, 53806, 52073, 52065, 52045.