Estimated zip code population in 2022: 2,960 Zip code population in 2010: 2,589 Zip code population in 2000: 2,230
Houses and condos: 1,107 Renter-occupied apartments: 225
% of renters here:
20%
State:
28%
March 2022 cost of living index in zip code 52045: 83.6 (less than average, U.S. average is 100)
Land area: 47.8 sq. mi. Water area: 0.0 sq. mi.
Population density: 62 people per square mile
(very low).
OSM Map
General Map
Google Map
MSN Map
OSM Map
General Map
Google Map
MSN Map
OSM Map
General Map
Google Map
MSN Map
OSM Map
General Map
Google Map
MSN Map
Please wait while loading the map...
Real estate property taxes paid for housing units in 2022:
This zip code:
1.1% ($2,706)
Iowa:
1.4% ($2,724)
Median real estate property taxes paid for housing units with mortgages in 2022: $2,966 (1.1%) Median real estate property taxes paid for housing units with no mortgage in 2022: $2,246 (1.1%)
Business Search- 14 Million verified businesses
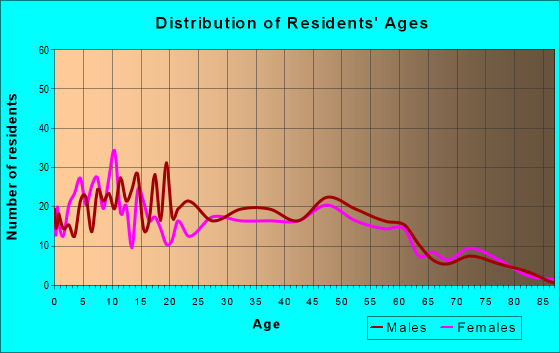
Males: 1,578
(53.3%)
Females: 1,382
(46.7%)
For population 25 years and over in 52045:
High school or higher: 96.7%
Bachelor's degree or higher: 22.8%
Graduate or professional degree: 6.5%
Unemployed: 3.3%
Mean travel time to work (commute): 20.0 minutes
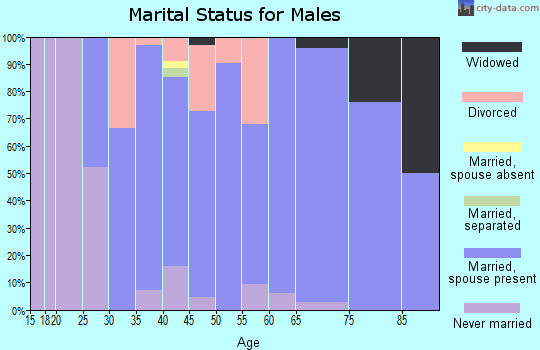
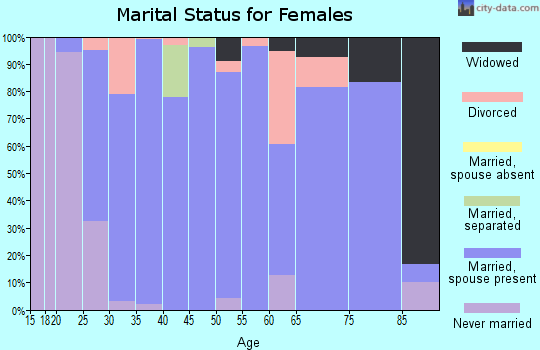
For population 15 years and over in 52045:
Never married: 29.2%
Now married: 55.5%
Separated: 3.0%
Widowed: 6.0%
Divorced: 6.3%
Zip code 52045 compared to state average:
Black race population percentage significantly below state average.
Hispanic race population percentage significantly below state average.
Median age below state average.
Foreign-born population percentage significantly below state average.
Length of stay since moving in significantly above state average.
House age below state average.
Percentage of population with a bachelor's degree or higher below state average.
Estimated median house/condo value in 2022: $249,787
52045:
$249,787
Iowa:
$194,600
According to our research of Iowa and other state lists, there were 3 registered sex offenders living in 52045 zip code as of May 03, 2024. The ratio of all residents to sex offenders in zip code 52045 is 879 to 1. The ratio of registered sex offenders to all residents in this zip code is lower than the state average.
Median resident age:
This zip code:
33.7 years
Iowa median age:
38.9 years
Average household size:
This zip code:
2.6 people
Iowa:
2.3 people
Averages for the 2020 tax year for zip code 52045, filed in 2021:
Average Adjusted Gross Income (AGI) in 2020: $63,995 (Individual Income Tax Returns)
Here:
$63,995
State:
$71,087
Salary/wage: $56,030 (reported on 86.1% of returns)
Here:
$56,030
State:
$57,361
(% of AGI for various income ranges: 1357.0% for AGIs below $25k, 3799.6% for AGIs $25k-50k, 6274.3% for AGIs $50k-75k, 10020.0% for AGIs $75k-100k, 19695.0% for AGIs $100k-200k)
Taxable interest for individuals: $1,237 (reported on 51.6% of returns)
This zip code:
$1,237
Iowa:
$1,633
(% of AGI for various income ranges: 26.5% for AGIs below $25k, 45.7% for AGIs $25k-50k, 137.1% for AGIs $50k-75k, 120.9% for AGIs $75k-100k, 132.1% for AGIs $100k-200k)
Ordinary dividends: $2,244 (reported on 20.5% of returns)
Here:
$2,244
State:
$5,432
(% of AGI for various income ranges: 27.0% for AGIs below $25k, 41.7% for AGIs $25k-50k, 39.3% for AGIs $50k-75k, 46.4% for AGIs $75k-100k, 217.9% for AGIs $100k-200k)
Net capital gain/loss in AGI: +$8,967 (reported on 19.7% of returns)
Here:
+$8,967
State:
+$15,243
(% of AGI for various income ranges: 46.0% for AGIs below $25k, 75.2% for AGIs $25k-50k, 176.4% for AGIs $50k-75k, 255.5% for AGIs $75k-100k, 970.7% for AGIs $100k-200k)
Profit/loss from business: +$9,794 (reported on 14.8% of returns)
Here:
+$9,794
State:
+$11,763
(% of AGI for various income ranges: 118.5% for AGIs below $25k, 105.7% for AGIs $25k-50k, 238.6% for AGIs $50k-75k, 279.1% for AGIs $75k-100k, 458.6% for AGIs $100k-200k)
Taxable individual retirement arrangement distribution: $11,354 (reported on 10.7% of returns)
52045:
$11,354
Iowa:
$17,324
(% of AGI for various income ranges: 97.0% for AGIs below $25k, 109.6% for AGIs $25k-50k, 220.7% for AGIs $50k-75k, 655.5% for AGIs $75k-100k)
Total itemized deductions: $28,775 (reported on 3.3% of returns)
Here:
$28,775
State:
$33,775
(% of AGI for various income ranges: 822.1% for AGIs $50k-75k)
Charity contributions: $6,267 (reported on 2.5% of returns)
Here:
$6,267
State:
$13,075
(% of AGI for various income ranges: 134.3% for AGIs $50k-75k)
Taxes paid: $5,800 (reported on 3.3% of returns)
52045:
$5,800
State:
$7,704
(% of AGI for various income ranges: 165.7% for AGIs $50k-75k)
Earned income credit: $1,950 (reported on 8.2% of returns)
Here:
$1,950
State:
$2,195
(% of AGI for various income ranges: 35.5% for AGIs below $25k, 53.9% for AGIs $25k-50k)
Percentage of individuals using paid preparers for their 2020 taxes: 97.5%
Here:
98%
State:
95%
(% for various income ranges: 97.0% for AGIs below $25k, 96.7% for AGIs $25k-50k, 100.0% for AGIs $50k-75k, 100.0% for AGIs $75k-100k, 95.5% for AGIs $100k-200k, 100.0% for AGIs over 200k)
Averages for the 2012 tax year for zip code 52045, filed in 2013:
Average Adjusted Gross Income (AGI) in 2012: $54,115 (Individual Income Tax Returns)
Here:
$54,115
State:
$58,860
Salary/wage: $45,554 (reported on 88.6% of returns)
Here:
$45,554
State:
$46,659
(% of AGI for various income ranges: 80.2% for AGIs below $25k, 78.0% for AGIs $25k-50k, 83.4% for AGIs $50k-75k, 87.8% for AGIs $75k-100k, 56.9% for AGIs $100k-200k)
Taxable interest for individuals: $1,206 (reported on 54.4% of returns)
This zip code:
$1,206
Iowa:
$1,537
(% of AGI for various income ranges: 2.0% for AGIs below $25k, 1.4% for AGIs $25k-50k, 1.5% for AGIs $50k-75k, 0.7% for AGIs $75k-100k, 1.1% for AGIs $100k-200k)
Ordinary dividends: $1,614 (reported on 19.3% of returns)
Here:
$1,614
State:
$4,542
(% of AGI for various income ranges: 0.6% for AGIs below $25k, 0.6% for AGIs $25k-50k, 0.4% for AGIs $50k-75k, 0.3% for AGIs $75k-100k, 0.9% for AGIs $100k-200k)
Net capital gain/loss in AGI: +$8,079 (reported on 16.7% of returns)
Here:
+$8,079
State:
+$11,802
(% of AGI for various income ranges: 0.1% for AGIs below $25k, 1.7% for AGIs $25k-50k, 2.6% for AGIs $50k-75k, 1.4% for AGIs $75k-100k, 4.1% for AGIs $100k-200k)
Profit/loss from business: +$4,367 (reported on 15.8% of returns)
Here:
+$4,367
State:
+$10,509
(% of AGI for various income ranges: 6.1% for AGIs below $25k, 1.9% for AGIs $25k-50k, 1.0% for AGIs $50k-75k, 1.3% for AGIs $75k-100k)
Taxable individual retirement arrangement distribution: $6,520 (reported on 8.8% of returns)
52045:
$6,520
Iowa:
$11,773
(% of AGI for various income ranges: 1.9% for AGIs below $25k, 2.7% for AGIs $25k-50k, 2.2% for AGIs $75k-100k)
Total itemized deductions: $17,841 (19% of AGI, reported on 29.8% of returns)
Here:
$17,841
State:
$21,278
Here:
19.1% of AGI
State:
18.9% of AGI
(% of AGI for various income ranges: 7.3% for AGIs below $25k, 10.8% for AGIs $25k-50k, 8.5% for AGIs $50k-75k, 10.8% for AGIs $75k-100k, 10.1% for AGIs $100k-200k)
Charity contributions: $2,393 (reported on 25.4% of returns)
Here:
$2,393
State:
$4,044
(% of AGI for various income ranges: 0.6% for AGIs below $25k, 1.2% for AGIs $25k-50k, 1.0% for AGIs $50k-75k, 0.9% for AGIs $75k-100k, 1.5% for AGIs $100k-200k)
Taxes paid: $6,869 (reported on 30.7% of returns)
52045:
$6,869
State:
$8,846
(% of AGI for various income ranges: 1.2% for AGIs below $25k, 2.6% for AGIs $25k-50k, 3.1% for AGIs $50k-75k, 4.2% for AGIs $75k-100k, 5.6% for AGIs $100k-200k)
Earned income credit: $1,636 (reported on 12.3% of returns)
Here:
$1,636
State:
$2,098
(% of AGI for various income ranges: 3.2% for AGIs below $25k, 0.8% for AGIs $25k-50k)
Percentage of individuals using paid preparers for their 2012 taxes: 71.9%
Here:
72%
State:
65%
(% for various income ranges: 59.5% for AGIs below $25k, 75.9% for AGIs $25k-50k, 77.3% for AGIs $50k-75k, 80.0% for AGIs $75k-100k, 81.8% for AGIs $100k-200k)
Averages for the 2004 tax year for zip code 52045, filed in 2005:
Average Adjusted Gross Income (AGI) in 2004: $38,265 (Individual Income Tax Returns)
Here:
$38,265
State:
$43,875
Salary/wage: $33,641 (reported on 88.2% of returns)
Here:
$33,641
State:
$38,265
(% of AGI for various income ranges: 139.9% for AGIs below $10k, 77.7% for AGIs $10k-25k, 80.7% for AGIs $25k-50k, 84.6% for AGIs $50k-75k, 86.1% for AGIs $75k-100k, 45.3% for AGIs over 100k)
Taxable interest for individuals: $1,462 (reported on 64.5% of returns)
This zip code:
$1,462
Iowa:
$1,768
(% of AGI for various income ranges: 4.7% for AGIs below $10k, 7.5% for AGIs $10k-25k, 2.0% for AGIs $25k-50k, 1.4% for AGIs $50k-75k, 1.2% for AGIs $75k-100k, 3.0% for AGIs over 100k)
Taxable dividends: $938 (reported on 23.5% of returns)
Here:
$938
State:
$2,510
(% of AGI for various income ranges: 2.5% for AGIs below $10k, 1.1% for AGIs $10k-25k, 0.5% for AGIs $25k-50k, 0.2% for AGIs $50k-75k, 0.2% for AGIs $75k-100k, 1.2% for AGIs over 100k)
Net capital gain/loss: +$8,350 (reported on 20.5% of returns)
Here:
+$8,350
State:
+$6,139
(% of AGI for various income ranges: 5.3% for AGIs below $10k, 3.0% for AGIs $10k-25k, 2.5% for AGIs $25k-50k, 2.6% for AGIs $50k-75k, 1.3% for AGIs $75k-100k, 14.4% for AGIs over 100k)
Profit/loss from business: +$5,743 (reported on 14.0% of returns)
Here:
+$5,743
State:
+$8,574
(% of AGI for various income ranges: -0.6% for AGIs below $10k, 2.1% for AGIs $10k-25k, 4.4% for AGIs $25k-50k, 1.5% for AGIs $50k-75k, 2.1% for AGIs $75k-100k)
IRA payment deduction: $2,723 (reported on 4.3% of returns)
52045:
$2,723
Iowa:
$2,970
Total itemized deductions: $13,935 (22% of AGI, reported on 28.5% of returns)
Here:
$13,935
State:
$16,976
Here:
21.7% of AGI
State:
20.8% of AGI
(% of AGI for various income ranges: 9.4% for AGIs $10k-25k, 9.7% for AGIs $25k-50k, 11.6% for AGIs $50k-75k, 14.3% for AGIs $75k-100k, 7.3% for AGIs over 100k)
Charity contributions deductions: $1,678 (2% of AGI, reported on 25.1% of returns)
Here:
$1,678
State:
$3,089
Here:
2.5% of AGI
State:
3.6% of AGI
(% of AGI for various income ranges: 0.9% for AGIs $10k-25k, 0.8% for AGIs $25k-50k, 1.2% for AGIs $50k-75k, 1.7% for AGIs $75k-100k, 1.1% for AGIs over 100k)
Total tax: $4,313 (reported on 76.6% of returns)
52045:
$4,313
State:
$6,177
(% of AGI for various income ranges: 4.5% for AGIs below $10k, 4.2% for AGIs $10k-25k, 6.2% for AGIs $25k-50k, 6.7% for AGIs $50k-75k, 9.0% for AGIs $75k-100k, 18.4% for AGIs over 100k)
Earned income credit: $1,259 (reported on 9.9% of returns)
Here:
$1,259
State:
$1,540
Percentage of individuals using paid preparers for their 2004 taxes: 74.9%
Here:
75%
State:
70%
(% for various income ranges: 60.5% for AGIs below $10k, 74.7% for AGIs $10k-25k, 77.2% for AGIs $25k-50k, 85.0% for AGIs $50k-75k, 79.7% for AGIs $75k-100k, 84.2% for AGIs over 100k)
Household received Food Stamps/SNAP in the past 12 months: 19 Household did not receive Food Stamps/SNAP in the past 12 months: 1,102
Women who had a birth in the past 12 months: 34 (35 now married, 0 unmarried) Women who did not have a birth in the past 12 months: 643 (334 now married, 307 unmarried)
Housing units in zip code 52045 with a mortgage: 561 (97 second mortgage, 98 both second mortgage and home equity loan) Houses without a mortgage: 13
Median monthly owner costs for units with a mortgage: $1,478 Median monthly owner costs for units without a mortgage: $569
Residents with income below the poverty level in 2022:
This zip code:
10.6%
Whole state:
11.0%
Residents with income below 50% of the poverty level in 2022:
This zip code:
2.6%
Whole state:
5.5%
Median number of rooms in houses and condos:
Here:
6.8
State:
6.8
Median number of rooms in apartments:
Here:
4.6
State:
4.2
Notable locations in this zip code not listed on our city pages
Notable locations in zip code 52045: Camp Little Cloud (A), South Lane Farm (B), Am Dar Farm (C), Eagle School (D), Epworth (E), Epworth Emergency Service (F), Epworth Police Department (G), Matthew Jacoby Memorial Library (H), Epworth Fire Department (I). Display/hide their locations on the map
Churches in zip code 52045 include: Grace Lutheran Church (A), Saint Patrick Catholic Church (B), Epworth United Methodist Chuch (C), Saint Johns Catholic Church (D). Display/hide their locations on the map
Cemeteries: Epworth Cemetery (1), Highview Cemetery (2), Saint Patricks Cemetery (3), Saint Johns Catholic Placid Cemetery (4), Saint Clement Catholic Cemetery (5), Fagen Property Cemetery (6), Tivoli Cemetery (7). Display/hide their locations on the map
542 married couples with children.
269 single-parent households (115 men, 154 women).
98.0% of residents of 52045 zip code speak English at home.
0.7% of residents speak Spanish at home (100% very well).
0.7% of residents speak other Indo-European language at home (100% very well).
Foreign born population: 1 (0.0%) (100.0% of them are naturalized citizens)
This zip code:
0.0%
Whole state:
6.0%
58%German
19%Irish
7%American
4%English
2%European
1%Scottish
0%Italian
Year of entry for the foreign-born population
02010 or later
02000 to 2009
01990 to 1999
4Before 1990
Facilities with environmental interests located in this zip code:
BANKSTON CITY OF STP (BANKSTON PARK RD in EPWORTH, IA)
National Pollutant Discharge Elimination System NON-MAJOR (Tracking pollutant discharge elimination systems) - permit Business SIC classification: SEWERAGE SYSTEMS Organizations: CITY OF BANKSTON (CONTACT/OWNER)
THREE RIVERS FARM SERVICE INC (303 N CENTER in EPWORTH, IA)
(Resource Conservation and Recovery Act (tracking hazardous waste))
DEVINE WORD COLLEGE (102 JACOBY DRIVE in EPWORTH, IA)
COMPLIANCE ACTIVITY (Tracking inspections of insecticide, fungicide, and rodenticide, and toxic substances)
DIVINE WORD COLLEGE (SOUTH CENTRAL AVENUE in EPWORTH, IA)
COMPLIANCE ACTIVITY (Tracking inspections of insecticide, fungicide, and rodenticide, and toxic substances)
55.8%Utility gas
25.9%Electricity
15.1%Bottled, tank, or LP gas
2.1%Fuel oil, kerosene, etc.
0.9%No fuel used
Population in 1990: 1,931. Population change in the 1990s: +299 (+15.5%).
Place of birth for U.S.-born residents:
This state: 2,643
Northeast: 44
Midwest: 166
South: 59
West: 42
74% of the 52045 zip code residents lived in the same house 5 years ago. Out of people who lived in different houses, 83% lived in this county. Out of people who lived in different counties, 50% lived in Iowa.
96% of the 52045 zip code residents lived in the same house 1 year ago. Out of people who lived in different houses, 51% moved from this county. Out of people who lived in different houses, 22% moved from different county within same state. Out of people who lived in different houses, 31% moved from different state.
Private vs. public school enrollment:
Students in private schools in grades 1 to 8 (elementary and middle school): 217
Here:
39.9%
Iowa:
10.6%
Students in private schools in grades 9 to 12 (high school): 140
Here:
46.4%
Iowa:
7.9%
Students in private undergraduate colleges: 83
Here:
61.4%
Iowa:
23.9%
Occupation by median earnings in the past 12 months ($)
79,889Architecture and engineering occupations
78,963Management occupations
70,669Computer and mathematical occupations
69,989Transportation occupations
69,938Installation, maintenance, and repair occupations
63,380Construction and extraction occupations
Top industries in this zip code by the number of employees in 2005:
Educational Services: Colleges, Universities, and Professional Schools (50-99 employees: 1 establishment)
Accommodation and Food Services: Limited-Service Restaurants (10-19: 1)
Administrative and Support and Waste Management and Remediation Services: Professional Employer Organizations (10-19: 1)
Wholesale Trade: Farm and Garden Machinery and Equipment Merchant Wholesalers (10-19: 1)
Other Services (except Public Administration): Religious Organizations (5-9: 1, 1-4: 4)
Finance and Insurance: Commercial Banking (5-9: 1, 1-4: 1)
Construction: Site Preparation Contractors (5-9: 1, 1-4: 1)
Health Care and Social Assistance: Offices of Dentists (5-9: 1)
People in group quarters in 2010:
109 people in college/university student housing
6 people in other noninstitutional facilities
People in group quarters in 2000:
84 people in college dormitories (includes college quarters off campus)
17 people in other nonhousehold living situations
Fatal accident statistics in 2014:
Fatal accident count: 2
Vehicles involved in fatal accidents: 3
Fatal accidents caused by drunken drivers: 2
Fatalities: 5
Persons involved in fatal accidents: 8
Pedestrians involved in fatal accidents: 0
Home Mortgage Disclosure Act Aggregated Statistics For Year 2009 (Based on 4 partial tracts)
A) FHA, FSA/RHS & VA Home Purchase Loans
B) Conventional Home Purchase Loans
C) Refinancings
D) Home Improvement Loans
F) Non-occupant Loans on < 5 Family Dwellings (A B C & D)
G) Loans On Manufactured Home Dwelling (A B C & D)
Number
Average Value
Number
Average Value
Number
Average Value
Number
Average Value
Number
Average Value
Number
Average Value
LOANS ORIGINATED
25
$169,032
78
$166,172
464
$156,062
17
$61,412
8
$97,406
1
$13,820
APPLICATIONS APPROVED, NOT ACCEPTED
1
$137,710
2
$117,750
7
$150,827
1
$49,460
1
$87,080
0
$0
APPLICATIONS DENIED
8
$143,216
4
$140,848
31
$151,151
1
$1,870
0
$0
1
$21,150
APPLICATIONS WITHDRAWN
1
$103,870
5
$212,796
46
$135,520
1
$116,310
1
$31,100
1
$67,180
FILES CLOSED FOR INCOMPLETENESS
0
$0
1
$48,520
1
$80,240
0
$0
0
$0
0
$0
Aggregated Statistics For Year 2008 (Based on 4 partial tracts)
A) FHA, FSA/RHS & VA Home Purchase Loans
B) Conventional Home Purchase Loans
C) Refinancings
D) Home Improvement Loans
E) Loans on Dwellings For 5+ Families
F) Non-occupant Loans on < 5 Family Dwellings (A B C & D)
G) Loans On Manufactured Home Dwelling (A B C & D)
Number
Average Value
Number
Average Value
Number
Average Value
Number
Average Value
Number
Average Value
Number
Average Value
Number
Average Value
LOANS ORIGINATED
16
$140,506
101
$151,521
177
$157,615
11
$32,174
1
$535,080
11
$172,371
3
$33,893
APPLICATIONS APPROVED, NOT ACCEPTED
1
$42,300
4
$115,498
6
$148,115
1
$57,610
0
$0
1
$89,570
0
$0
APPLICATIONS DENIED
1
$95,170
7
$96,677
34
$144,712
3
$120,263
0
$0
1
$16,170
3
$18,463
APPLICATIONS WITHDRAWN
2
$109,785
6
$172,432
23
$174,868
0
$0
0
$0
1
$65,930
0
$0
FILES CLOSED FOR INCOMPLETENESS
0
$0
1
$120,510
4
$169,962
0
$0
0
$0
0
$0
0
$0
Aggregated Statistics For Year 2007 (Based on 4 partial tracts)
A) FHA, FSA/RHS & VA Home Purchase Loans
B) Conventional Home Purchase Loans
C) Refinancings
D) Home Improvement Loans
E) Loans on Dwellings For 5+ Families
F) Non-occupant Loans on < 5 Family Dwellings (A B C & D)
G) Loans On Manufactured Home Dwelling (A B C & D)
Number
Average Value
Number
Average Value
Number
Average Value
Number
Average Value
Number
Average Value
Number
Average Value
Number
Average Value
LOANS ORIGINATED
4
$163,690
134
$143,823
120
$140,556
14
$42,396
1
$98,280
10
$156,008
4
$37,475
APPLICATIONS APPROVED, NOT ACCEPTED
0
$0
7
$191,961
13
$139,426
2
$18,970
0
$0
0
$0
1
$45,060
APPLICATIONS DENIED
0
$0
6
$99,813
28
$108,206
6
$54,675
0
$0
0
$0
2
$42,605
APPLICATIONS WITHDRAWN
0
$0
7
$125,960
14
$160,930
3
$60,453
0
$0
0
$0
0
$0
FILES CLOSED FOR INCOMPLETENESS
0
$0
1
$73,790
6
$133,230
0
$0
0
$0
0
$0
0
$0
Aggregated Statistics For Year 2006 (Based on 4 partial tracts)
A) FHA, FSA/RHS & VA Home Purchase Loans
B) Conventional Home Purchase Loans
C) Refinancings
D) Home Improvement Loans
E) Loans on Dwellings For 5+ Families
F) Non-occupant Loans on < 5 Family Dwellings (A B C & D)
G) Loans On Manufactured Home Dwelling (A B C & D)
Number
Average Value
Number
Average Value
Number
Average Value
Number
Average Value
Number
Average Value
Number
Average Value
Number
Average Value
LOANS ORIGINATED
4
$149,710
167
$137,737
95
$116,090
21
$42,802
2
$6,410,020
13
$139,141
3
$9,510
APPLICATIONS APPROVED, NOT ACCEPTED
0
$0
7
$175,036
9
$120,784
2
$48,825
0
$0
0
$0
0
$0
APPLICATIONS DENIED
0
$0
5
$46,956
38
$151,179
5
$60,564
0
$0
1
$9,330
1
$17,500
APPLICATIONS WITHDRAWN
0
$0
4
$162,475
24
$138,478
0
$0
0
$0
0
$0
0
$0
FILES CLOSED FOR INCOMPLETENESS
0
$0
2
$160,785
9
$170,722
0
$0
0
$0
1
$223,920
0
$0
Aggregated Statistics For Year 2005 (Based on 4 partial tracts)
A) FHA, FSA/RHS & VA Home Purchase Loans
B) Conventional Home Purchase Loans
C) Refinancings
D) Home Improvement Loans
F) Non-occupant Loans on < 5 Family Dwellings (A B C & D)
G) Loans On Manufactured Home Dwelling (A B C & D)
Number
Average Value
Number
Average Value
Number
Average Value
Number
Average Value
Number
Average Value
Number
Average Value
LOANS ORIGINATED
6
$123,502
145
$138,652
105
$124,077
8
$29,581
6
$116,108
3
$27,960
APPLICATIONS APPROVED, NOT ACCEPTED
0
$0
7
$122,446
12
$89,862
1
$46,630
1
$108,850
0
$0
APPLICATIONS DENIED
0
$0
14
$104,447
37
$129,847
5
$87,844
0
$0
4
$27,990
APPLICATIONS WITHDRAWN
1
$286,120
5
$191,188
31
$122,200
1
$27,990
1
$84,590
0
$0
FILES CLOSED FOR INCOMPLETENESS
0
$0
1
$55,980
7
$183,953
1
$73,370
0
$0
0
$0
Aggregated Statistics For Year 2004 (Based on 4 partial tracts)
A) FHA, FSA/RHS & VA Home Purchase Loans
B) Conventional Home Purchase Loans
C) Refinancings
D) Home Improvement Loans
E) Loans on Dwellings For 5+ Families
F) Non-occupant Loans on < 5 Family Dwellings (A B C & D)
G) Loans On Manufactured Home Dwelling (A B C & D)
Number
Average Value
Number
Average Value
Number
Average Value
Number
Average Value
Number
Average Value
Number
Average Value
Number
Average Value
LOANS ORIGINATED
2
$179,680
132
$142,713
176
$121,971
14
$35,721
1
$414,250
15
$143,049
4
$20,968
APPLICATIONS APPROVED, NOT ACCEPTED
0
$0
5
$143,906
15
$104,148
2
$43,540
0
$0
0
$0
1
$70,290
APPLICATIONS DENIED
1
$139,950
11
$44,672
45
$102,954
5
$71,904
0
$0
0
$0
9
$35,913
APPLICATIONS WITHDRAWN
0
$0
3
$87,507
17
$131,384
1
$49,760
0
$0
0
$0
0
$0
FILES CLOSED FOR INCOMPLETENESS
0
$0
1
$187,840
8
$133,220
1
$71,530
0
$0
0
$0
0
$0
Aggregated Statistics For Year 2003 (Based on 4 partial tracts)
A) FHA, FSA/RHS & VA Home Purchase Loans
B) Conventional Home Purchase Loans
C) Refinancings
D) Home Improvement Loans
E) Loans on Dwellings For 5+ Families
F) Non-occupant Loans on < 5 Family Dwellings (A B C & D)
Number
Average Value
Number
Average Value
Number
Average Value
Number
Average Value
Number
Average Value
Number
Average Value
LOANS ORIGINATED
4
$103,045
143
$128,754
495
$118,518
17
$49,394
1
$84,650
8
$76,491
APPLICATIONS APPROVED, NOT ACCEPTED
0
$0
6
$109,575
8
$96,606
0
$0
0
$0
0
$0
APPLICATIONS DENIED
0
$0
3
$74,707
43
$99,999
3
$19,057
0
$0
0
$0
APPLICATIONS WITHDRAWN
0
$0
6
$96,963
29
$106,038
0
$0
0
$0
0
$0
FILES CLOSED FOR INCOMPLETENESS
0
$0
1
$106,360
4
$85,590
0
$0
0
$0
1
$106,360
Aggregated Statistics For Year 2002 (Based on 4 partial tracts)
A) FHA, FSA/RHS & VA Home Purchase Loans
B) Conventional Home Purchase Loans
C) Refinancings
D) Home Improvement Loans
F) Non-occupant Loans on < 5 Family Dwellings (A B C & D)
Number
Average Value
Number
Average Value
Number
Average Value
Number
Average Value
Number
Average Value
LOANS ORIGINATED
3
$132,280
108
$120,767
291
$116,643
14
$44,361
7
$66,814
APPLICATIONS APPROVED, NOT ACCEPTED
0
$0
7
$132,664
10
$111,215
0
$0
0
$0
APPLICATIONS DENIED
0
$0
11
$70,206
31
$111,274
4
$23,338
2
$37,940
APPLICATIONS WITHDRAWN
0
$0
8
$104,530
17
$97,289
3
$29,073
0
$0
FILES CLOSED FOR INCOMPLETENESS
0
$0
0
$0
4
$109,582
0
$0
0
$0
Aggregated Statistics For Year 2001 (Based on 4 partial tracts)
A) FHA, FSA/RHS & VA Home Purchase Loans
B) Conventional Home Purchase Loans
C) Refinancings
D) Home Improvement Loans
E) Loans on Dwellings For 5+ Families
F) Non-occupant Loans on < 5 Family Dwellings (A B C & D)
Number
Average Value
Number
Average Value
Number
Average Value
Number
Average Value
Number
Average Value
Number
Average Value
LOANS ORIGINATED
8
$102,631
97
$121,094
212
$109,411
9
$20,173
1
$91,430
2
$57,080
APPLICATIONS APPROVED, NOT ACCEPTED
0
$0
2
$57,225
8
$92,059
0
$0
0
$0
0
$0
APPLICATIONS DENIED
0
$0
8
$49,294
22
$99,350
2
$10,455
0
$0
1
$7,460
APPLICATIONS WITHDRAWN
1
$45,410
5
$117,084
12
$88,843
1
$46,650
0
$0
0
$0
FILES CLOSED FOR INCOMPLETENESS
0
$0
1
$96,410
1
$45,410
0
$0
0
$0
0
$0
Aggregated Statistics For Year 2000 (Based on 4 partial tracts)
A) FHA, FSA/RHS & VA Home Purchase Loans
B) Conventional Home Purchase Loans
C) Refinancings
D) Home Improvement Loans
F) Non-occupant Loans on < 5 Family Dwellings (A B C & D)
Number
Average Value
Number
Average Value
Number
Average Value
Number
Average Value
Number
Average Value
LOANS ORIGINATED
5
$125,700
75
$101,831
39
$85,366
9
$11,026
2
$74,950
APPLICATIONS APPROVED, NOT ACCEPTED
0
$0
3
$93,843
4
$65,195
2
$53,490
0
$0
APPLICATIONS DENIED
1
$54,740
6
$67,997
14
$75,995
5
$13,408
1
$37,320
APPLICATIONS WITHDRAWN
0
$0
6
$106,813
16
$77,786
1
$5,440
0
$0
FILES CLOSED FOR INCOMPLETENESS
0
$0
1
$64,070
1
$76,320
0
$0
0
$0
Aggregated Statistics For Year 1999 (Based on 2 partial tracts)
A) FHA, FSA/RHS & VA Home Purchase Loans
B) Conventional Home Purchase Loans
C) Refinancings
D) Home Improvement Loans
F) Non-occupant Loans on < 5 Family Dwellings (A B C & D)
Detailed PMIC statistics for the following Tracts:0102.00
, 0103.00
2002 - 2018 National Fire Incident Reporting System (NFIRS) incidents
According to the data from the years 2002 - 2018 the average number of fire incidents per year is 7. The highest number of fire incidents - 16 took place in 2003, and the least - 2 in 2013. The data has a dropping trend.
When looking into fire subcategories, the most incidents belonged to: Structure Fires (38.4%), and Outside Fires (38.4%).
Fire incident types reported to NFIRS in Zip Code 52045


 Nearest zip codes: 52046, 52039, 52068, 52053, 52002, 52078.


 According to the data from the years 2002 - 2018 the average number of fire incidents per year is 7. The highest number of fire incidents - 16 took place in 2003, and the least - 2 in 2013. The data has a dropping trend.
 When looking into fire subcategories, the most incidents belonged to: Structure Fires (38.4%), and Outside Fires (38.4%).