Estimated zip code population in 2022: 613 Zip code population in 2010: 898 Zip code population in 2000: 913
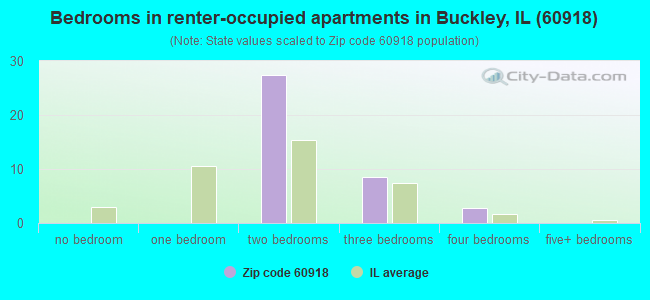
Houses and condos: 324 Renter-occupied apartments: 39
% of renters here:
14%
State:
33%
March 2022 cost of living index in zip code 60918: 84.0 (less than average, U.S. average is 100)
Land area: 50.7 sq. mi. Water area: 0.1 sq. mi.
Population density: 12 people per square mile
(very low).
OSM Map
General Map
Google Map
MSN Map
OSM Map
General Map
Google Map
MSN Map
OSM Map
General Map
Google Map
MSN Map
OSM Map
General Map
Google Map
MSN Map
Please wait while loading the map...
Real estate property taxes paid for housing units in 2022:
This zip code:
2.3% ($2,241)
Illinois:
2.0% ($4,912)
Median real estate property taxes paid for housing units with mortgages in 2022: $2,296 (2.4%) Median real estate property taxes paid for housing units with no mortgage in 2022: $2,270 (2.3%)
Business Search- 14 Million verified businesses
Males: 308
(50.3%)
Females: 304
(49.7%)
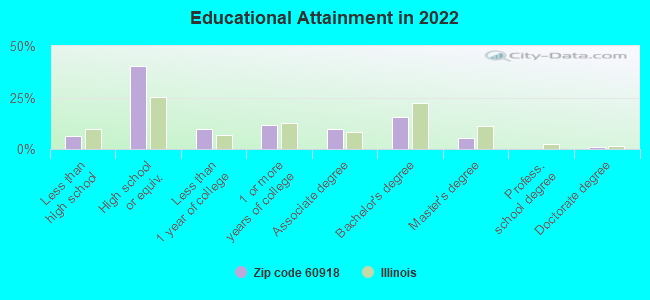
For population 25 years and over in 60918:
High school or higher: 92.9%
Bachelor's degree or higher: 22.2%
Graduate or professional degree: 6.7%
Unemployed: 2.7%
Mean travel time to work (commute): 29.3 minutes
For population 15 years and over in 60918:
Never married: 16.5%
Now married: 62.9%
Separated: 3.2%
Widowed: 9.2%
Divorced: 8.2%
Zip code 60918 compared to state average:
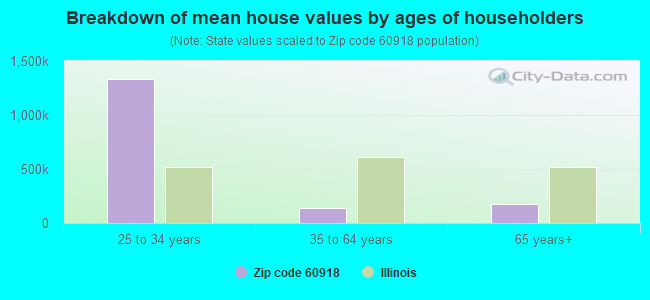
Median house value significantly below state average.
Unemployed percentage below state average.
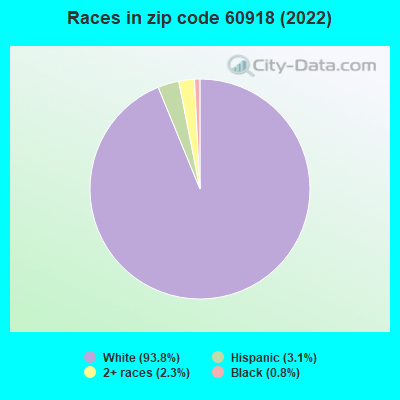
Black race population percentage significantly below state average.
Hispanic race population percentage significantly below state average.
Median age significantly above state average.
Foreign-born population percentage significantly below state average.
Renting percentage significantly below state average.
Length of stay since moving in significantly above state average.
Number of college students below state average.
Percentage of population with a bachelor's degree or higher below state average.
Estimated median house/condo value in 2022: $98,388
60918:
$98,388
Illinois:
$251,600
According to our research of Illinois and other state lists, there was 1 registered sex offender living in 60918 zip code as of May 30, 2024. The ratio of all residents to sex offenders in zip code 60918 is 821 to 1. The ratio of registered sex offenders to all residents in this zip code is near the state average.
Median resident age:
This zip code:
55.3 years
Illinois median age:
39.1 years
Average household size:
This zip code:
2.2 people
Illinois:
2.4 people
Averages for the 2020 tax year for zip code 60918, filed in 2021:
Average Adjusted Gross Income (AGI) in 2020: $57,461 (Individual Income Tax Returns)
Here:
$57,461
State:
$82,626
Salary/wage: $43,433 (reported on 75.0% of returns)
Here:
$43,433
State:
$66,640
(% of AGI for various income ranges: 934.5% for AGIs below $25k, 3702.9% for AGIs $25k-50k, 6220.0% for AGIs $50k-75k, 10005.0% for AGIs $75k-100k, 18673.3% for AGIs $100k-200k)
Taxable interest for individuals: $1,253 (reported on 38.6% of returns)
This zip code:
$1,253
Illinois:
$2,376
(% of AGI for various income ranges: 20.9% for AGIs below $25k, 11.4% for AGIs $25k-50k, 68.0% for AGIs $50k-75k, 493.3% for AGIs $100k-200k)
Ordinary dividends: $1,845 (reported on 25.0% of returns)
Here:
$1,845
State:
$9,061
(% of AGI for various income ranges: 30.0% for AGIs below $25k, 114.0% for AGIs $50k-75k, 376.7% for AGIs $100k-200k)
Net capital gain/loss in AGI: +$4,700 (reported on 20.5% of returns)
Here:
+$4,700
State:
+$31,684
(% of AGI for various income ranges: 136.0% for AGIs $50k-75k, 1183.3% for AGIs $100k-200k)
Profit/loss from business: +$5,771 (reported on 15.9% of returns)
Here:
+$5,771
State:
+$12,175
(% of AGI for various income ranges: 185.5% for AGIs below $25k, 138.6% for AGIs $25k-50k, 515.0% for AGIs $75k-100k)
Taxable individual retirement arrangement distribution: $15,033 (reported on 13.6% of returns)
60918:
$15,033
Illinois:
$21,613
(% of AGI for various income ranges: 131.8% for AGIs below $25k, 310.0% for AGIs $25k-50k, 2700.0% for AGIs $75k-100k)
Earned income credit: $2,225 (reported on 18.2% of returns)
Here:
$2,225
State:
$2,311
(% of AGI for various income ranges: 101.8% for AGIs below $25k, 94.3% for AGIs $25k-50k)
Percentage of individuals using paid preparers for their 2020 taxes: 93.2%
Here:
93%
State:
93%
(% for various income ranges: 93.3% for AGIs below $25k, 90.0% for AGIs $25k-50k, 87.5% for AGIs $50k-75k, 100.0% for AGIs $75k-100k, 100.0% for AGIs $100k-200k)
Averages for the 2012 tax year for zip code 60918, filed in 2013:
Average Adjusted Gross Income (AGI) in 2012: $52,637 (Individual Income Tax Returns)
Here:
$52,637
State:
$68,058
Salary/wage: $35,297 (reported on 79.1% of returns)
Here:
$35,297
State:
$55,396
(% of AGI for various income ranges: 64.6% for AGIs below $25k, 74.5% for AGIs $25k-50k, 68.6% for AGIs $50k-75k, 65.6% for AGIs $75k-100k, 24.0% for AGIs $100k-200k)
Taxable interest for individuals: $1,381 (reported on 48.8% of returns)
This zip code:
$1,381
Illinois:
$1,969
(% of AGI for various income ranges: 1.9% for AGIs below $25k, 1.1% for AGIs $25k-50k, 0.8% for AGIs $50k-75k, 0.4% for AGIs $75k-100k, 2.0% for AGIs $100k-200k)
Ordinary dividends: $1,508 (reported on 30.2% of returns)
Here:
$1,508
State:
$7,786
(% of AGI for various income ranges: 1.4% for AGIs below $25k, 0.6% for AGIs $50k-75k, 0.9% for AGIs $75k-100k, 1.2% for AGIs $100k-200k)
Net capital gain/loss in AGI: +$2,050 (reported on 14.0% of returns)
Here:
+$2,050
State:
+$22,183
Profit/loss from business: +$5,100 (reported on 20.9% of returns)
Here:
+$5,100
State:
+$12,903
(% of AGI for various income ranges: 8.9% for AGIs below $25k, 3.9% for AGIs $25k-50k, 2.7% for AGIs $75k-100k)
Taxable individual retirement arrangement distribution: $8,657 (reported on 16.3% of returns)
60918:
$8,657
Illinois:
$17,929
Total itemized deductions: $18,330 (21% of AGI, reported on 23.3% of returns)
Here:
$18,330
State:
$26,433
Here:
21.0% of AGI
State:
19.2% of AGI
(% of AGI for various income ranges: 22.4% for AGIs $25k-50k, 8.4% for AGIs $75k-100k, 8.0% for AGIs $100k-200k)
Charity contributions: $4,989 (reported on 20.9% of returns)
Here:
$4,989
State:
$4,525
(% of AGI for various income ranges: 3.6% for AGIs below $25k, 2.8% for AGIs $50k-75k, 3.3% for AGIs $100k-200k)
Taxes paid: $5,570 (reported on 23.3% of returns)
60918:
$5,570
State:
$11,968
(% of AGI for various income ranges: 4.4% for AGIs $25k-50k, 3.1% for AGIs $75k-100k, 3.2% for AGIs $100k-200k)
Earned income credit: $2,114 (reported on 16.3% of returns)
Here:
$2,114
State:
$2,349
(% of AGI for various income ranges: 7.0% for AGIs below $25k)
Percentage of individuals using paid preparers for their 2012 taxes: 67.4%
Here:
67%
State:
57%
(% for various income ranges: 58.8% for AGIs below $25k, 66.7% for AGIs $25k-50k, 71.4% for AGIs $50k-75k, 66.7% for AGIs $75k-100k, 100.0% for AGIs $100k-200k)
Averages for the 2004 tax year for zip code 60918, filed in 2005:
Average Adjusted Gross Income (AGI) in 2004: $34,538 (Individual Income Tax Returns)
Here:
$34,538
State:
$54,625
Salary/wage: $30,447 (reported on 75.3% of returns)
Here:
$30,447
State:
$46,811
(% of AGI for various income ranges: 58.0% for AGIs below $10k, 61.3% for AGIs $10k-25k, 70.1% for AGIs $25k-50k, 75.3% for AGIs $50k-75k, 90.5% for AGIs $75k-100k)
Taxable interest for individuals: $1,855 (reported on 55.1% of returns)
This zip code:
$1,855
Illinois:
$2,101
(% of AGI for various income ranges: 9.8% for AGIs below $10k, 6.0% for AGIs $10k-25k, 3.2% for AGIs $25k-50k, 2.1% for AGIs $50k-75k, 2.4% for AGIs $75k-100k)
Taxable dividends: $1,593 (reported on 32.0% of returns)
Here:
$1,593
State:
$4,306
(% of AGI for various income ranges: 2.9% for AGIs below $10k, 2.0% for AGIs $10k-25k, 1.3% for AGIs $25k-50k, 1.7% for AGIs $50k-75k, 1.8% for AGIs $75k-100k)
Net capital gain/loss: +$1,012 (reported on 19.2% of returns)
Here:
+$1,012
State:
+$17,321
(% of AGI for various income ranges: -0.5% for AGIs below $10k, 0.4% for AGIs $10k-25k, 0.0% for AGIs $25k-50k, 1.0% for AGIs $50k-75k, 1.5% for AGIs $75k-100k)
Profit/loss from business: +$4,701 (reported on 17.6% of returns)
Here:
+$4,701
State:
+$11,771
Profit/loss from farming: +$18,205 (reported on 10.1% of returns)
Here:
+$18,205
State:
+$2,327
IRA payment deduction: $2,667 (reported on 3.4% of returns)
60918:
$2,667
Illinois:
$3,087
Total itemized deductions: $14,640 (28% of AGI, reported on 20.4% of returns)
Here:
$14,640
State:
$20,239
Here:
28.3% of AGI
State:
19.5% of AGI
(% of AGI for various income ranges: 16.4% for AGIs $10k-25k, 8.6% for AGIs $25k-50k, 6.3% for AGIs $50k-75k, 14.3% for AGIs $75k-100k)
Charity contributions deductions: $4,230 (8% of AGI, reported on 16.9% of returns)
Here:
$4,230
State:
$3,719
Here:
7.9% of AGI
State:
3.4% of AGI
(% of AGI for various income ranges: 3.1% for AGIs $10k-25k, 1.5% for AGIs $25k-50k, 1.8% for AGIs $50k-75k, 4.7% for AGIs $75k-100k)
Total tax: $4,012 (reported on 76.0% of returns)
60918:
$4,012
State:
$9,882
(% of AGI for various income ranges: 3.9% for AGIs below $10k, 4.3% for AGIs $10k-25k, 7.3% for AGIs $25k-50k, 7.7% for AGIs $50k-75k, 12.5% for AGIs $75k-100k, 19.4% for AGIs over 100k)
Earned income credit: $1,600 (reported on 12.6% of returns)
Here:
$1,600
State:
$1,788
Percentage of individuals using paid preparers for their 2004 taxes: 75.5%
Here:
76%
State:
61%
(% for various income ranges: 71.3% for AGIs below $10k, 80.2% for AGIs $10k-25k, 70.2% for AGIs $25k-50k, 78.4% for AGIs $50k-75k, 76.9% for AGIs $75k-100k, 100.0% for AGIs over 100k)
Household received Food Stamps/SNAP in the past 12 months: 48 Household did not receive Food Stamps/SNAP in the past 12 months: 236
Women who had a birth in the past 12 months: 7 (0 now married, 7 unmarried) Women who did not have a birth in the past 12 months: 78 (39 now married, 38 unmarried)
Housing units in zip code 60918 with a mortgage: 88 (1 second mortgage, 1 both second mortgage and home equity loan) Houses without a mortgage: 4
Median monthly owner costs for units with a mortgage: $1,053 Median monthly owner costs for units without a mortgage: $538
Residents with income below the poverty level in 2022:
This zip code:
12.5%
Whole state:
11.9%
Residents with income below 50% of the poverty level in 2022:
This zip code:
4.2%
Whole state:
5.7%
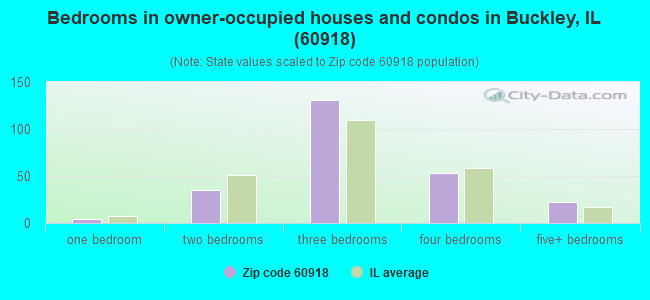
Median number of rooms in houses and condos:
Here:
6.4
State:
6.4
Median number of rooms in apartments:
Here:
4.9
State:
4.1
Notable locations in this zip code not listed on our city pages
Size of family households: 119 2-persons, 25 3-persons, 34 4-persons, 21 5-persons
Size of nonfamily households: 76 1-person, 5 2-persons
63 married couples with children.
48 single-parent households (3 men, 45 women).
98.5% of residents of 60918 zip code speak English at home.
0.8% of residents speak Spanish at home (100% very well).
0.2% of residents speak other Indo-European language at home (100% very well).
Foreign born population: 0 (0.0%)
:
0.0%
Whole state:
14.4%
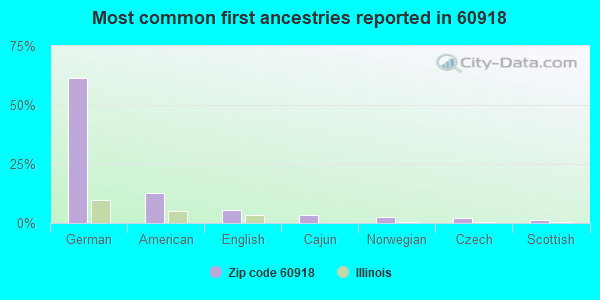
61%German
13%American
5%English
3%Cajun
3%Norwegian
2%Czech
1%Scottish
Year of entry for the foreign-born population
02010 or later
02000 to 2009
01990 to 1999
1Before 1990
Facilities with environmental interests located in this zip code:
LUDLOW COOPERATIVE ELEVATOR CO (102 W CENTRAL in BUCKLEY, IL)
STATE MASTER (Illinois EPA Project) - AIR PROGRAM, AIR MINOR (AIRS/AFS) CRITERIA AND HAZARDOUS AIR POLLUTANT INVENTORY (Inventory of air pollution sources) Business SIC classification: GRAIN AND FIELD BEANS
IL DOT-I-57 IROQUOIS COUNTY (I57 MAINLINE REST AREA in BUCKLEY, IL)
STATE MASTER (Illinois EPA Project) - National Pollutant Discharge Elimination System Permit National Pollutant Discharge Elimination System NON-MAJOR (Tracking pollutant discharge elimination systems) - permit Business SIC classification: REGULATION AND ADMINISTRATION OF TRANSPORTATION PROGRAMS Alternative names: I-57 REST AREA, IL DOT-I57 IROQUOIS CO
IDOT (BRG 038-0076 in BUCKLEY, IL)
(Resource Conservation and Recovery Act (tracking hazardous waste))
MARATHON ASHLAND PIPE LINE LLC (600 FT E OF CR 600N AND 200E in BUCKLEY, IL)
Conditionally Exempt Small Quantity Generators, less than 100 kg/month of hazardous waste (Resource Conservation and Recovery Act (tracking hazardous waste)) - notification Organizations: MARATHON ASHLAND PIPELINE LLC (CONTACT/OWNER)
Housing units lacking complete plumbing facilities: 5.0% Housing units lacking complete kitchen facilities: 1.5%
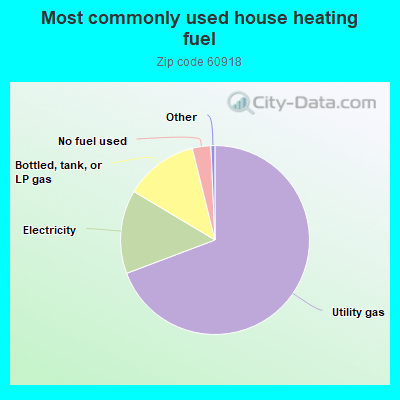
69.6%Utility gas
14.4%Electricity
12.6%Bottled, tank, or LP gas
3.2%No fuel used
Population in 1990: 875. Population change in the 1990s: +38 (+4.3%).
Place of birth for U.S.-born residents:
This state: 500
Northeast: 6
Midwest: 14
South: 64
West: 21
72% of the 60918 zip code residents lived in the same house 5 years ago. Out of people who lived in different houses, 53% lived in this county. Out of people who lived in different counties, 50% lived in Illinois.
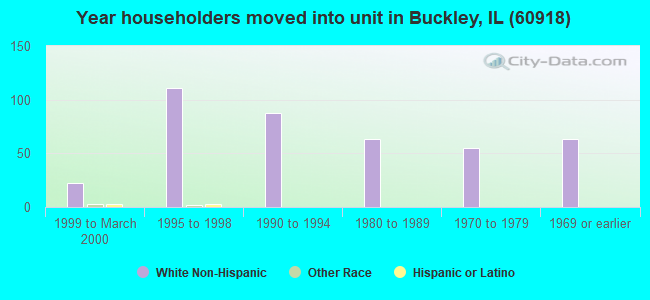
95% of the 60918 zip code residents lived in the same house 1 year ago. Out of people who lived in different houses, 64% moved from this county. Out of people who lived in different houses, 27% moved from different county within same state.
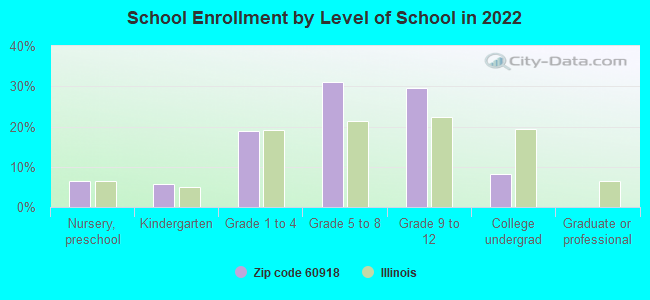
Private vs. public school enrollment:
Students in private schools in grades 1 to 8 (elementary and middle school): 41
Here:
64.4%
Illinois:
13.3%
Students in private schools in grades 9 to 12 (high school): 4
Here:
13.4%
Illinois:
9.9%
Students in private undergraduate colleges:
Here:
0.0%
Illinois:
27.4%
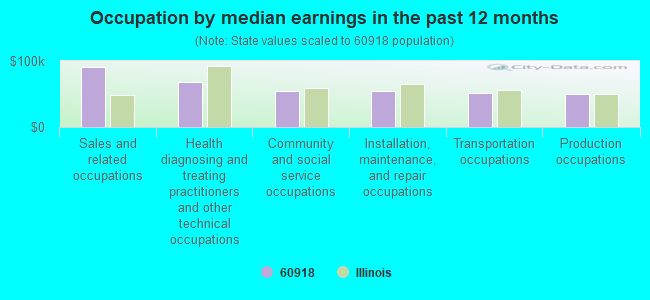
Occupation by median earnings in the past 12 months ($)
90,540Sales and related occupations
68,808Health diagnosing and treating practitioners and other technical occupations
54,969Community and social service occupations
54,498Installation, maintenance, and repair occupations
51,752Transportation occupations
50,270Production occupations
Top industries in this zip code by the number of employees in 2005:
Other Services (except Public Administration): Religious Organizations (10-19 employees: 1 establishment)
Finance and Insurance: Commercial Banking (5-9: 1)
Educational Services: Elementary and Secondary Schools (5-9: 1)
Finance and Insurance: All Other Insurance Related Activities (5-9: 1)
Accommodation and Food Services: Full-Service Restaurants (1-4: 2)
Administrative and Support and Waste Management and Remediation Services: Landscaping Services (1-4: 1)
Wholesale Trade: Grain and Field Bean Merchant Wholesalers (1-4: 1)
Fatal accident statistics in 2011:
Fatal accident count: 1
Vehicles involved in fatal accidents: 1
Fatal accidents caused by drunken drivers: 0
Fatalities: 1
Persons involved in fatal accidents: 1
Pedestrians involved in fatal accidents: 0
Fatal accident statistics in 2010:
Fatal accident count: 2
Vehicles involved in fatal accidents: 4
Fatal accidents caused by drunken drivers: 1
Fatalities: 2
Persons involved in fatal accidents: 4
Pedestrians involved in fatal accidents: 0
2002 - 2018 National Fire Incident Reporting System (NFIRS) incidents
According to the data from the years 2002 - 2018 the average number of fire incidents per year is 10. The highest number of reported fire incidents - 23 took place in 2007, and the least - 2 in 2005. The data has a declining trend.
When looking into fire subcategories, the most reports belonged to: Outside Fires (43.3%), and Mobile Property/Vehicle Fires (31.1%).
Fire incident types reported to NFIRS in Zip Code 60918

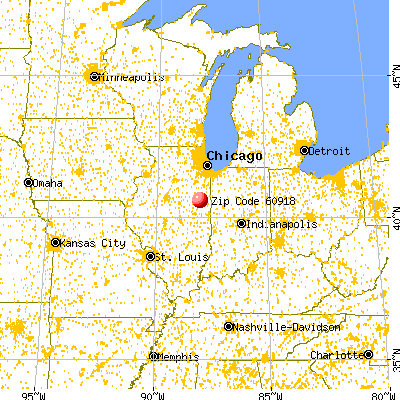


 Nearest zip codes: 60948, 60955, 60968, 60924, 60962, 60938.


 According to the data from the years 2002 - 2018 the average number of fire incidents per year is 10. The highest number of reported fire incidents - 23 took place in 2007, and the least - 2 in 2005. The data has a declining trend.
 When looking into fire subcategories, the most reports belonged to: Outside Fires (43.3%), and Mobile Property/Vehicle Fires (31.1%).