Averages for the 2020 tax year for zip code 61038, filed in 2021:
Average Adjusted Gross Income (AGI) in 2020: $65,527 (Individual Income Tax Returns)
Here:
$65,527
State:
$82,626
Salary/wage: $51,557 (reported on 75.8% of returns)
Here:
$51,557
State:
$66,640
(% of AGI for various income ranges: 1107.3% for AGIs below $25k, 3551.5% for AGIs $25k-50k, 6223.3% for AGIs $50k-75k, 7142.0% for AGIs $75k-100k, 17344.0% for AGIs $100k-200k)
Taxable interest for individuals: $530 (reported on 32.3% of returns)
This zip code:
$530
Illinois:
$2,376
(% of AGI for various income ranges: 10.9% for AGIs below $25k, 21.5% for AGIs $25k-50k, 16.7% for AGIs $50k-75k, 20.0% for AGIs $75k-100k, 48.0% for AGIs $100k-200k)
Ordinary dividends: $3,600 (reported on 17.7% of returns)
Here:
$3,600
State:
$9,061
(% of AGI for various income ranges: 60.8% for AGIs $25k-50k, 91.7% for AGIs $50k-75k, 524.0% for AGIs $100k-200k)
Net capital gain/loss in AGI: +$13,740 (reported on 16.1% of returns)
Here:
+$13,740
State:
+$31,684
(% of AGI for various income ranges: 40.0% for AGIs $25k-50k, 105.0% for AGIs $50k-75k, 2518.0% for AGIs $100k-200k)
Profit/loss from business: +$12,389 (reported on 14.5% of returns)
Here:
+$12,389
State:
+$12,175
(% of AGI for various income ranges: 178.2% for AGIs below $25k, 368.5% for AGIs $25k-50k, 880.0% for AGIs $75k-100k)
Taxable individual retirement arrangement distribution: $16,929 (reported on 11.3% of returns)
61038:
$16,929
Illinois:
$21,613
(% of AGI for various income ranges: 403.8% for AGIs $25k-50k, 1320.0% for AGIs $100k-200k)
Total itemized deductions: $25,733 (reported on 4.8% of returns)
Here:
$25,733
State:
$34,948
(% of AGI for various income ranges: 1544.0% for AGIs $75k-100k)
Charity contributions: $4,450 (reported on 3.2% of returns)
Here:
$4,450
State:
$13,122
(% of AGI for various income ranges: 68.5% for AGIs $25k-50k)
Taxes paid: $7,100 (reported on 4.8% of returns)
61038:
$7,100
State:
$8,563
(% of AGI for various income ranges: 426.0% for AGIs $75k-100k)
Earned income credit: $1,912 (reported on 12.9% of returns)
Here:
$1,912
State:
$2,311
(% of AGI for various income ranges: 70.9% for AGIs below $25k, 57.7% for AGIs $25k-50k)
Percentage of individuals using paid preparers for their 2020 taxes: 93.5%
Here:
94%
State:
93%
(% for various income ranges: 94.1% for AGIs below $25k, 94.1% for AGIs $25k-50k, 88.9% for AGIs $50k-75k, 100.0% for AGIs $75k-100k, 90.0% for AGIs $100k-200k, 100.0% for AGIs over 200k)
Averages for the 2012 tax year for zip code 61038, filed in 2013:
Average Adjusted Gross Income (AGI) in 2012: $53,869 (Individual Income Tax Returns)
Here:
$53,869
State:
$68,058
Salary/wage: $43,315 (reported on 85.2% of returns)
Here:
$43,315
State:
$55,396
(% of AGI for various income ranges: 76.3% for AGIs below $25k, 75.1% for AGIs $25k-50k, 75.1% for AGIs $50k-75k, 66.4% for AGIs $75k-100k, 62.3% for AGIs $100k-200k)
Taxable interest for individuals: $600 (reported on 36.1% of returns)
This zip code:
$600
Illinois:
$1,969
(% of AGI for various income ranges: 0.5% for AGIs below $25k, 0.6% for AGIs $25k-50k, 0.3% for AGIs $50k-75k, 0.4% for AGIs $75k-100k, 0.3% for AGIs $100k-200k)
Ordinary dividends: $1,723 (reported on 21.3% of returns)
Here:
$1,723
State:
$7,786
(% of AGI for various income ranges: 2.3% for AGIs below $25k, 1.5% for AGIs $50k-75k, 0.6% for AGIs $100k-200k)
Net capital gain/loss in AGI: +$2,650 (reported on 13.1% of returns)
Here:
+$2,650
State:
+$22,183
(% of AGI for various income ranges: 1.8% for AGIs $100k-200k)
Profit/loss from business: +$7,144 (reported on 14.8% of returns)
Here:
+$7,144
State:
+$12,903
(% of AGI for various income ranges: 3.8% for AGIs below $25k, 6.3% for AGIs $25k-50k, 3.3% for AGIs $75k-100k)
Taxable individual retirement arrangement distribution: $11,783 (reported on 9.8% of returns)
61038:
$11,783
Illinois:
$17,929
Total itemized deductions: $18,486 (21% of AGI, reported on 34.4% of returns)
Here:
$18,486
State:
$26,433
Here:
20.7% of AGI
State:
19.2% of AGI
(% of AGI for various income ranges: 14.8% for AGIs $25k-50k, 13.3% for AGIs $50k-75k, 12.5% for AGIs $75k-100k, 12.1% for AGIs $100k-200k)
Charity contributions: $2,727 (reported on 24.6% of returns)
Here:
$2,727
State:
$4,525
(% of AGI for various income ranges: 0.5% for AGIs $25k-50k, 1.0% for AGIs $50k-75k, 1.8% for AGIs $75k-100k, 1.6% for AGIs $100k-200k)
Taxes paid: $7,818 (reported on 36.1% of returns)
61038:
$7,818
State:
$11,968
(% of AGI for various income ranges: 5.3% for AGIs $25k-50k, 5.1% for AGIs $50k-75k, 5.0% for AGIs $75k-100k, 6.5% for AGIs $100k-200k)
Earned income credit: $2,088 (reported on 13.1% of returns)
Here:
$2,088
State:
$2,349
(% of AGI for various income ranges: 4.3% for AGIs below $25k, 1.0% for AGIs $25k-50k)
Percentage of individuals using paid preparers for their 2012 taxes: 65.6%
Here:
66%
State:
57%
(% for various income ranges: 57.1% for AGIs below $25k, 64.3% for AGIs $25k-50k, 70.0% for AGIs $50k-75k, 75.0% for AGIs $75k-100k, 75.0% for AGIs $100k-200k)
Averages for the 2004 tax year for zip code 61038, filed in 2005:
Average Adjusted Gross Income (AGI) in 2004: $46,777 (Individual Income Tax Returns)
Here:
$46,777
State:
$54,625
Salary/wage: $41,535 (reported on 86.4% of returns)
Here:
$41,535
State:
$46,811
(% of AGI for various income ranges: 695.5% for AGIs below $10k, 79.6% for AGIs $10k-25k, 79.5% for AGIs $25k-50k, 85.5% for AGIs $50k-75k, 78.6% for AGIs $75k-100k, 59.0% for AGIs over 100k)
Taxable interest for individuals: $983 (reported on 53.9% of returns)
This zip code:
$983
Illinois:
$2,101
(% of AGI for various income ranges: 30.3% for AGIs below $10k, 2.1% for AGIs $10k-25k, 1.4% for AGIs $25k-50k, 0.5% for AGIs $50k-75k, 0.7% for AGIs $75k-100k, 1.2% for AGIs over 100k)
Taxable dividends: $1,297 (reported on 26.7% of returns)
Here:
$1,297
State:
$4,306
(% of AGI for various income ranges: 15.7% for AGIs below $10k, 0.5% for AGIs $10k-25k, 0.4% for AGIs $25k-50k, 0.7% for AGIs $50k-75k, 0.4% for AGIs $75k-100k, 1.2% for AGIs over 100k)
Net capital gain/loss: +$1,750 (reported on 17.7% of returns)
Here:
+$1,750
State:
+$17,321
(% of AGI for various income ranges: 5.6% for AGIs below $10k, -0.6% for AGIs $10k-25k, 0.0% for AGIs $25k-50k, 0.4% for AGIs $50k-75k, 0.6% for AGIs $75k-100k, 1.6% for AGIs over 100k)
Profit/loss from business: +$7,365 (reported on 15.9% of returns)
Here:
+$7,365
State:
+$11,771
(% of AGI for various income ranges: 61.8% for AGIs below $10k, 3.7% for AGIs $25k-50k, 2.7% for AGIs $50k-75k, 2.4% for AGIs $75k-100k, 1.6% for AGIs over 100k)
IRA payment deduction: $2,929 (reported on 2.1% of returns)
61038:
$2,929
Illinois:
$3,087
Total itemized deductions: $16,233 (20% of AGI, reported on 34.0% of returns)
Here:
$16,233
State:
$20,239
Here:
20.0% of AGI
State:
19.5% of AGI
(% of AGI for various income ranges: 11.6% for AGIs $10k-25k, 11.0% for AGIs $25k-50k, 12.5% for AGIs $50k-75k, 14.1% for AGIs $75k-100k, 10.4% for AGIs over 100k)
Charity contributions deductions: $2,093 (3% of AGI, reported on 29.5% of returns)
Here:
$2,093
State:
$3,719
Here:
2.5% of AGI
State:
3.4% of AGI
(% of AGI for various income ranges: 0.9% for AGIs $10k-25k, 1.0% for AGIs $25k-50k, 1.3% for AGIs $50k-75k, 1.8% for AGIs $75k-100k, 1.3% for AGIs over 100k)
Total tax: $6,985 (reported on 79.8% of returns)
61038:
$6,985
State:
$9,882
(% of AGI for various income ranges: 36.0% for AGIs below $10k, 4.7% for AGIs $10k-25k, 7.1% for AGIs $25k-50k, 9.1% for AGIs $50k-75k, 11.0% for AGIs $75k-100k, 20.0% for AGIs over 100k)
Earned income credit: $1,406 (reported on 10.5% of returns)
Here:
$1,406
State:
$1,788
Percentage of individuals using paid preparers for their 2004 taxes: 64.1%
Here:
64%
State:
61%
(% for various income ranges: 57.7% for AGIs below $10k, 62.6% for AGIs $10k-25k, 61.3% for AGIs $25k-50k, 68.3% for AGIs $50k-75k, 67.1% for AGIs $75k-100k, 81.8% for AGIs over 100k)
Household received Food Stamps/SNAP in the past 12 months: 60 Household did not receive Food Stamps/SNAP in the past 12 months: 289
Women who had a birth in the past 12 months: 48 (23 now married, 25 unmarried) Women who did not have a birth in the past 12 months: 230 (71 now married, 160 unmarried)
Housing units in zip code 61038 with a mortgage: 296 (47 second mortgage, 47 both second mortgage and home equity loan) Median monthly owner costs for units with a mortgage: $1,551 Median monthly owner costs for units without a mortgage: $938
Residents with income below the poverty level in 2022:
This zip code:
14.6%
Whole state:
11.9%
Residents with income below 50% of the poverty level in 2022:
This zip code:
11.3%
Whole state:
5.7%
Median number of rooms in houses and condos:
Here:
6.1
State:
6.4
Notable locations in this zip code not listed on our city pages
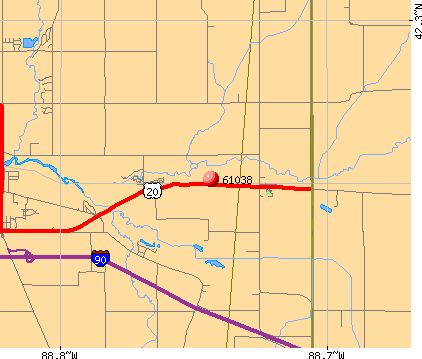
Notable locations in zip code 61038: Shanks Farm (A), Camp Epworth (B), Boone County Rural Fire Protection District 2 Station 2 (C). Display/hide their locations on the map
Size of family households: 97 2-persons, 36 3-persons, 23 4-persons, 54 5-persons, 23 6-persons, 30 7-or-more-persons
Size of nonfamily households: 40 1-person, 41 2-persons
144 married couples with children.
104 single-parent households (104 men).
99.6% of residents of 61038 zip code speak English at home.
Foreign born population: 0 (0.0%)
:
0.0%
Whole state:
14.4%
28%Swedish
24%German
18%English
15%American
12%Belgian
4%Scandinavian
4%Italian
Facilities with environmental interests located in this zip code:
KISHWAUKEE ELEM SCHOOL (7133 GARDEN PRAIRIE in GARDEN PRAIRIE, IL)
(National Center for Education Statistics) - STATE ID-0400410002004 Organizations: BELVIDERE C U SCH DIST 100 (SCHOOL DISTRICT)
MEYERS TRUCKING (11450 U.S. 20 in GARDEN PRAIRIE, IL)
National Pollutant Discharge Elimination System NON-MAJOR (Tracking pollutant discharge elimination systems) - permit
36.4%Utility gas
30.5%Bottled, tank, or LP gas
29.9%Electricity
3.8%Fuel oil, kerosene, etc.
Population in 1990: 1,584.
Place of birth for U.S.-born residents:
This state: 1,092
Midwest: 96
South: 21
64% of the 61038 zip code residents lived in the same house 5 years ago. Out of people who lived in different houses, 29% lived in this county. Out of people who lived in different counties, 50% lived in Illinois.
96% of the 61038 zip code residents lived in the same house 1 year ago. Out of people who lived in different houses, 93% moved from this county.
Private vs. public school enrollment:
Students in private schools in grades 1 to 8 (elementary and middle school):
Here:
0.0%
Illinois:
13.3%
Students in private schools in grades 9 to 12 (high school):
Here:
0.0%
Illinois:
9.9%
Occupation by median earnings in the past 12 months ($)
96,298Construction and extraction occupations
55,539Management occupations
51,539Sales and related occupations
18,134Office and administrative support occupations
2,553Food preparation and serving related occupations
Top industries in this zip code by the number of employees in 2005:
Construction: New Single-Family Housing Construction (except Operative Builders) (10-19 employees: 1 establishment, 5-9 employees: 1 establishment)
Accommodation and Food Services: Full-Service Restaurants (5-9: 1)
Construction: Plumbing, Heating, and Air-Conditioning Contractors (5-9: 1)
Mining: Construction Sand and Gravel Mining (5-9: 1)
Construction: Water and Sewer Line and Related Structures Construction (5-9: 1)
Accommodation and Food Services: RV (Recreational Vehicle) Parks and Campgrounds (5-9: 1)
Fatal accident statistics in 2013:
Fatal accident count: 1
Vehicles involved in fatal accidents: 1
Fatal accidents caused by drunken drivers: 0
Fatalities: 1
Persons involved in fatal accidents: 1
Pedestrians involved in fatal accidents: 0
Fatal accident statistics in 2012:
Fatal accident count: 3
Vehicles involved in fatal accidents: 3
Fatal accidents caused by drunken drivers: 1
Fatalities: 3
Persons involved in fatal accidents: 3
Pedestrians involved in fatal accidents: 0
Home Mortgage Disclosure Act Aggregated Statistics For Year 2009 (Based on 4 partial tracts)
A) FHA, FSA/RHS & VA Home Purchase Loans
B) Conventional Home Purchase Loans
C) Refinancings
D) Home Improvement Loans
F) Non-occupant Loans on < 5 Family Dwellings (A B C & D)
G) Loans On Manufactured Home Dwelling (A B C & D)
Number
Average Value
Number
Average Value
Number
Average Value
Number
Average Value
Number
Average Value
Number
Average Value
LOANS ORIGINATED
29
$179,380
73
$202,987
527
$199,058
16
$60,910
9
$188,816
1
$49,850
APPLICATIONS APPROVED, NOT ACCEPTED
1
$101,350
8
$186,991
41
$203,028
4
$129,105
2
$162,625
1
$46,560
APPLICATIONS DENIED
4
$130,125
12
$164,559
104
$215,464
5
$26,704
2
$52,570
4
$43,980
APPLICATIONS WITHDRAWN
7
$155,617
11
$181,444
83
$209,682
0
$0
4
$137,340
0
$0
FILES CLOSED FOR INCOMPLETENESS
1
$203,770
0
$0
17
$206,994
0
$0
0
$0
0
$0
Aggregated Statistics For Year 2008 (Based on 4 partial tracts)
A) FHA, FSA/RHS & VA Home Purchase Loans
B) Conventional Home Purchase Loans
C) Refinancings
D) Home Improvement Loans
F) Non-occupant Loans on < 5 Family Dwellings (A B C & D)
G) Loans On Manufactured Home Dwelling (A B C & D)
Number
Average Value
Number
Average Value
Number
Average Value
Number
Average Value
Number
Average Value
Number
Average Value
LOANS ORIGINATED
16
$172,576
67
$210,654
240
$214,681
18
$73,677
8
$155,762
1
$58,920
APPLICATIONS APPROVED, NOT ACCEPTED
0
$0
15
$227,245
35
$228,162
5
$66,526
1
$331,070
1
$33,780
APPLICATIONS DENIED
4
$214,992
7
$176,053
95
$232,626
11
$40,496
4
$152,128
2
$45,635
APPLICATIONS WITHDRAWN
3
$175,297
11
$264,015
50
$215,763
2
$135,980
1
$329,470
0
$0
FILES CLOSED FOR INCOMPLETENESS
1
$156,290
2
$179,785
13
$190,769
0
$0
0
$0
0
$0
Aggregated Statistics For Year 2007 (Based on 4 partial tracts)
A) FHA, FSA/RHS & VA Home Purchase Loans
B) Conventional Home Purchase Loans
C) Refinancings
D) Home Improvement Loans
F) Non-occupant Loans on < 5 Family Dwellings (A B C & D)
G) Loans On Manufactured Home Dwelling (A B C & D)
Number
Average Value
Number
Average Value
Number
Average Value
Number
Average Value
Number
Average Value
Number
Average Value
LOANS ORIGINATED
2
$154,090
139
$210,197
201
$198,173
31
$68,770
14
$157,946
2
$47,585
APPLICATIONS APPROVED, NOT ACCEPTED
1
$186,640
16
$192,535
29
$184,719
4
$69,885
0
$0
0
$0
APPLICATIONS DENIED
2
$146,880
23
$190,441
118
$217,867
17
$58,935
4
$185,558
2
$31,520
APPLICATIONS WITHDRAWN
0
$0
16
$196,956
68
$233,910
2
$139,410
2
$440,705
0
$0
FILES CLOSED FOR INCOMPLETENESS
0
$0
3
$189,873
21
$201,630
0
$0
0
$0
0
$0
Aggregated Statistics For Year 2006 (Based on 4 partial tracts)
A) FHA, FSA/RHS & VA Home Purchase Loans
B) Conventional Home Purchase Loans
C) Refinancings
D) Home Improvement Loans
F) Non-occupant Loans on < 5 Family Dwellings (A B C & D)
G) Loans On Manufactured Home Dwelling (A B C & D)
Number
Average Value
Number
Average Value
Number
Average Value
Number
Average Value
Number
Average Value
Number
Average Value
LOANS ORIGINATED
6
$195,287
236
$183,218
213
$182,276
26
$68,048
15
$215,169
4
$38,625
APPLICATIONS APPROVED, NOT ACCEPTED
0
$0
26
$157,557
32
$173,442
5
$31,808
2
$93,065
3
$46,367
APPLICATIONS DENIED
1
$198,010
43
$149,601
123
$207,118
15
$66,839
8
$233,025
2
$30,490
APPLICATIONS WITHDRAWN
0
$0
19
$159,552
64
$215,514
2
$61,680
9
$211,191
0
$0
FILES CLOSED FOR INCOMPLETENESS
0
$0
5
$253,208
11
$174,264
0
$0
2
$370,820
0
$0
Aggregated Statistics For Year 2005 (Based on 4 partial tracts)
A) FHA, FSA/RHS & VA Home Purchase Loans
B) Conventional Home Purchase Loans
C) Refinancings
D) Home Improvement Loans
F) Non-occupant Loans on < 5 Family Dwellings (A B C & D)
G) Loans On Manufactured Home Dwelling (A B C & D)
Number
Average Value
Number
Average Value
Number
Average Value
Number
Average Value
Number
Average Value
Number
Average Value
LOANS ORIGINATED
5
$187,050
230
$177,923
229
$188,744
28
$96,954
10
$122,068
4
$35,705
APPLICATIONS APPROVED, NOT ACCEPTED
1
$131,020
23
$149,410
40
$173,104
3
$335,147
1
$72,100
4
$35,740
APPLICATIONS DENIED
0
$0
32
$163,024
108
$180,299
18
$41,293
2
$103,205
3
$25,680
APPLICATIONS WITHDRAWN
0
$0
22
$143,684
70
$207,107
11
$175,594
4
$120,810
0
$0
FILES CLOSED FOR INCOMPLETENESS
0
$0
5
$131,366
20
$222,578
1
$91,880
0
$0
0
$0
Aggregated Statistics For Year 2004 (Based on 4 partial tracts)
A) FHA, FSA/RHS & VA Home Purchase Loans
B) Conventional Home Purchase Loans
C) Refinancings
D) Home Improvement Loans
E) Loans on Dwellings For 5+ Families
F) Non-occupant Loans on < 5 Family Dwellings (A B C & D)
G) Loans On Manufactured Home Dwelling (A B C & D)
Number
Average Value
Number
Average Value
Number
Average Value
Number
Average Value
Number
Average Value
Number
Average Value
Number
Average Value
LOANS ORIGINATED
9
$170,119
221
$189,223
235
$172,806
19
$67,763
1
$118,270
17
$146,191
5
$45,010
APPLICATIONS APPROVED, NOT ACCEPTED
3
$156,040
26
$157,315
21
$183,556
3
$233,910
0
$0
3
$152,847
1
$65,920
APPLICATIONS DENIED
1
$156,150
24
$219,825
79
$164,113
11
$54,397
0
$0
2
$56,175
3
$21,747
APPLICATIONS WITHDRAWN
0
$0
28
$177,390
65
$182,352
4
$157,720
0
$0
1
$167,560
0
$0
FILES CLOSED FOR INCOMPLETENESS
0
$0
6
$123,025
9
$177,771
3
$56,503
0
$0
0
$0
0
$0
Aggregated Statistics For Year 2003 (Based on 4 partial tracts)
A) FHA, FSA/RHS & VA Home Purchase Loans
B) Conventional Home Purchase Loans
C) Refinancings
D) Home Improvement Loans
F) Non-occupant Loans on < 5 Family Dwellings (A B C & D)
Number
Average Value
Number
Average Value
Number
Average Value
Number
Average Value
Number
Average Value
LOANS ORIGINATED
11
$169,513
191
$179,678
849
$164,903
12
$29,227
9
$135,338
APPLICATIONS APPROVED, NOT ACCEPTED
1
$180,870
19
$132,191
42
$172,493
0
$0
1
$112,640
APPLICATIONS DENIED
1
$162,700
17
$132,676
89
$150,317
5
$46,658
2
$79,515
APPLICATIONS WITHDRAWN
0
$0
20
$184,979
71
$184,040
1
$125,800
1
$132,000
FILES CLOSED FOR INCOMPLETENESS
0
$0
3
$162,790
13
$162,572
1
$58,920
0
$0
Aggregated Statistics For Year 2002 (Based on 4 partial tracts)
A) FHA, FSA/RHS & VA Home Purchase Loans
B) Conventional Home Purchase Loans
C) Refinancings
D) Home Improvement Loans
F) Non-occupant Loans on < 5 Family Dwellings (A B C & D)
Number
Average Value
Number
Average Value
Number
Average Value
Number
Average Value
Number
Average Value
LOANS ORIGINATED
18
$140,797
175
$153,794
629
$170,094
17
$21,223
7
$116,637
APPLICATIONS APPROVED, NOT ACCEPTED
1
$99,970
18
$144,252
33
$148,307
3
$19,883
2
$126,300
APPLICATIONS DENIED
2
$139,390
18
$141,559
61
$155,652
11
$39,105
1
$95,740
APPLICATIONS WITHDRAWN
2
$109,680
12
$167,998
50
$195,093
2
$54,000
1
$88,700
FILES CLOSED FOR INCOMPLETENESS
0
$0
1
$178,820
12
$162,975
0
$0
0
$0
Aggregated Statistics For Year 2001 (Based on 4 partial tracts)
A) FHA, FSA/RHS & VA Home Purchase Loans
B) Conventional Home Purchase Loans
C) Refinancings
D) Home Improvement Loans
F) Non-occupant Loans on < 5 Family Dwellings (A B C & D)
Number
Average Value
Number
Average Value
Number
Average Value
Number
Average Value
Number
Average Value
LOANS ORIGINATED
11
$133,407
151
$151,587
496
$154,674
32
$37,170
8
$79,782
APPLICATIONS APPROVED, NOT ACCEPTED
1
$136,400
14
$141,544
28
$175,655
6
$34,877
0
$0
APPLICATIONS DENIED
0
$0
18
$90,195
66
$125,191
11
$38,913
0
$0
APPLICATIONS WITHDRAWN
0
$0
13
$171,034
42
$142,208
1
$20,600
3
$98,730
FILES CLOSED FOR INCOMPLETENESS
0
$0
2
$144,145
6
$177,725
0
$0
0
$0
Aggregated Statistics For Year 2000 (Based on 4 partial tracts)
A) FHA, FSA/RHS & VA Home Purchase Loans
B) Conventional Home Purchase Loans
C) Refinancings
D) Home Improvement Loans
F) Non-occupant Loans on < 5 Family Dwellings (A B C & D)
Number
Average Value
Number
Average Value
Number
Average Value
Number
Average Value
Number
Average Value
LOANS ORIGINATED
8
$137,368
143
$142,845
78
$113,364
33
$28,479
8
$107,059
APPLICATIONS APPROVED, NOT ACCEPTED
0
$0
16
$102,479
12
$83,815
4
$20,490
0
$0
APPLICATIONS DENIED
1
$97,860
23
$69,203
39
$98,195
3
$27,040
1
$28,160
APPLICATIONS WITHDRAWN
0
$0
9
$147,318
24
$105,883
3
$16,193
0
$0
FILES CLOSED FOR INCOMPLETENESS
1
$82,370
1
$185,560
7
$149,564
0
$0
0
$0
Aggregated Statistics For Year 1999 (Based on 2 partial tracts)
A) FHA, FSA/RHS & VA Home Purchase Loans
B) Conventional Home Purchase Loans
C) Refinancings
D) Home Improvement Loans
F) Non-occupant Loans on < 5 Family Dwellings (A B C & D)


 Nearest zip codes: 61008, 60152, 61012, 61065, 60135, 60145.